Eastman, GA Map & Demographics
Eastman Map
Eastman Overview
$22,787
PER CAPITA INCOME
$52,480
AVG FAMILY INCOME
$41,213
AVG HOUSEHOLD INCOME
$8,721
FAMILY INCOME DEFICIT
0.52
INEQUALITY / GINI INDEX
5,635
TOTAL POPULATION
2,879
MALE POPULATION
2,756
FEMALE POPULATION
104.46
MALES / 100 FEMALES
95.73
FEMALES / 100 MALES
38.5
MEDIAN AGE
3.2
AVG FAMILY SIZE
2.7
AVG HOUSEHOLD SIZE
2,146
LABOR FORCE [ PEOPLE ]
48.0%
PERCENT IN LABOR FORCE
2.1%
UNEMPLOYMENT RATE
Eastman Zip Codes
Eastman Area Codes
Income in Eastman
Income Overview in Eastman
Per Capita Income in Eastman is $22,787, while median incomes of families and households are $52,480 and $41,213 respectively.
| Characteristic | Number | Measure |
| Per Capita Income | 5,635 | $22,787 |
| Median Family Income | 1,325 | $52,480 |
| Mean Family Income | 1,325 | $78,670 |
| Median Household Income | 1,981 | $41,213 |
| Mean Household Income | 1,981 | $62,380 |
| Income Deficit | 1,325 | $8,721 |
| Wage / Income Gap (%) | 5,635 | 0.00% |
| Wage / Income Gap ($) | 5,635 | 100.00¢ per $1 |
| Gini / Inequality Index | 5,635 | 0.52 |
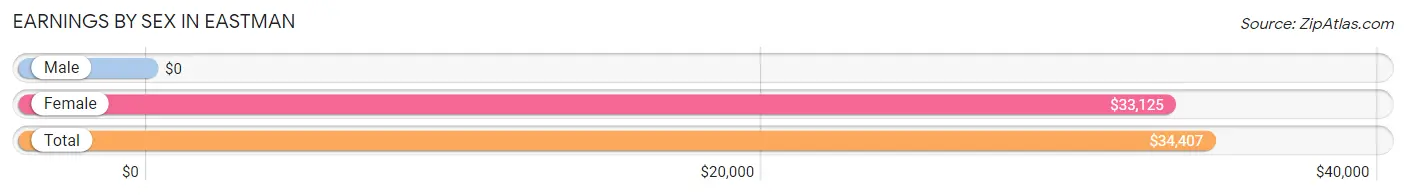
Earnings by Sex in Eastman
| Sex | Number | Average Earnings |
| Male | 1,143 (49.8%) | $0 |
| Female | 1,152 (50.2%) | $33,125 |
| Total | 2,295 (100.0%) | $34,407 |
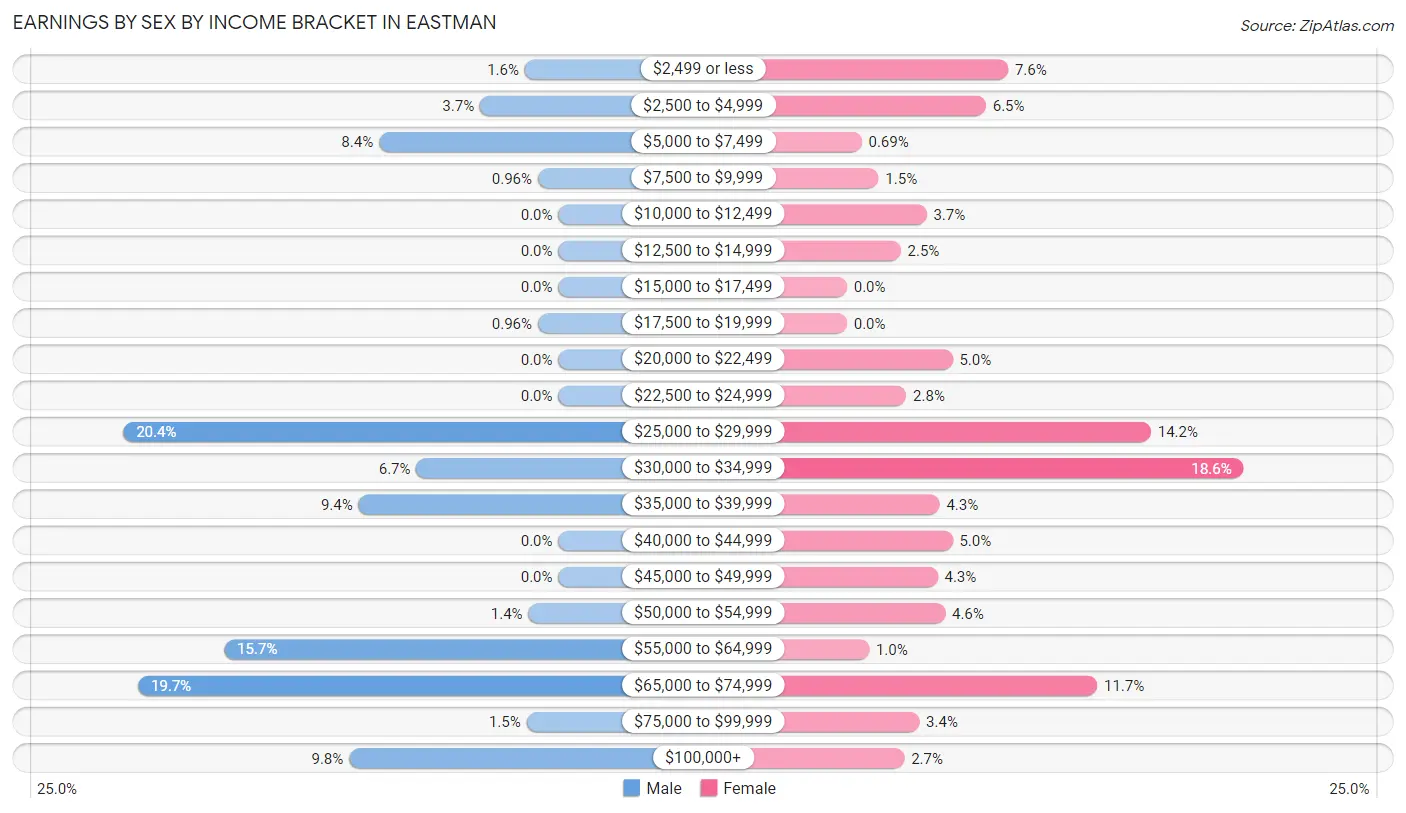
Earnings by Sex by Income Bracket in Eastman
The most common earnings brackets in Eastman are $25,000 to $29,999 for men (233 | 20.4%) and $30,000 to $34,999 for women (214 | 18.6%).
| Income | Male | Female |
| $2,499 or less | 18 (1.6%) | 87 (7.5%) |
| $2,500 to $4,999 | 42 (3.7%) | 75 (6.5%) |
| $5,000 to $7,499 | 96 (8.4%) | 8 (0.7%) |
| $7,500 to $9,999 | 11 (1.0%) | 17 (1.5%) |
| $10,000 to $12,499 | 0 (0.0%) | 43 (3.7%) |
| $12,500 to $14,999 | 0 (0.0%) | 29 (2.5%) |
| $15,000 to $17,499 | 0 (0.0%) | 0 (0.0%) |
| $17,500 to $19,999 | 11 (1.0%) | 0 (0.0%) |
| $20,000 to $22,499 | 0 (0.0%) | 57 (5.0%) |
| $22,500 to $24,999 | 0 (0.0%) | 32 (2.8%) |
| $25,000 to $29,999 | 233 (20.4%) | 164 (14.2%) |
| $30,000 to $34,999 | 76 (6.7%) | 214 (18.6%) |
| $35,000 to $39,999 | 107 (9.4%) | 50 (4.3%) |
| $40,000 to $44,999 | 0 (0.0%) | 57 (5.0%) |
| $45,000 to $49,999 | 0 (0.0%) | 49 (4.3%) |
| $50,000 to $54,999 | 16 (1.4%) | 53 (4.6%) |
| $55,000 to $64,999 | 179 (15.7%) | 12 (1.0%) |
| $65,000 to $74,999 | 225 (19.7%) | 135 (11.7%) |
| $75,000 to $99,999 | 17 (1.5%) | 39 (3.4%) |
| $100,000+ | 112 (9.8%) | 31 (2.7%) |
| Total | 1,143 (100.0%) | 1,152 (100.0%) |
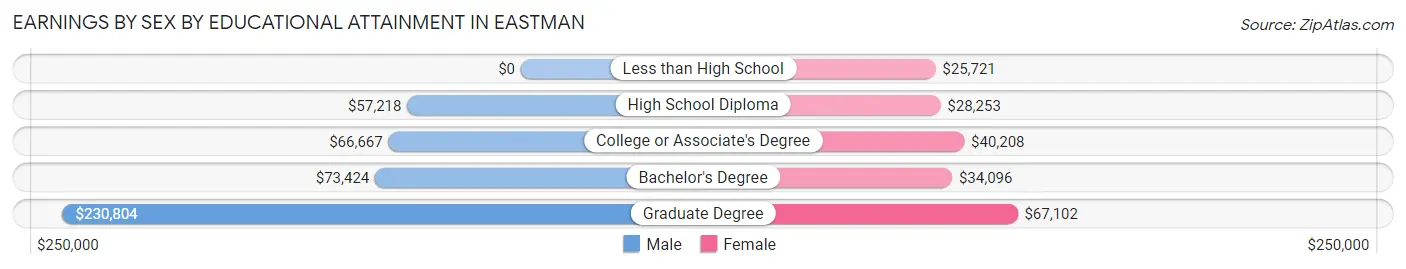
Earnings by Sex by Educational Attainment in Eastman
Average earnings in Eastman are $61,285 for men and $33,963 for women, a difference of 44.6%. Men with an educational attainment of graduate degree enjoy the highest average annual earnings of $230,804, while those with high school diploma education earn the least with $57,218. Women with an educational attainment of graduate degree earn the most with the average annual earnings of $67,102, while those with less than high school education have the smallest earnings of $25,721.
| Educational Attainment | Male Income | Female Income |
| Less than High School | - | - |
| High School Diploma | $57,218 | $28,253 |
| College or Associate's Degree | $66,667 | $40,208 |
| Bachelor's Degree | $73,424 | $34,096 |
| Graduate Degree | $230,804 | $67,102 |
| Total | $61,285 | $33,963 |
Family Income in Eastman
Family Income Brackets in Eastman
According to the Eastman family income data, there are 297 families falling into the $100,000 to $149,999 income range, which is the most common income bracket and makes up 22.4% of all families. Conversely, the $150,000 to $199,999 income bracket is the least frequent group with only 30 families (2.3%) belonging to this category.
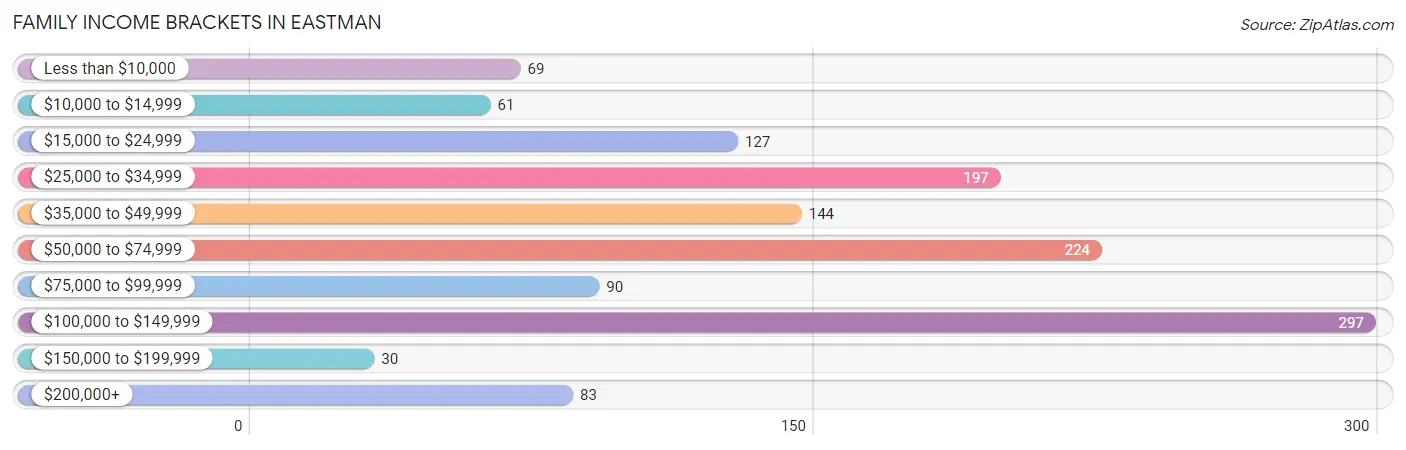
| Income Bracket | # Families | % Families |
| Less than $10,000 | 69 | 5.2% |
| $10,000 to $14,999 | 61 | 4.6% |
| $15,000 to $24,999 | 127 | 9.6% |
| $25,000 to $34,999 | 197 | 14.9% |
| $35,000 to $49,999 | 144 | 10.9% |
| $50,000 to $74,999 | 224 | 16.9% |
| $75,000 to $99,999 | 90 | 6.8% |
| $100,000 to $149,999 | 297 | 22.4% |
| $150,000 to $199,999 | 30 | 2.3% |
| $200,000+ | 83 | 6.3% |
Family Income by Famaliy Size in Eastman
5-person families (109 | 8.2%) account for the highest median family income in Eastman with $125,436 per family, while 4-person families (316 | 23.8%) have the highest median income of $27,098 per family member.
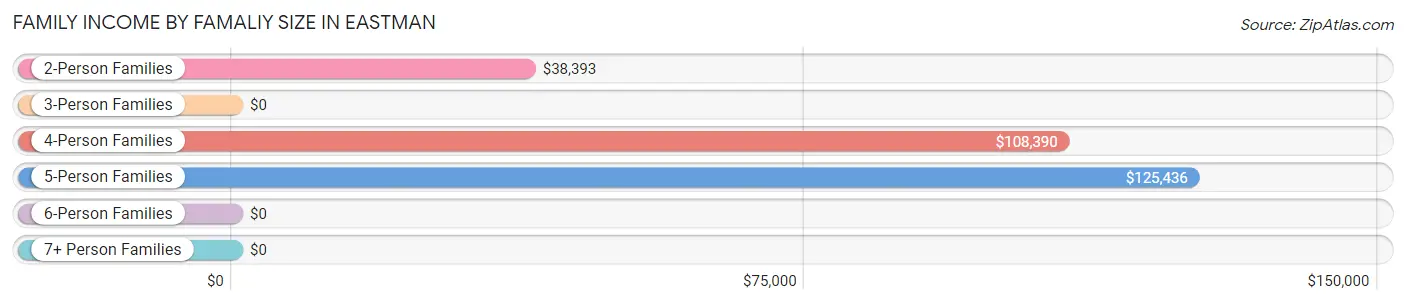
| Income Bracket | # Families | Median Income |
| 2-Person Families | 598 (45.1%) | $38,393 |
| 3-Person Families | 302 (22.8%) | $0 |
| 4-Person Families | 316 (23.8%) | $108,390 |
| 5-Person Families | 109 (8.2%) | $125,436 |
| 6-Person Families | 0 (0.0%) | $0 |
| 7+ Person Families | 0 (0.0%) | $0 |
| Total | 1,325 (100.0%) | $52,480 |
Family Income by Number of Earners in Eastman
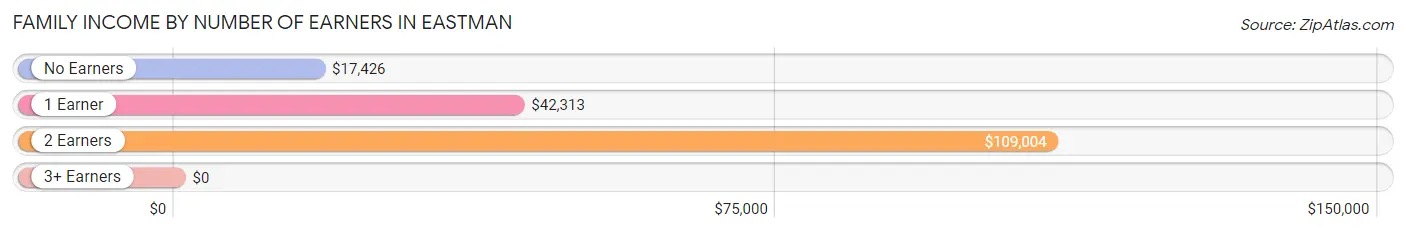
| Number of Earners | # Families | Median Income |
| No Earners | 293 (22.1%) | $17,426 |
| 1 Earner | 452 (34.1%) | $42,313 |
| 2 Earners | 567 (42.8%) | $109,004 |
| 3+ Earners | 13 (1.0%) | $0 |
| Total | 1,325 (100.0%) | $52,480 |
Household Income in Eastman
Household Income Brackets in Eastman
With 349 households falling in the category, the $50,000 to $74,999 income range is the most frequent in Eastman, accounting for 17.6% of all households. In contrast, only 32 households (1.6%) fall into the $150,000 to $199,999 income bracket, making it the least populous group.
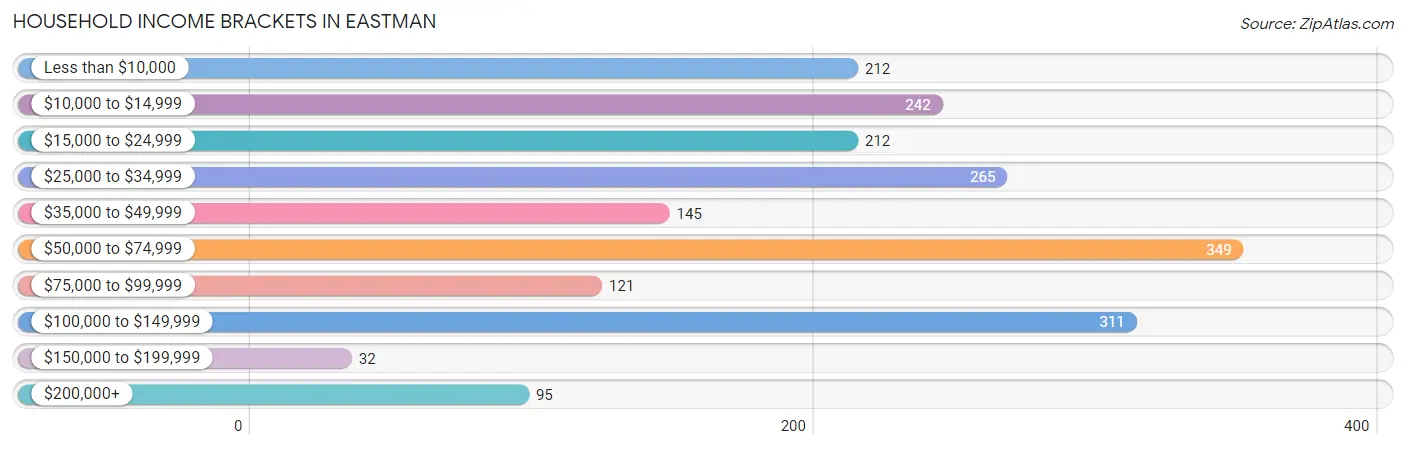
| Income Bracket | # Households | % Households |
| Less than $10,000 | 212 | 10.7% |
| $10,000 to $14,999 | 242 | 12.2% |
| $15,000 to $24,999 | 212 | 10.7% |
| $25,000 to $34,999 | 265 | 13.4% |
| $35,000 to $49,999 | 145 | 7.3% |
| $50,000 to $74,999 | 349 | 17.6% |
| $75,000 to $99,999 | 121 | 6.1% |
| $100,000 to $149,999 | 311 | 15.7% |
| $150,000 to $199,999 | 32 | 1.6% |
| $200,000+ | 95 | 4.8% |
Household Income by Householder Age in Eastman
The median household income in Eastman is $41,213, with the highest median household income of $71,302 found in the 25 to 44 years age bracket for the primary householder. A total of 715 households (36.1%) fall into this category. Meanwhile, the 65+ years age bracket for the primary householder has the lowest median household income of $15,163, with 501 households (25.3%) in this group.
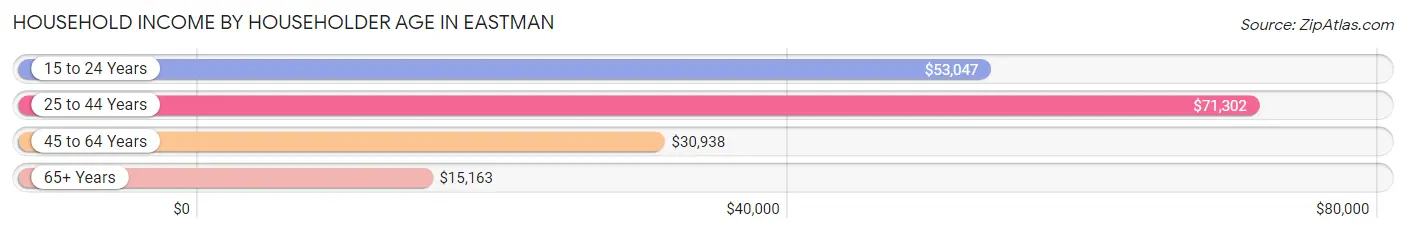
| Income Bracket | # Households | Median Income |
| 15 to 24 Years | 100 (5.1%) | $53,047 |
| 25 to 44 Years | 715 (36.1%) | $71,302 |
| 45 to 64 Years | 665 (33.6%) | $30,938 |
| 65+ Years | 501 (25.3%) | $15,163 |
| Total | 1,981 (100.0%) | $41,213 |
Poverty in Eastman
Income Below Poverty by Sex and Age in Eastman
With 22.0% poverty level for males and 25.7% for females among the residents of Eastman, 15 year old males and 65 to 74 year old females are the most vulnerable to poverty, with 19 males (100.0%) and 207 females (62.5%) in their respective age groups living below the poverty level.
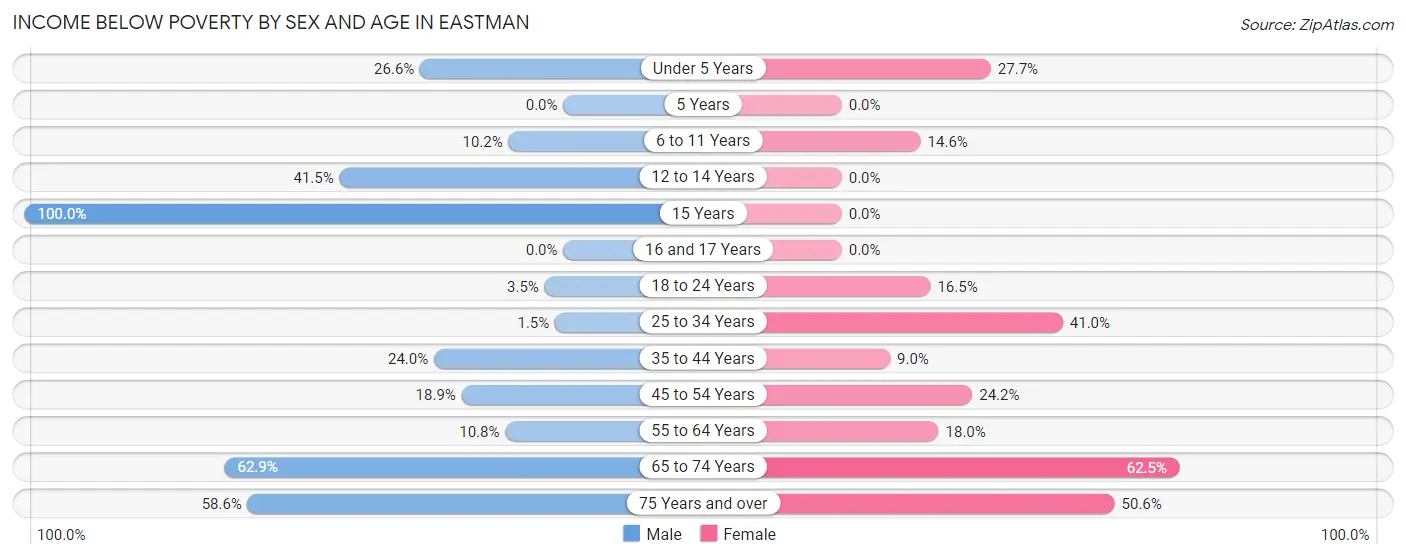
| Age Bracket | Male | Female |
| Under 5 Years | 59 (26.6%) | 31 (27.7%) |
| 5 Years | 0 (0.0%) | 0 (0.0%) |
| 6 to 11 Years | 30 (10.2%) | 35 (14.6%) |
| 12 to 14 Years | 27 (41.5%) | 0 (0.0%) |
| 15 Years | 19 (100.0%) | 0 (0.0%) |
| 16 and 17 Years | 0 (0.0%) | 0 (0.0%) |
| 18 to 24 Years | 11 (3.5%) | 26 (16.5%) |
| 25 to 34 Years | 3 (1.5%) | 80 (41.0%) |
| 35 to 44 Years | 138 (24.0%) | 47 (9.0%) |
| 45 to 54 Years | 64 (18.9%) | 86 (24.2%) |
| 55 to 64 Years | 18 (10.8%) | 46 (18.0%) |
| 65 to 74 Years | 144 (62.9%) | 207 (62.5%) |
| 75 Years and over | 75 (58.6%) | 119 (50.6%) |
| Total | 588 (22.0%) | 677 (25.7%) |
Income Above Poverty by Sex and Age in Eastman
According to the poverty statistics in Eastman, males aged 5 years and females aged 12 to 14 years are the age groups that are most secure financially, with 100.0% of males and 100.0% of females in these age groups living above the poverty line.
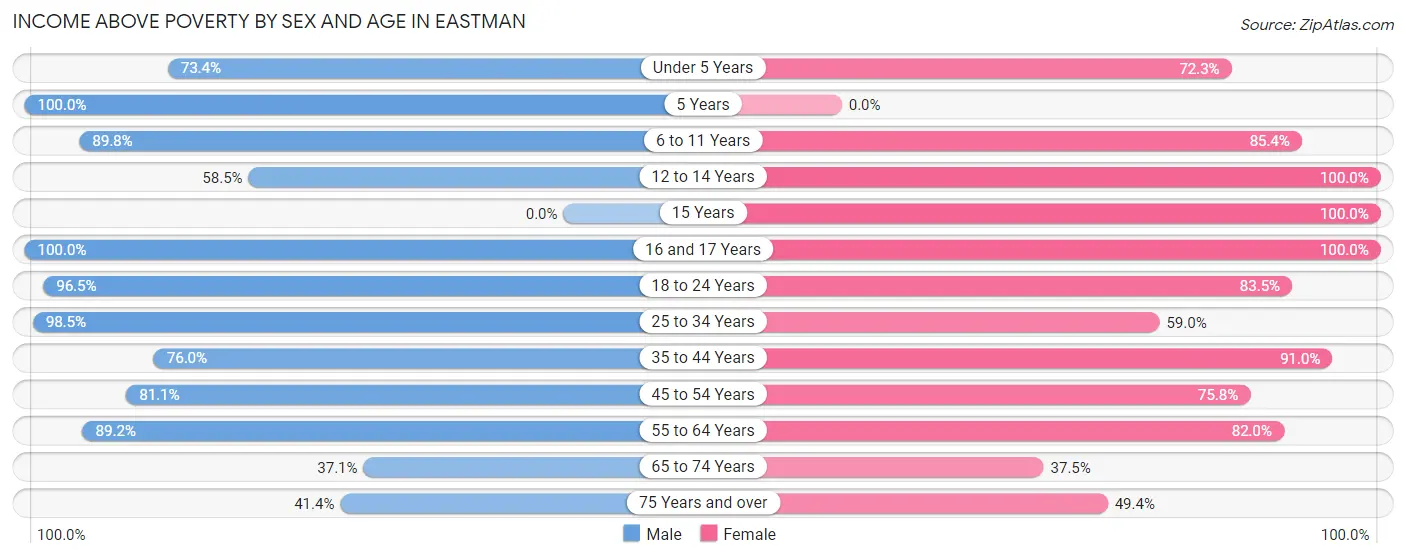
| Age Bracket | Male | Female |
| Under 5 Years | 163 (73.4%) | 81 (72.3%) |
| 5 Years | 19 (100.0%) | 0 (0.0%) |
| 6 to 11 Years | 265 (89.8%) | 204 (85.4%) |
| 12 to 14 Years | 38 (58.5%) | 125 (100.0%) |
| 15 Years | 0 (0.0%) | 59 (100.0%) |
| 16 and 17 Years | 105 (100.0%) | 43 (100.0%) |
| 18 to 24 Years | 306 (96.5%) | 132 (83.5%) |
| 25 to 34 Years | 193 (98.5%) | 115 (59.0%) |
| 35 to 44 Years | 437 (76.0%) | 477 (91.0%) |
| 45 to 54 Years | 275 (81.1%) | 269 (75.8%) |
| 55 to 64 Years | 149 (89.2%) | 210 (82.0%) |
| 65 to 74 Years | 85 (37.1%) | 124 (37.5%) |
| 75 Years and over | 53 (41.4%) | 116 (49.4%) |
| Total | 2,088 (78.0%) | 1,955 (74.3%) |
Income Below Poverty Among Married-Couple Families in Eastman
The poverty statistics for married-couple families in Eastman show that 15.4% or 136 of the total 883 families live below the poverty line. Families with no children have the highest poverty rate of 25.4%, comprising of 120 families. On the other hand, families with 3 or 4 children have the lowest poverty rate of 0.0%, which includes 0 families.
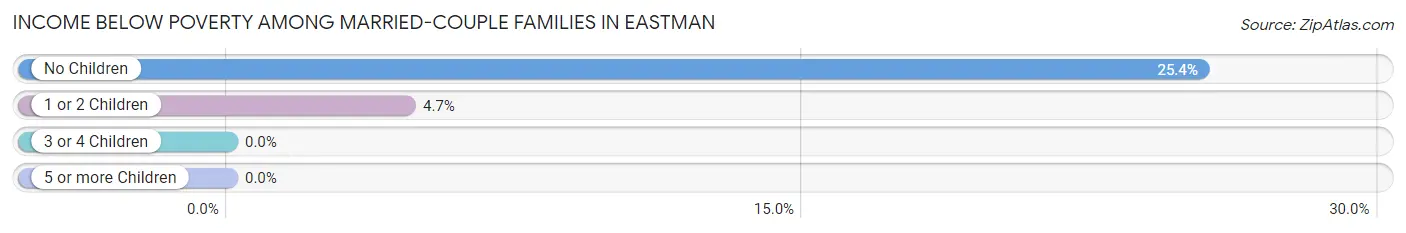
| Children | Above Poverty | Below Poverty |
| No Children | 353 (74.6%) | 120 (25.4%) |
| 1 or 2 Children | 328 (95.4%) | 16 (4.6%) |
| 3 or 4 Children | 66 (100.0%) | 0 (0.0%) |
| 5 or more Children | 0 (0.0%) | 0 (0.0%) |
| Total | 747 (84.6%) | 136 (15.4%) |
Income Below Poverty Among Single-Parent Households in Eastman
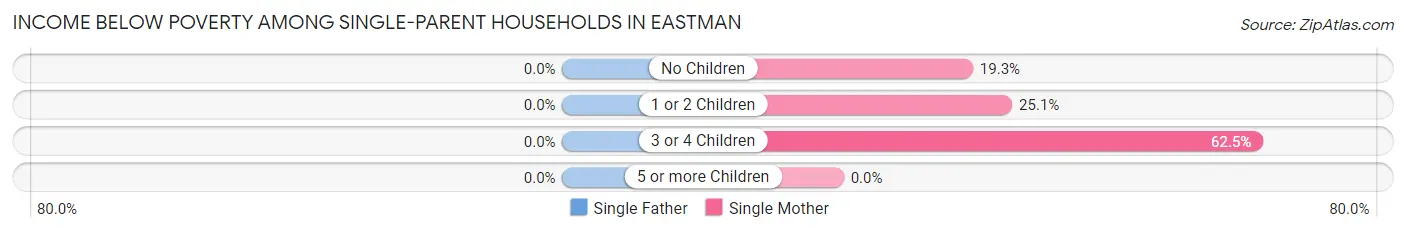
| Children | Single Father | Single Mother |
| No Children | 0 (0.0%) | 26 (19.3%) |
| 1 or 2 Children | 0 (0.0%) | 55 (25.1%) |
| 3 or 4 Children | 0 (0.0%) | 20 (62.5%) |
| 5 or more Children | 0 (0.0%) | 0 (0.0%) |
| Total | 0 (0.0%) | 101 (26.2%) |
Income Below Poverty Among Married-Couple vs Single-Parent Households in Eastman
The poverty data for Eastman shows that 136 of the married-couple family households (15.4%) and 101 of the single-parent households (22.9%) are living below the poverty level. Within the married-couple family households, those with no children have the highest poverty rate, with 120 households (25.4%) falling below the poverty line. Among the single-parent households, those with 3 or 4 children have the highest poverty rate, with 20 household (32.3%) living below poverty.
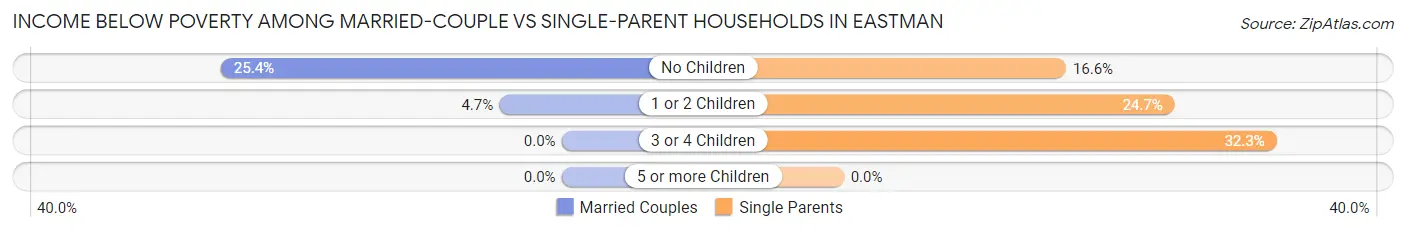
| Children | Married-Couple Families | Single-Parent Households |
| No Children | 120 (25.4%) | 26 (16.6%) |
| 1 or 2 Children | 16 (4.6%) | 55 (24.7%) |
| 3 or 4 Children | 0 (0.0%) | 20 (32.3%) |
| 5 or more Children | 0 (0.0%) | 0 (0.0%) |
| Total | 136 (15.4%) | 101 (22.9%) |
Race in Eastman
The most populous races in Eastman are White / Caucasian (4,291 | 76.1%), Black / African American (1,220 | 21.6%), and Hispanic or Latino (440 | 7.8%).
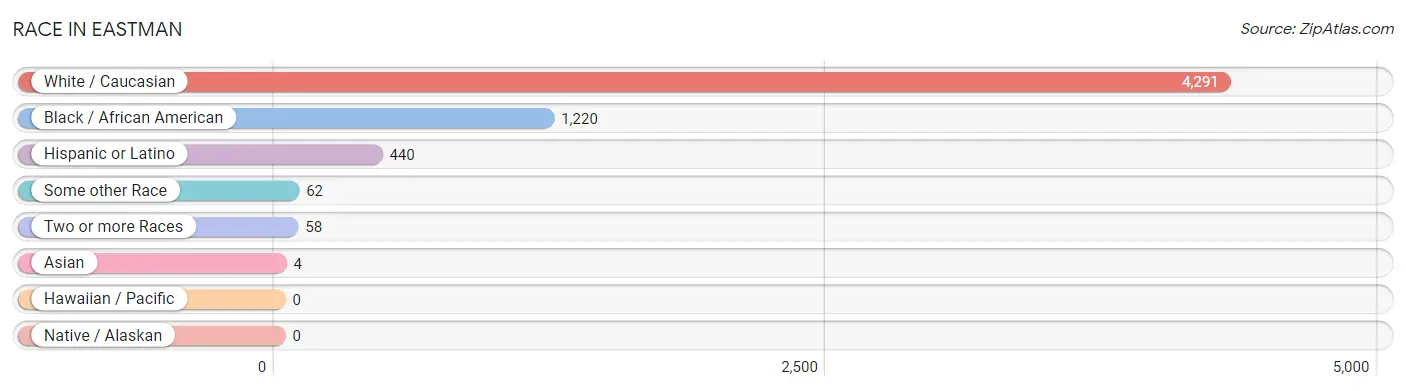
| Race | # Population | % Population |
| Asian | 4 | 0.1% |
| Black / African American | 1,220 | 21.6% |
| Hawaiian / Pacific | 0 | 0.0% |
| Hispanic or Latino | 440 | 7.8% |
| Native / Alaskan | 0 | 0.0% |
| White / Caucasian | 4,291 | 76.1% |
| Two or more Races | 58 | 1.0% |
| Some other Race | 62 | 1.1% |
| Total | 5,635 | 100.0% |
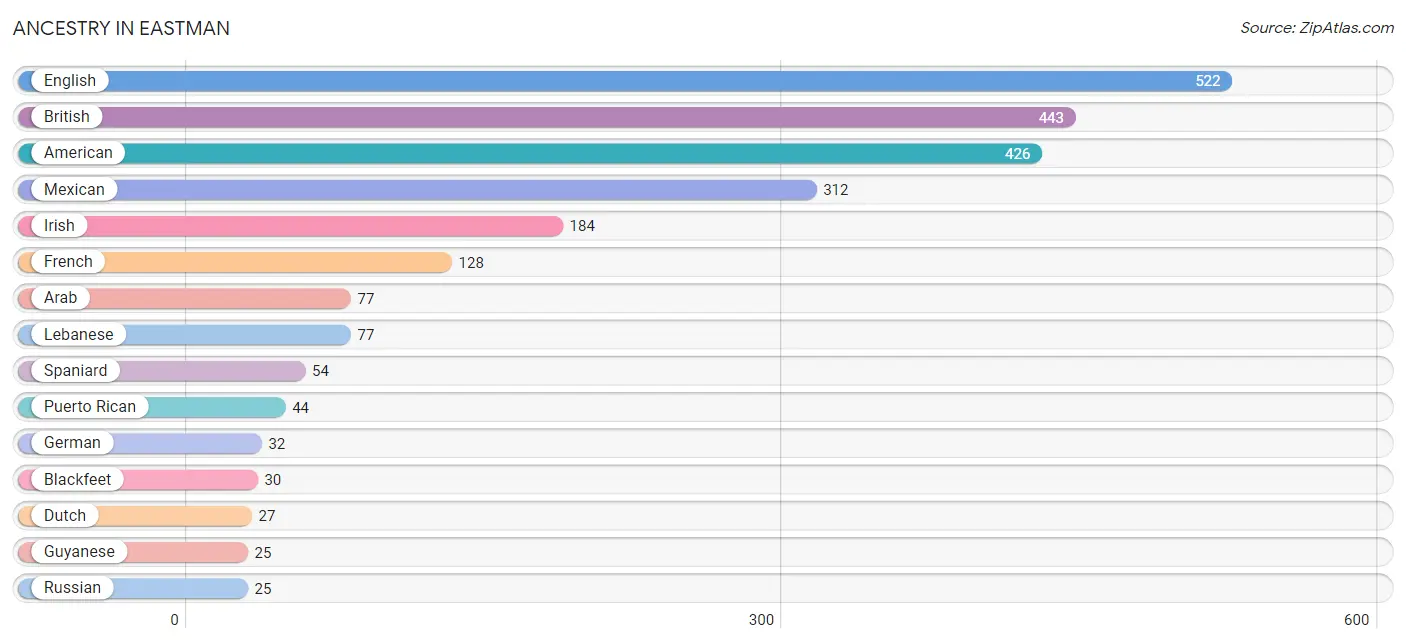
Ancestry in Eastman
The most populous ancestries reported in Eastman are English (522 | 9.3%), British (443 | 7.9%), American (426 | 7.6%), Mexican (312 | 5.5%), and Irish (184 | 3.3%), together accounting for 33.5% of all Eastman residents.
| Ancestry | # Population | % Population |
| African | 20 | 0.4% |
| American | 426 | 7.6% |
| Arab | 77 | 1.4% |
| Blackfeet | 30 | 0.5% |
| Brazilian | 5 | 0.1% |
| British | 443 | 7.9% |
| Cuban | 7 | 0.1% |
| Dominican | 23 | 0.4% |
| Dutch | 27 | 0.5% |
| English | 522 | 9.3% |
| European | 14 | 0.3% |
| French | 128 | 2.3% |
| French Canadian | 6 | 0.1% |
| German | 32 | 0.6% |
| Guyanese | 25 | 0.4% |
| Indian (Asian) | 4 | 0.1% |
| Irish | 184 | 3.3% |
| Italian | 10 | 0.2% |
| Korean | 3 | 0.1% |
| Lebanese | 77 | 1.4% |
| Lithuanian | 6 | 0.1% |
| Mexican | 312 | 5.5% |
| Native Hawaiian | 3 | 0.1% |
| Portuguese | 5 | 0.1% |
| Puerto Rican | 44 | 0.8% |
| Russian | 25 | 0.4% |
| Scotch-Irish | 23 | 0.4% |
| Scottish | 24 | 0.4% |
| Spaniard | 54 | 1.0% |
| Subsaharan African | 20 | 0.4% |
| Swedish | 13 | 0.2% |
| Swiss | 14 | 0.3% | View All 32 Rows |
Immigrants in Eastman
The most numerous immigrant groups reported in Eastman came from Latin America (114 | 2.0%), Caribbean (84 | 1.5%), Dominican Republic (77 | 1.4%), South America (30 | 0.5%), and Guyana (25 | 0.4%), together accounting for 5.8% of all Eastman residents.
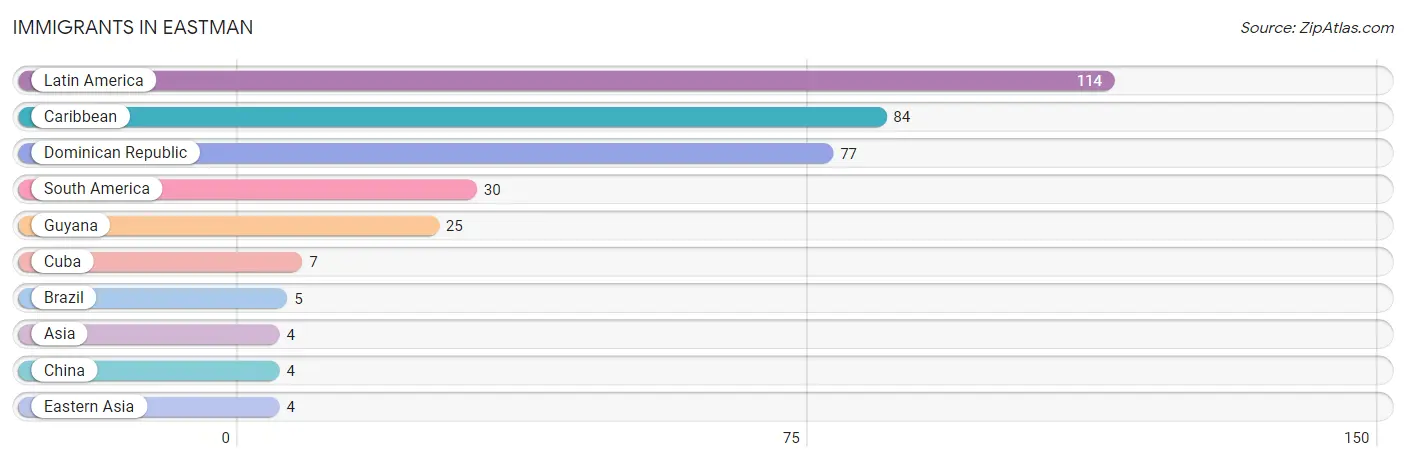
| Immigration Origin | # Population | % Population |
| Asia | 4 | 0.1% |
| Brazil | 5 | 0.1% |
| Caribbean | 84 | 1.5% |
| China | 4 | 0.1% |
| Cuba | 7 | 0.1% |
| Dominican Republic | 77 | 1.4% |
| Eastern Asia | 4 | 0.1% |
| Guyana | 25 | 0.4% |
| Latin America | 114 | 2.0% |
| South America | 30 | 0.5% | View All 10 Rows |
Sex and Age in Eastman
Sex and Age in Eastman
The most populous age groups in Eastman are 15 to 19 Years (409 | 14.2%) for men and 35 to 39 Years (432 | 15.7%) for women.
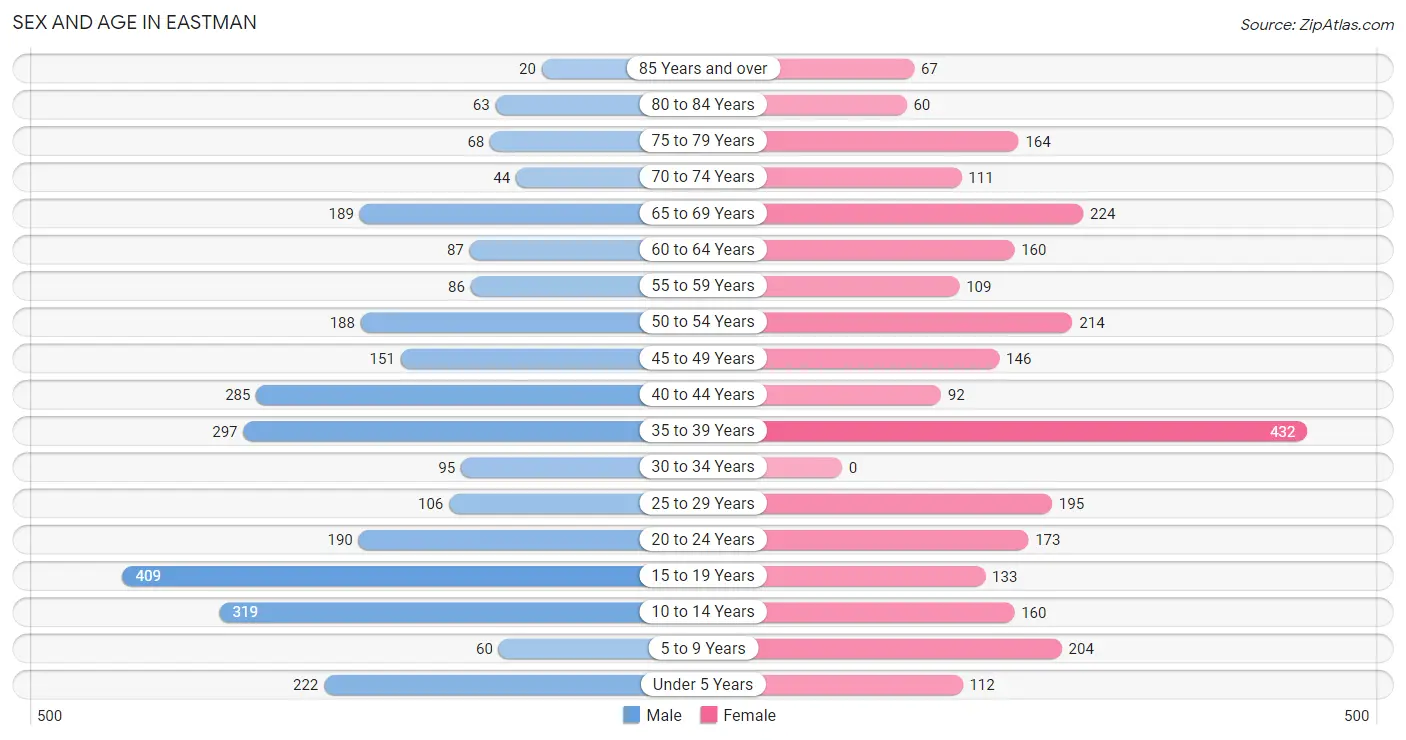
| Age Bracket | Male | Female |
| Under 5 Years | 222 (7.7%) | 112 (4.1%) |
| 5 to 9 Years | 60 (2.1%) | 204 (7.4%) |
| 10 to 14 Years | 319 (11.1%) | 160 (5.8%) |
| 15 to 19 Years | 409 (14.2%) | 133 (4.8%) |
| 20 to 24 Years | 190 (6.6%) | 173 (6.3%) |
| 25 to 29 Years | 106 (3.7%) | 195 (7.1%) |
| 30 to 34 Years | 95 (3.3%) | 0 (0.0%) |
| 35 to 39 Years | 297 (10.3%) | 432 (15.7%) |
| 40 to 44 Years | 285 (9.9%) | 92 (3.3%) |
| 45 to 49 Years | 151 (5.2%) | 146 (5.3%) |
| 50 to 54 Years | 188 (6.5%) | 214 (7.8%) |
| 55 to 59 Years | 86 (3.0%) | 109 (4.0%) |
| 60 to 64 Years | 87 (3.0%) | 160 (5.8%) |
| 65 to 69 Years | 189 (6.6%) | 224 (8.1%) |
| 70 to 74 Years | 44 (1.5%) | 111 (4.0%) |
| 75 to 79 Years | 68 (2.4%) | 164 (5.9%) |
| 80 to 84 Years | 63 (2.2%) | 60 (2.2%) |
| 85 Years and over | 20 (0.7%) | 67 (2.4%) |
| Total | 2,879 (100.0%) | 2,756 (100.0%) |
Families and Households in Eastman
Median Family Size in Eastman
The median family size in Eastman is 3.16 persons per family, with single male/father families (56 | 4.2%) accounting for the largest median family size of 5.36 persons per family. On the other hand, married-couple families (883 | 66.6%) represent the smallest median family size with 2.99 persons per family.
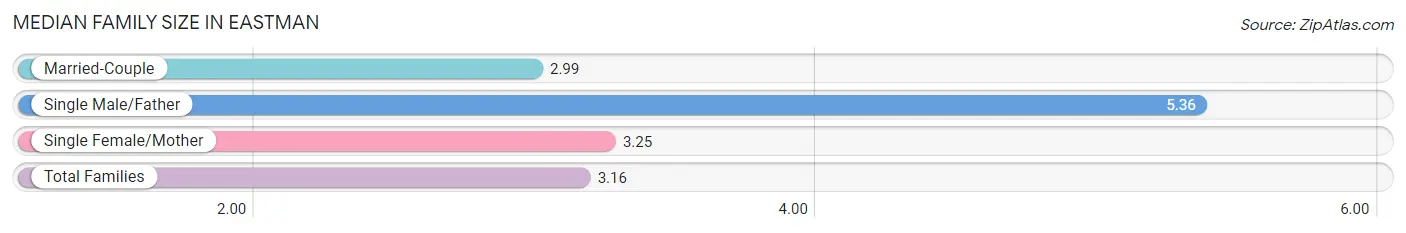
| Family Type | # Families | Family Size |
| Married-Couple | 883 (66.6%) | 2.99 |
| Single Male/Father | 56 (4.2%) | 5.36 |
| Single Female/Mother | 386 (29.1%) | 3.25 |
| Total Families | 1,325 (100.0%) | 3.16 |
Median Household Size in Eastman
The median household size in Eastman is 2.67 persons per household, with single male/father households (56 | 2.8%) accounting for the largest median household size of 6.39 persons per household. non-family households (656 | 33.1%) represent the smallest median household size with 1.44 persons per household.
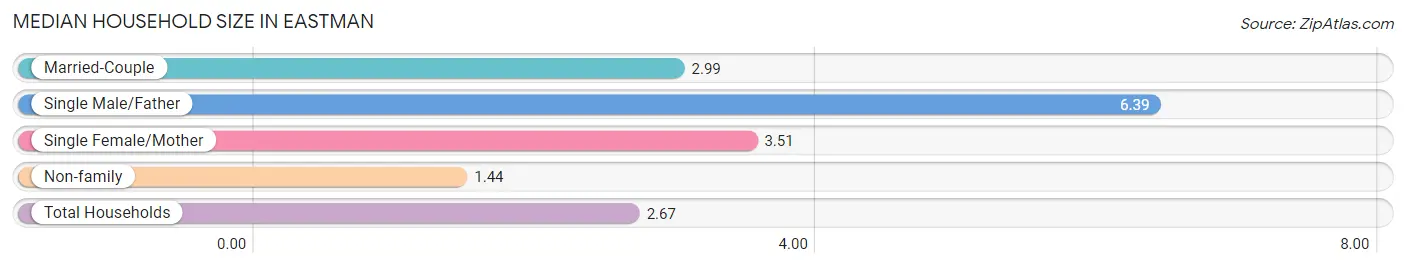
| Household Type | # Households | Household Size |
| Married-Couple | 883 (44.6%) | 2.99 |
| Single Male/Father | 56 (2.8%) | 6.39 |
| Single Female/Mother | 386 (19.5%) | 3.51 |
| Non-family | 656 (33.1%) | 1.44 |
| Total Households | 1,981 (100.0%) | 2.67 |
Household Size by Marriage Status in Eastman
Out of a total of 1,981 households in Eastman, 1,325 (66.9%) are family households, while 656 (33.1%) are nonfamily households. The most numerous type of family households are 2-person households, comprising 541, and the most common type of nonfamily households are 1-person households, comprising 519.
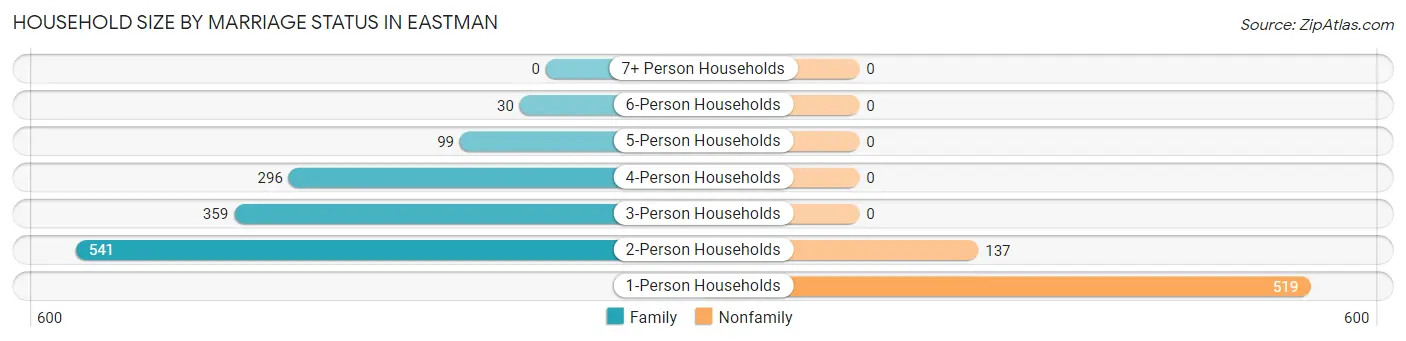
| Household Size | Family Households | Nonfamily Households |
| 1-Person Households | - | 519 (26.2%) |
| 2-Person Households | 541 (27.3%) | 137 (6.9%) |
| 3-Person Households | 359 (18.1%) | 0 (0.0%) |
| 4-Person Households | 296 (14.9%) | 0 (0.0%) |
| 5-Person Households | 99 (5.0%) | 0 (0.0%) |
| 6-Person Households | 30 (1.5%) | 0 (0.0%) |
| 7+ Person Households | 0 (0.0%) | 0 (0.0%) |
| Total | 1,325 (66.9%) | 656 (33.1%) |
Female Fertility in Eastman
Fertility by Age in Eastman
Average fertility rate in Eastman is 57.0 births per 1,000 women. Women in the age bracket of 20 to 34 years have the highest fertility rate with 182.0 births per 1,000 women. Women in the age bracket of 20 to 34 years acount for 100.0% of all women with births.
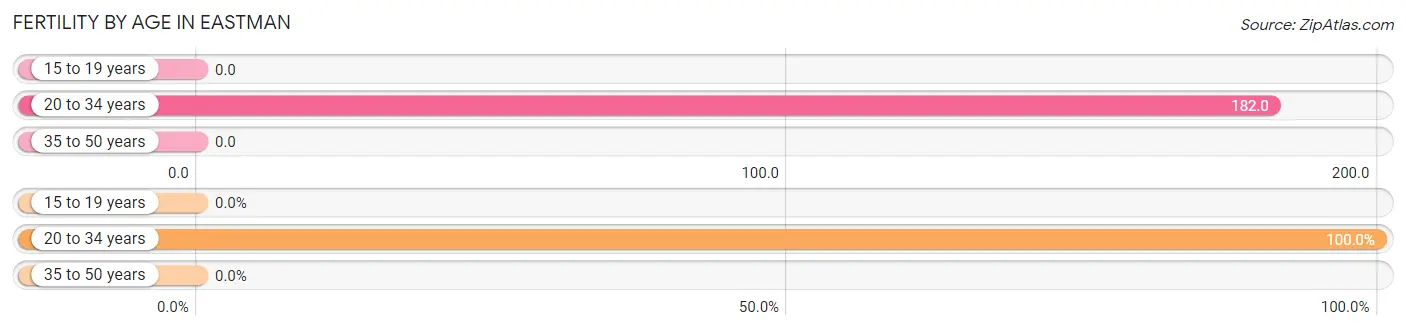
| Age Bracket | Women with Births | Births / 1,000 Women |
| 15 to 19 years | 0 (0.0%) | 0.0 |
| 20 to 34 years | 67 (100.0%) | 182.0 |
| 35 to 50 years | 0 (0.0%) | 0.0 |
| Total | 67 (100.0%) | 57.0 |
Fertility by Age by Marriage Status in Eastman
29.9% of women with births (67) in Eastman are married. The highest percentage of unmarried women with births falls into 20 to 34 years age bracket with 70.2% of them unmarried at the time of birth, while the lowest percentage of unmarried women with births belong to 20 to 34 years age bracket with 70.2% of them unmarried.
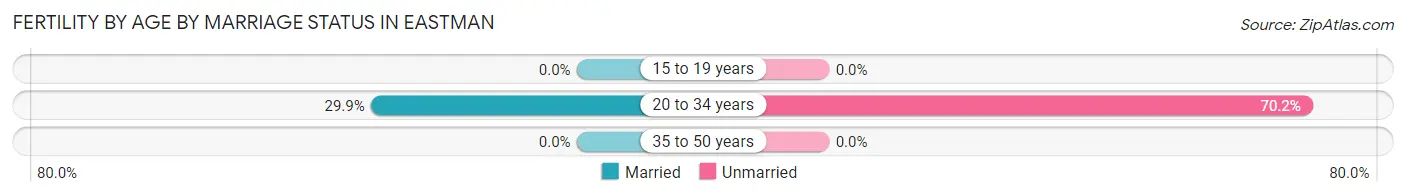
| Age Bracket | Married | Unmarried |
| 15 to 19 years | 0 (0.0%) | 0 (0.0%) |
| 20 to 34 years | 20 (29.8%) | 47 (70.2%) |
| 35 to 50 years | 0 (0.0%) | 0 (0.0%) |
| Total | 20 (29.8%) | 47 (70.2%) |
Fertility by Education in Eastman
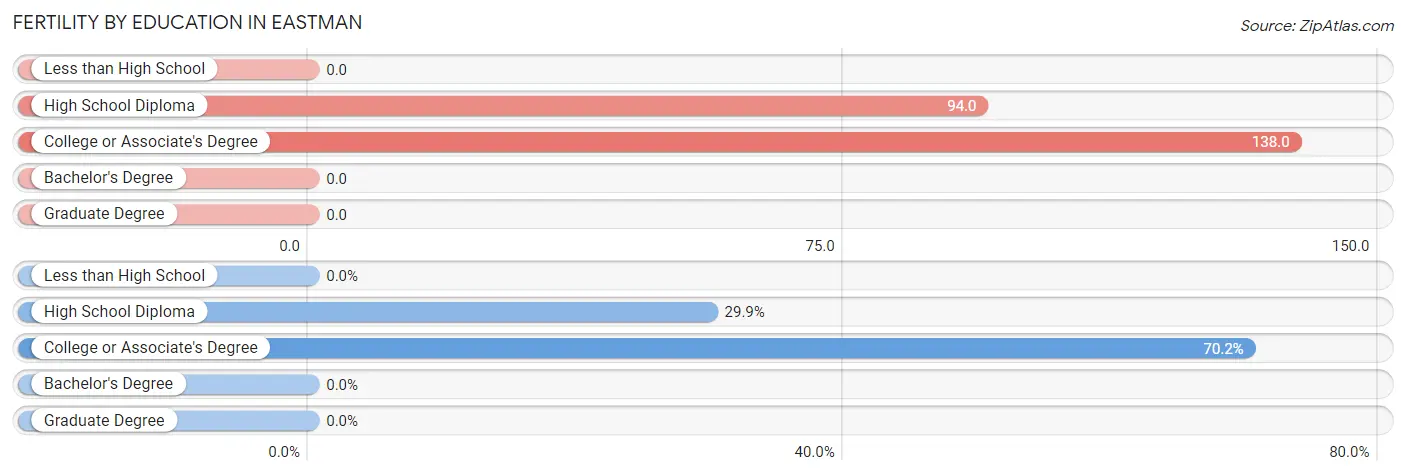
| Educational Attainment | Women with Births | Births / 1,000 Women |
| Less than High School | 0 (0.0%) | 0.0 |
| High School Diploma | 20 (29.8%) | 94.0 |
| College or Associate's Degree | 47 (70.2%) | 138.0 |
| Bachelor's Degree | 0 (0.0%) | 0.0 |
| Graduate Degree | 0 (0.0%) | 0.0 |
| Total | 67 (100.0%) | 57.0 |
Fertility by Education by Marriage Status in Eastman
70.2% of women with births in Eastman are unmarried. Women with the educational attainment of high school diploma are most likely to be married with 100.0% of them married at childbirth, while women with the educational attainment of college or associate's degree are least likely to be married with 100.0% of them unmarried at childbirth.
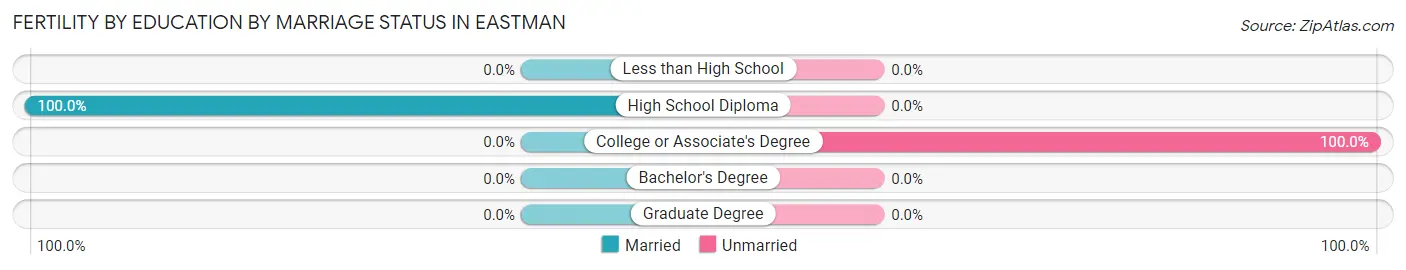
| Educational Attainment | Married | Unmarried |
| Less than High School | 0 (0.0%) | 0 (0.0%) |
| High School Diploma | 20 (100.0%) | 0 (0.0%) |
| College or Associate's Degree | 0 (0.0%) | 47 (100.0%) |
| Bachelor's Degree | 0 (0.0%) | 0 (0.0%) |
| Graduate Degree | 0 (0.0%) | 0 (0.0%) |
| Total | 20 (29.8%) | 47 (70.2%) |
Employment Characteristics in Eastman
Employment by Class of Employer in Eastman
Among the 2,027 employed individuals in Eastman, private company employees (1,282 | 63.2%), state government employees (276 | 13.6%), and not-for-profit organizations (175 | 8.6%) make up the most common classes of employment.
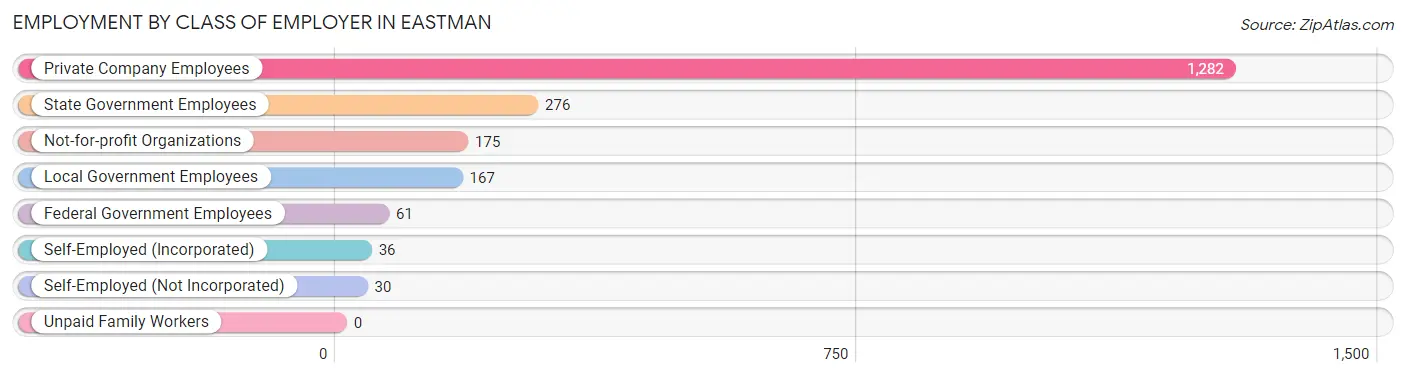
| Employer Class | # Employees | % Employees |
| Private Company Employees | 1,282 | 63.2% |
| Self-Employed (Incorporated) | 36 | 1.8% |
| Self-Employed (Not Incorporated) | 30 | 1.5% |
| Not-for-profit Organizations | 175 | 8.6% |
| Local Government Employees | 167 | 8.2% |
| State Government Employees | 276 | 13.6% |
| Federal Government Employees | 61 | 3.0% |
| Unpaid Family Workers | 0 | 0.0% |
| Total | 2,027 | 100.0% |
Employment Status by Age in Eastman
According to the labor force statistics for Eastman, out of the total population over 16 years of age (4,470), 48.0% or 2,146 individuals are in the labor force, with 2.1% or 45 of them unemployed. The age group with the highest labor force participation rate is 35 to 44 years, with 78.5% or 868 individuals in the labor force. Within the labor force, the 65 to 74 years age range has the highest percentage of unemployed individuals, with 20.0% or 14 of them being unemployed.
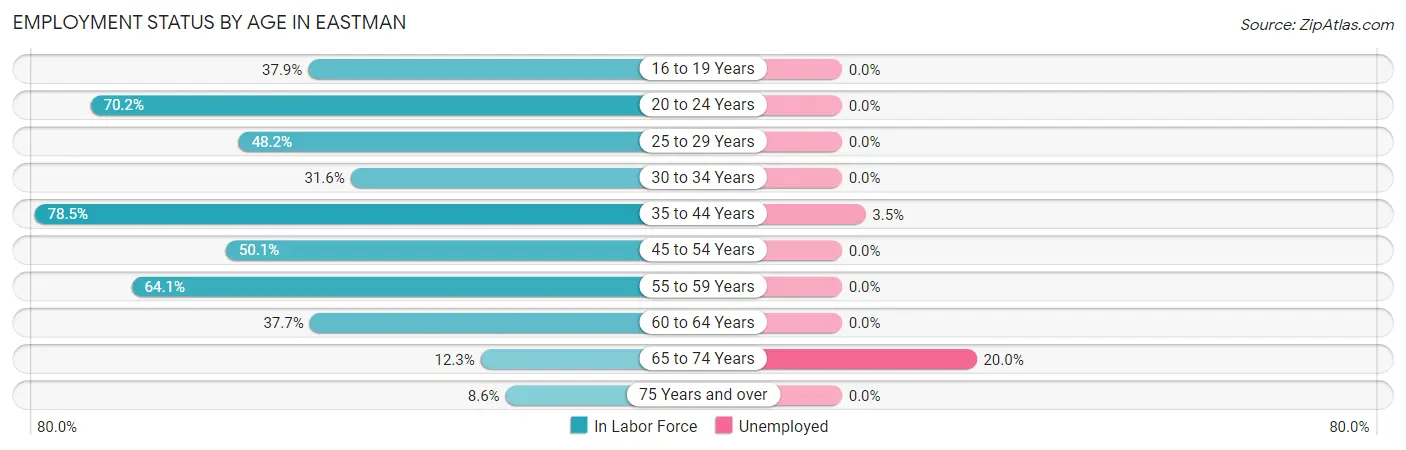
| Age Bracket | In Labor Force | Unemployed |
| 16 to 19 Years | 172 (37.9%) | 0 (0.0%) |
| 20 to 24 Years | 255 (70.2%) | 0 (0.0%) |
| 25 to 29 Years | 145 (48.2%) | 0 (0.0%) |
| 30 to 34 Years | 30 (31.6%) | 0 (0.0%) |
| 35 to 44 Years | 868 (78.5%) | 30 (3.5%) |
| 45 to 54 Years | 350 (50.1%) | 0 (0.0%) |
| 55 to 59 Years | 125 (64.1%) | 0 (0.0%) |
| 60 to 64 Years | 93 (37.7%) | 0 (0.0%) |
| 65 to 74 Years | 70 (12.3%) | 14 (20.0%) |
| 75 Years and over | 38 (8.6%) | 0 (0.0%) |
| Total | 2,146 (48.0%) | 45 (2.1%) |
Employment Status by Educational Attainment in Eastman
According to labor force statistics for Eastman, 61.0% of individuals (1,612) out of the total population between 25 and 64 years of age (2,643) are in the labor force, with 1.9% or 31 of them being unemployed. The group with the highest labor force participation rate are those with the educational attainment of bachelor's degree or higher, with 95.4% or 622 individuals in the labor force. Within the labor force, individuals with bachelor's degree or higher education have the highest percentage of unemployment, with 4.8% or 30 of them being unemployed.
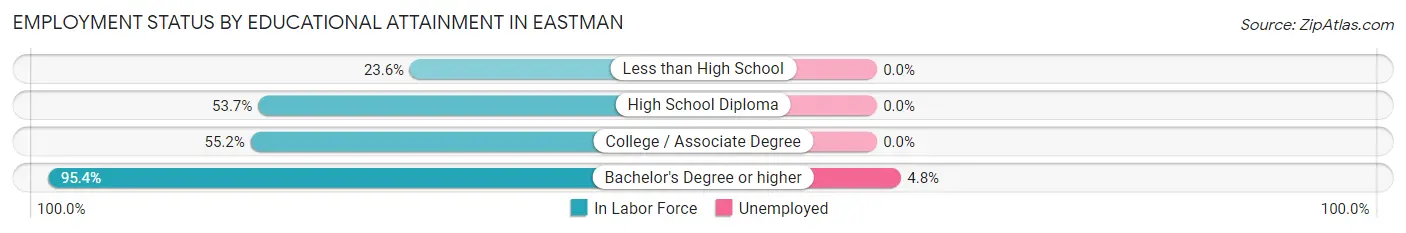
| Educational Attainment | In Labor Force | Unemployed |
| Less than High School | 74 (23.6%) | 0 (0.0%) |
| High School Diploma | 394 (53.7%) | 0 (0.0%) |
| College / Associate Degree | 521 (55.2%) | 0 (0.0%) |
| Bachelor's Degree or higher | 622 (95.4%) | 31 (4.8%) |
| Total | 1,612 (61.0%) | 50 (1.9%) |
Employment Occupations by Sex in Eastman
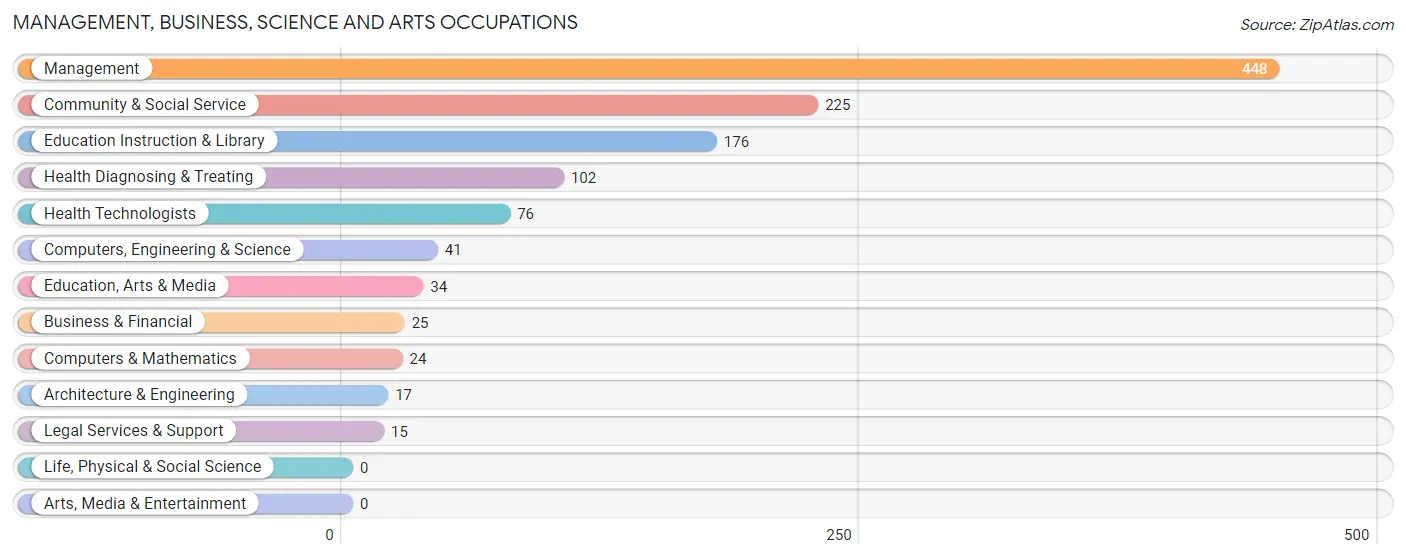
Management, Business, Science and Arts Occupations
The most common Management, Business, Science and Arts occupations in Eastman are Management (448 | 21.3%), Community & Social Service (225 | 10.7%), Education Instruction & Library (176 | 8.4%), Health Diagnosing & Treating (102 | 4.9%), and Health Technologists (76 | 3.6%).
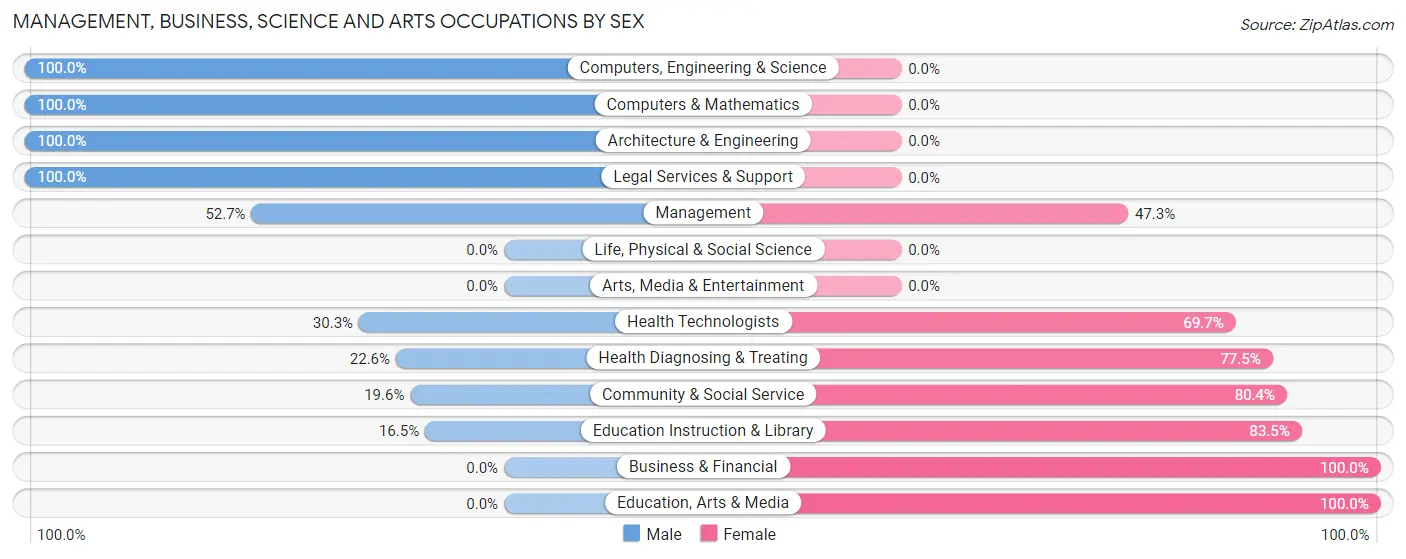
Management, Business, Science and Arts Occupations by Sex
Within the Management, Business, Science and Arts occupations in Eastman, the most male-oriented occupations are Computers, Engineering & Science (100.0%), Computers & Mathematics (100.0%), and Architecture & Engineering (100.0%), while the most female-oriented occupations are Business & Financial (100.0%), Education, Arts & Media (100.0%), and Education Instruction & Library (83.5%).
| Occupation | Male | Female |
| Management | 236 (52.7%) | 212 (47.3%) |
| Business & Financial | 0 (0.0%) | 25 (100.0%) |
| Computers, Engineering & Science | 41 (100.0%) | 0 (0.0%) |
| Computers & Mathematics | 24 (100.0%) | 0 (0.0%) |
| Architecture & Engineering | 17 (100.0%) | 0 (0.0%) |
| Life, Physical & Social Science | 0 (0.0%) | 0 (0.0%) |
| Community & Social Service | 44 (19.6%) | 181 (80.4%) |
| Education, Arts & Media | 0 (0.0%) | 34 (100.0%) |
| Legal Services & Support | 15 (100.0%) | 0 (0.0%) |
| Education Instruction & Library | 29 (16.5%) | 147 (83.5%) |
| Arts, Media & Entertainment | 0 (0.0%) | 0 (0.0%) |
| Health Diagnosing & Treating | 23 (22.6%) | 79 (77.4%) |
| Health Technologists | 23 (30.3%) | 53 (69.7%) |
| Total (Category) | 344 (40.9%) | 497 (59.1%) |
| Total (Overall) | 998 (47.5%) | 1,104 (52.5%) |
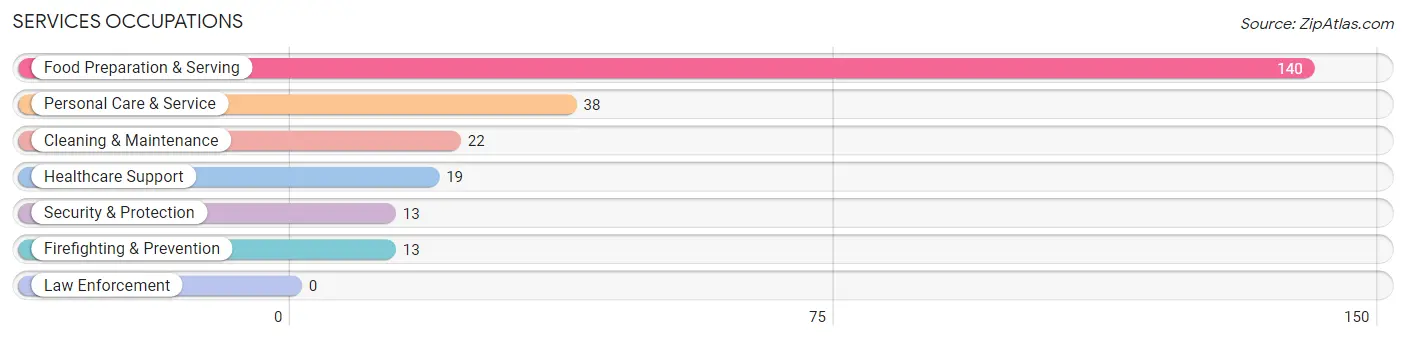
Services Occupations
The most common Services occupations in Eastman are Food Preparation & Serving (140 | 6.7%), Personal Care & Service (38 | 1.8%), Cleaning & Maintenance (22 | 1.1%), Healthcare Support (19 | 0.9%), and Security & Protection (13 | 0.6%).
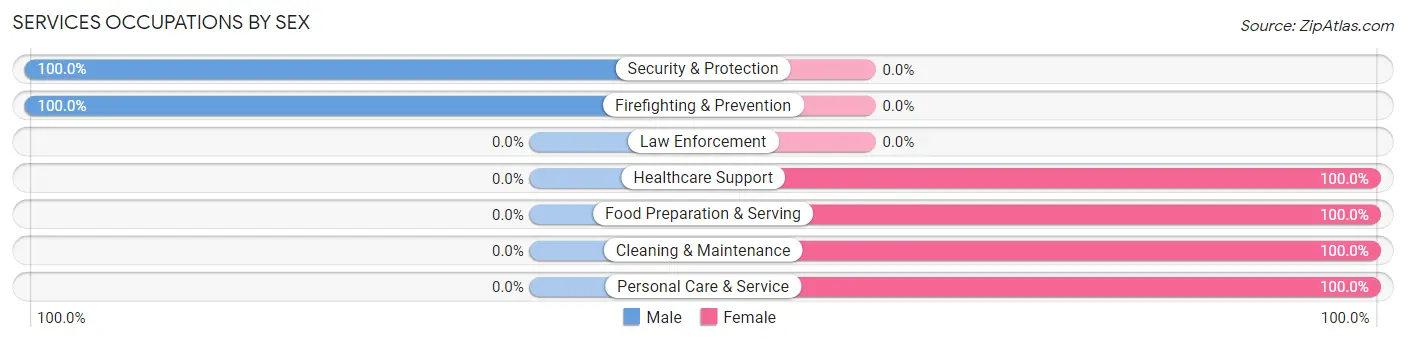
Services Occupations by Sex
Within the Services occupations in Eastman, the most male-oriented occupations are Security & Protection (100.0%), and Firefighting & Prevention (100.0%), while the most female-oriented occupations are Healthcare Support (100.0%), Food Preparation & Serving (100.0%), and Cleaning & Maintenance (100.0%).
| Occupation | Male | Female |
| Healthcare Support | 0 (0.0%) | 19 (100.0%) |
| Security & Protection | 13 (100.0%) | 0 (0.0%) |
| Firefighting & Prevention | 13 (100.0%) | 0 (0.0%) |
| Law Enforcement | 0 (0.0%) | 0 (0.0%) |
| Food Preparation & Serving | 0 (0.0%) | 140 (100.0%) |
| Cleaning & Maintenance | 0 (0.0%) | 22 (100.0%) |
| Personal Care & Service | 0 (0.0%) | 38 (100.0%) |
| Total (Category) | 13 (5.6%) | 219 (94.4%) |
| Total (Overall) | 998 (47.5%) | 1,104 (52.5%) |
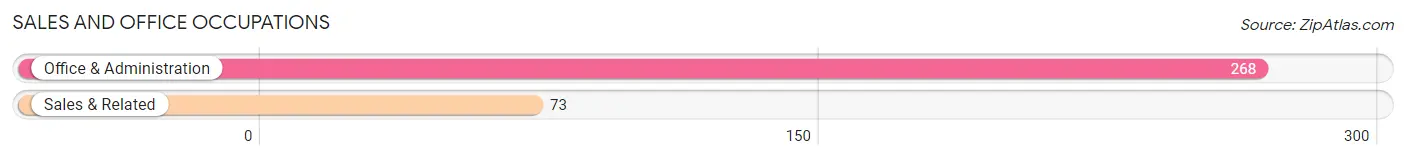
Sales and Office Occupations
The most common Sales and Office occupations in Eastman are Office & Administration (268 | 12.8%), and Sales & Related (73 | 3.5%).
Sales and Office Occupations by Sex
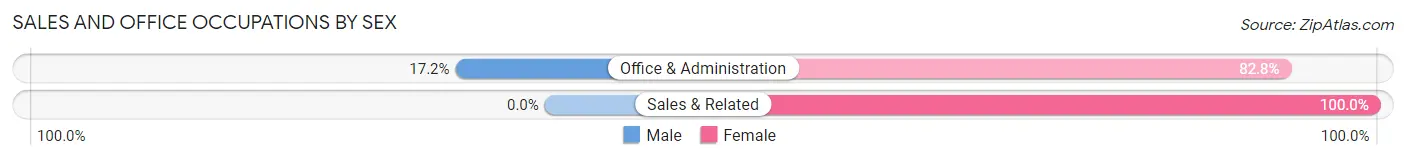
| Occupation | Male | Female |
| Sales & Related | 0 (0.0%) | 73 (100.0%) |
| Office & Administration | 46 (17.2%) | 222 (82.8%) |
| Total (Category) | 46 (13.5%) | 295 (86.5%) |
| Total (Overall) | 998 (47.5%) | 1,104 (52.5%) |
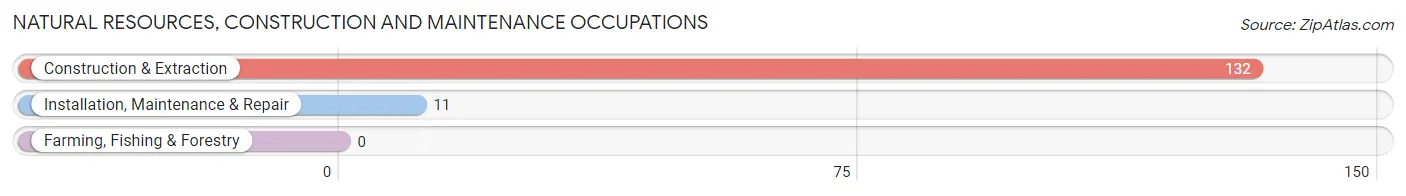
Natural Resources, Construction and Maintenance Occupations
The most common Natural Resources, Construction and Maintenance occupations in Eastman are Construction & Extraction (132 | 6.3%), and Installation, Maintenance & Repair (11 | 0.5%).
Natural Resources, Construction and Maintenance Occupations by Sex
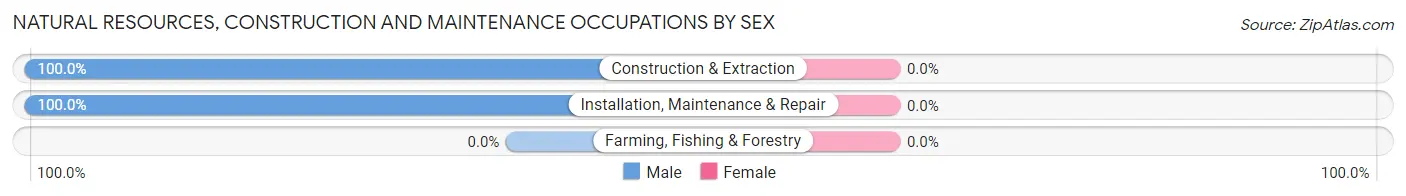
| Occupation | Male | Female |
| Farming, Fishing & Forestry | 0 (0.0%) | 0 (0.0%) |
| Construction & Extraction | 132 (100.0%) | 0 (0.0%) |
| Installation, Maintenance & Repair | 11 (100.0%) | 0 (0.0%) |
| Total (Category) | 143 (100.0%) | 0 (0.0%) |
| Total (Overall) | 998 (47.5%) | 1,104 (52.5%) |
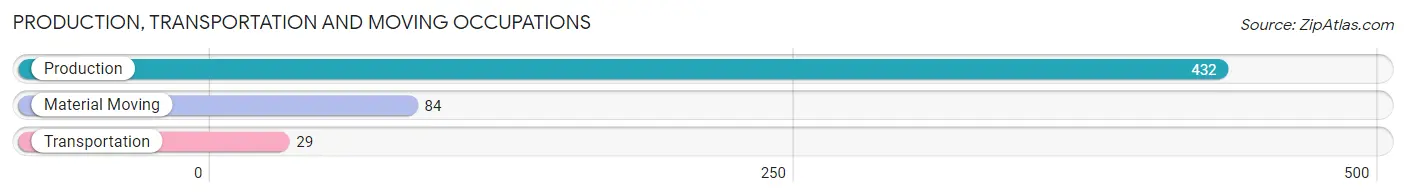
Production, Transportation and Moving Occupations
The most common Production, Transportation and Moving occupations in Eastman are Production (432 | 20.5%), Material Moving (84 | 4.0%), and Transportation (29 | 1.4%).
Production, Transportation and Moving Occupations by Sex
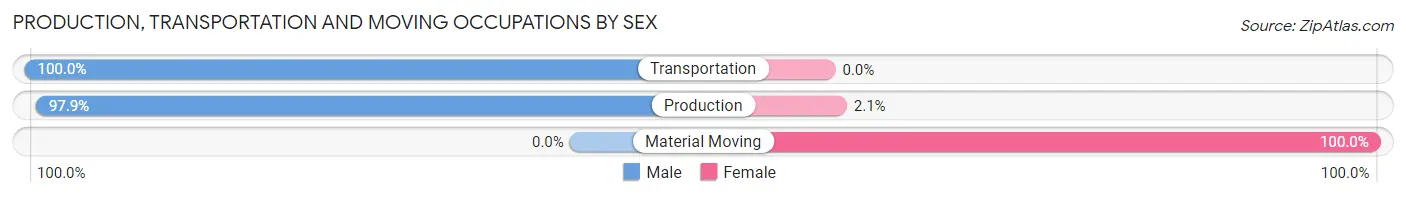
| Occupation | Male | Female |
| Production | 423 (97.9%) | 9 (2.1%) |
| Transportation | 29 (100.0%) | 0 (0.0%) |
| Material Moving | 0 (0.0%) | 84 (100.0%) |
| Total (Category) | 452 (82.9%) | 93 (17.1%) |
| Total (Overall) | 998 (47.5%) | 1,104 (52.5%) |
Employment Industries by Sex in Eastman
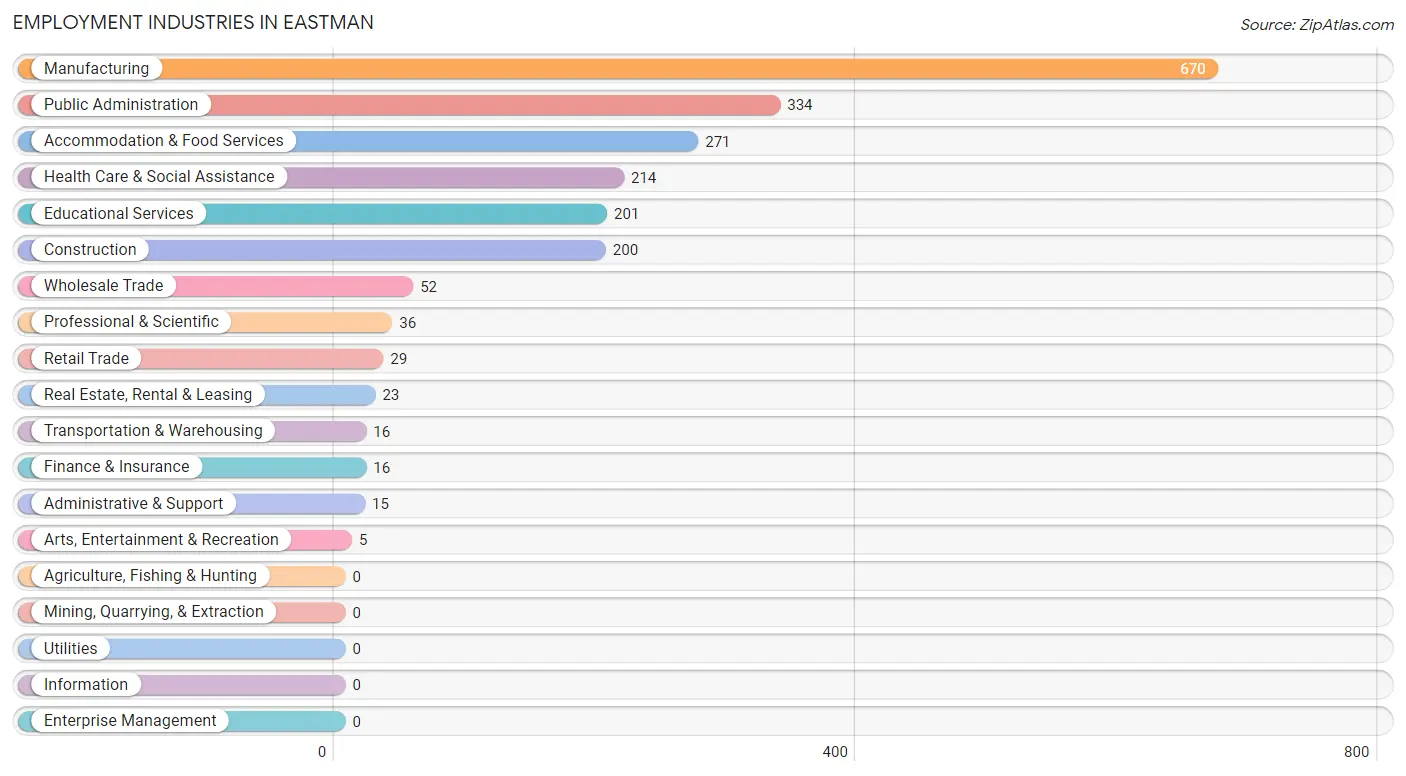
Employment Industries in Eastman
The major employment industries in Eastman include Manufacturing (670 | 31.9%), Public Administration (334 | 15.9%), Accommodation & Food Services (271 | 12.9%), Health Care & Social Assistance (214 | 10.2%), and Educational Services (201 | 9.6%).
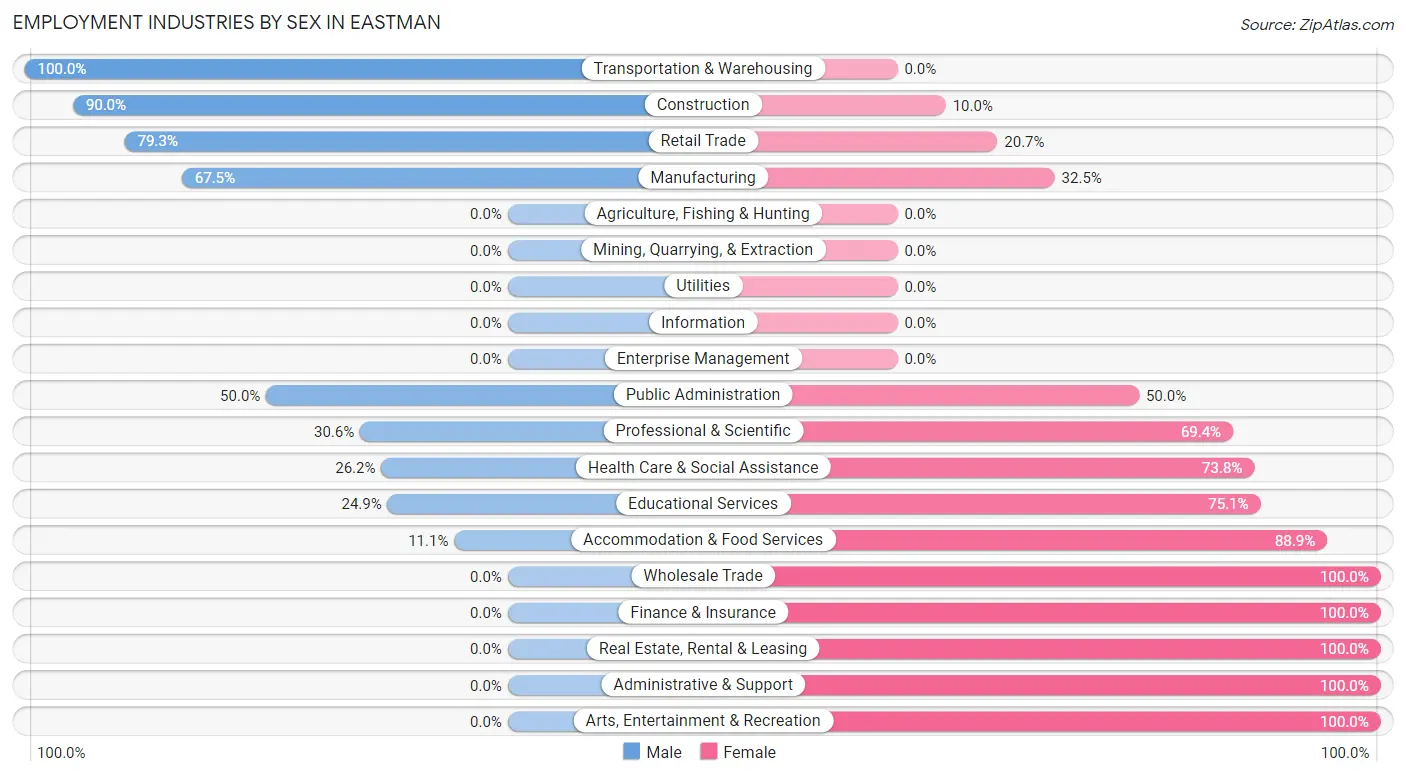
Employment Industries by Sex in Eastman
The Eastman industries that see more men than women are Transportation & Warehousing (100.0%), Construction (90.0%), and Retail Trade (79.3%), whereas the industries that tend to have a higher number of women are Wholesale Trade (100.0%), Finance & Insurance (100.0%), and Real Estate, Rental & Leasing (100.0%).
| Industry | Male | Female |
| Agriculture, Fishing & Hunting | 0 (0.0%) | 0 (0.0%) |
| Mining, Quarrying, & Extraction | 0 (0.0%) | 0 (0.0%) |
| Construction | 180 (90.0%) | 20 (10.0%) |
| Manufacturing | 452 (67.5%) | 218 (32.5%) |
| Wholesale Trade | 0 (0.0%) | 52 (100.0%) |
| Retail Trade | 23 (79.3%) | 6 (20.7%) |
| Transportation & Warehousing | 16 (100.0%) | 0 (0.0%) |
| Utilities | 0 (0.0%) | 0 (0.0%) |
| Information | 0 (0.0%) | 0 (0.0%) |
| Finance & Insurance | 0 (0.0%) | 16 (100.0%) |
| Real Estate, Rental & Leasing | 0 (0.0%) | 23 (100.0%) |
| Professional & Scientific | 11 (30.6%) | 25 (69.4%) |
| Enterprise Management | 0 (0.0%) | 0 (0.0%) |
| Administrative & Support | 0 (0.0%) | 15 (100.0%) |
| Educational Services | 50 (24.9%) | 151 (75.1%) |
| Health Care & Social Assistance | 56 (26.2%) | 158 (73.8%) |
| Arts, Entertainment & Recreation | 0 (0.0%) | 5 (100.0%) |
| Accommodation & Food Services | 30 (11.1%) | 241 (88.9%) |
| Public Administration | 167 (50.0%) | 167 (50.0%) |
| Total | 998 (47.5%) | 1,104 (52.5%) |
Education in Eastman
School Enrollment in Eastman
The most common levels of schooling among the 1,562 students in Eastman are high school (420 | 26.9%), elementary school (409 | 26.2%), and college / undergraduate (300 | 19.2%).
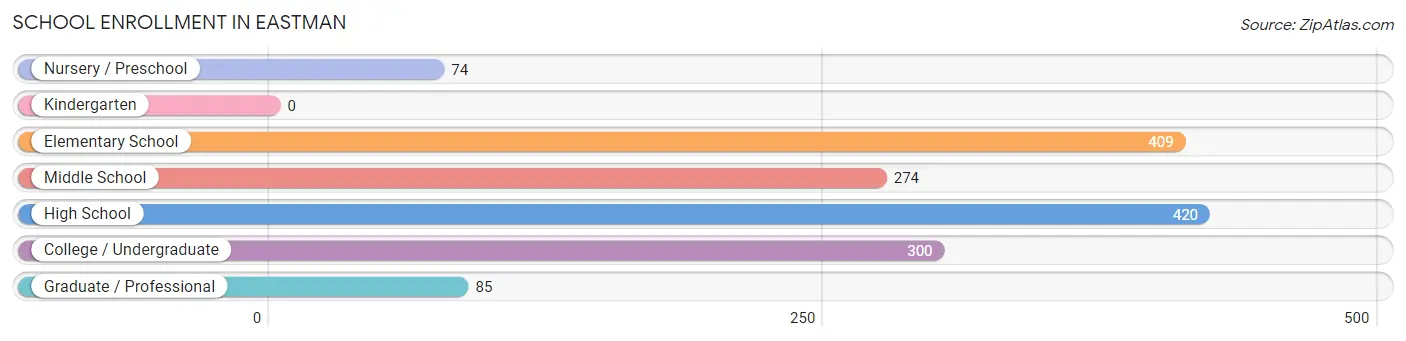
| School Level | # Students | % Students |
| Nursery / Preschool | 74 | 4.7% |
| Kindergarten | 0 | 0.0% |
| Elementary School | 409 | 26.2% |
| Middle School | 274 | 17.5% |
| High School | 420 | 26.9% |
| College / Undergraduate | 300 | 19.2% |
| Graduate / Professional | 85 | 5.4% |
| Total | 1,562 | 100.0% |
School Enrollment by Age by Funding Source in Eastman
Out of a total of 1,562 students who are enrolled in schools in Eastman, 301 (19.3%) attend a private institution, while the remaining 1,261 (80.7%) are enrolled in public schools. The age group of 5 to 9 year old has the highest likelihood of being enrolled in private schools, with 163 (66.5% in the age bracket) enrolled. Conversely, the age group of 3 to 4 year olds has the lowest likelihood of being enrolled in a private school, with 74 (100.0% in the age bracket) attending a public institution.
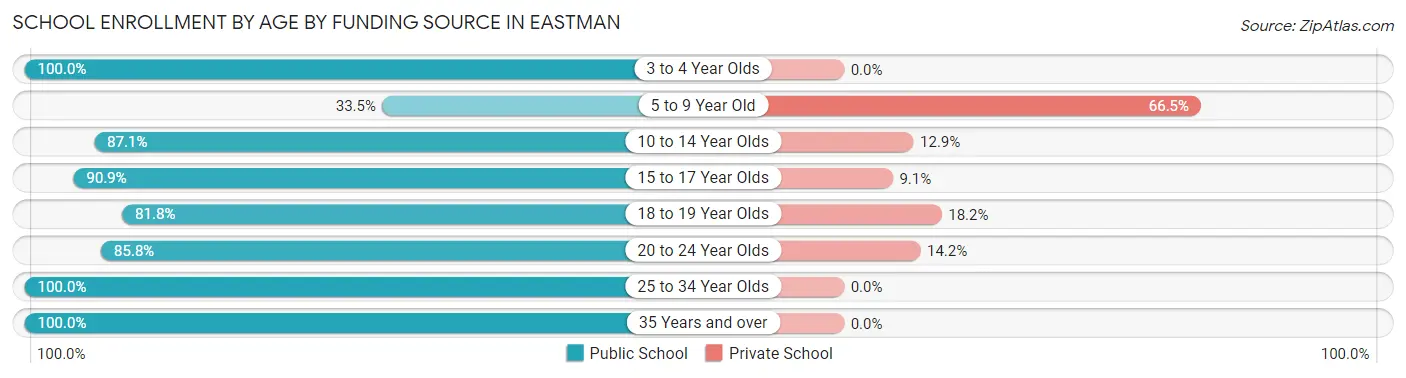
| Age Bracket | Public School | Private School |
| 3 to 4 Year Olds | 74 (100.0%) | 0 (0.0%) |
| 5 to 9 Year Old | 82 (33.5%) | 163 (66.5%) |
| 10 to 14 Year Olds | 417 (87.1%) | 62 (12.9%) |
| 15 to 17 Year Olds | 220 (90.9%) | 22 (9.1%) |
| 18 to 19 Year Olds | 108 (81.8%) | 24 (18.2%) |
| 20 to 24 Year Olds | 181 (85.8%) | 30 (14.2%) |
| 25 to 34 Year Olds | 104 (100.0%) | 0 (0.0%) |
| 35 Years and over | 75 (100.0%) | 0 (0.0%) |
| Total | 1,261 (80.7%) | 301 (19.3%) |
Educational Attainment by Field of Study in Eastman
Education (263 | 29.2%), communications (239 | 26.5%), psychology (90 | 10.0%), business (85 | 9.4%), and bio, nature & agricultural (56 | 6.2%) are the most common fields of study among 901 individuals in Eastman who have obtained a bachelor's degree or higher.
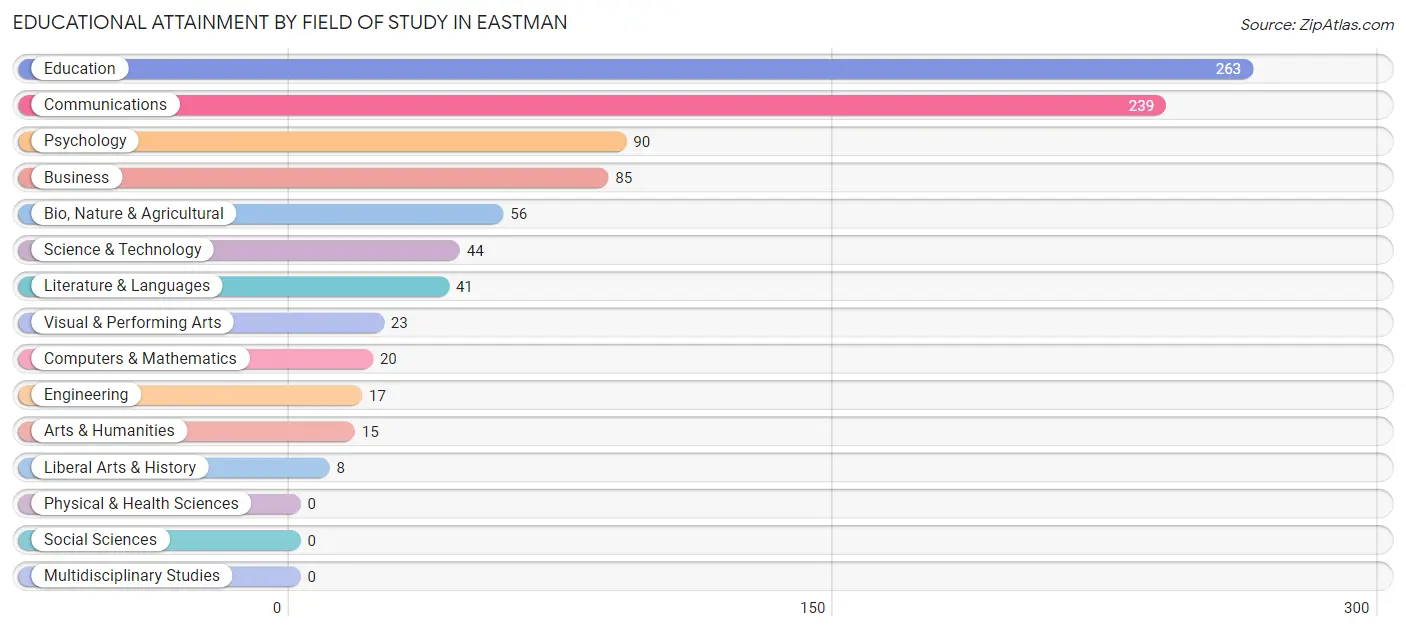
| Field of Study | # Graduates | % Graduates |
| Computers & Mathematics | 20 | 2.2% |
| Bio, Nature & Agricultural | 56 | 6.2% |
| Physical & Health Sciences | 0 | 0.0% |
| Psychology | 90 | 10.0% |
| Social Sciences | 0 | 0.0% |
| Engineering | 17 | 1.9% |
| Multidisciplinary Studies | 0 | 0.0% |
| Science & Technology | 44 | 4.9% |
| Business | 85 | 9.4% |
| Education | 263 | 29.2% |
| Literature & Languages | 41 | 4.5% |
| Liberal Arts & History | 8 | 0.9% |
| Visual & Performing Arts | 23 | 2.5% |
| Communications | 239 | 26.5% |
| Arts & Humanities | 15 | 1.7% |
| Total | 901 | 100.0% |
Transportation & Commute in Eastman
Vehicle Availability by Sex in Eastman
The most prevalent vehicle ownership categories in Eastman are males with 3 vehicles (340, accounting for 38.5%) and females with 3 vehicles (319, making up 32.1%).
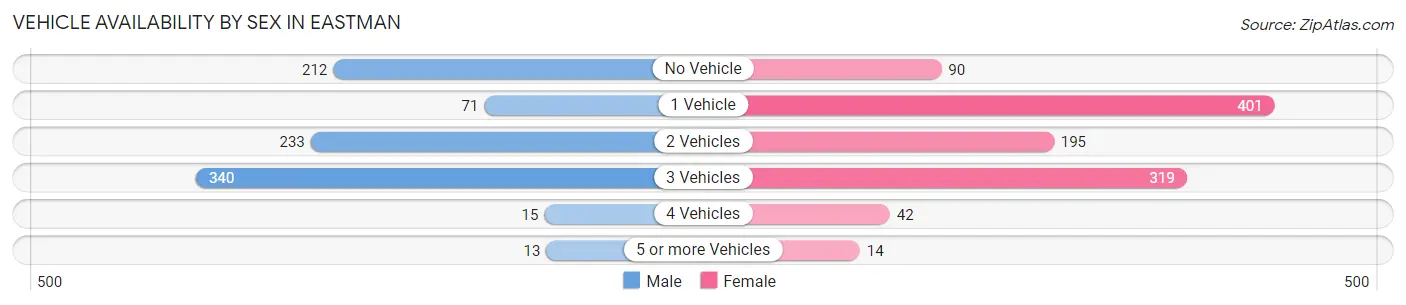
| Vehicles Available | Male | Female |
| No Vehicle | 212 (24.0%) | 90 (8.5%) |
| 1 Vehicle | 71 (8.0%) | 401 (37.8%) |
| 2 Vehicles | 233 (26.4%) | 195 (18.4%) |
| 3 Vehicles | 340 (38.5%) | 319 (30.1%) |
| 4 Vehicles | 15 (1.7%) | 42 (4.0%) |
| 5 or more Vehicles | 13 (1.5%) | 14 (1.3%) |
| Total | 884 (100.0%) | 1,061 (100.0%) |
Commute Time in Eastman
The most frequently occuring commute durations in Eastman are 10 to 14 minutes (536 commuters, 27.2%), 5 to 9 minutes (506 commuters, 25.7%), and 45 to 59 minutes (347 commuters, 17.6%).
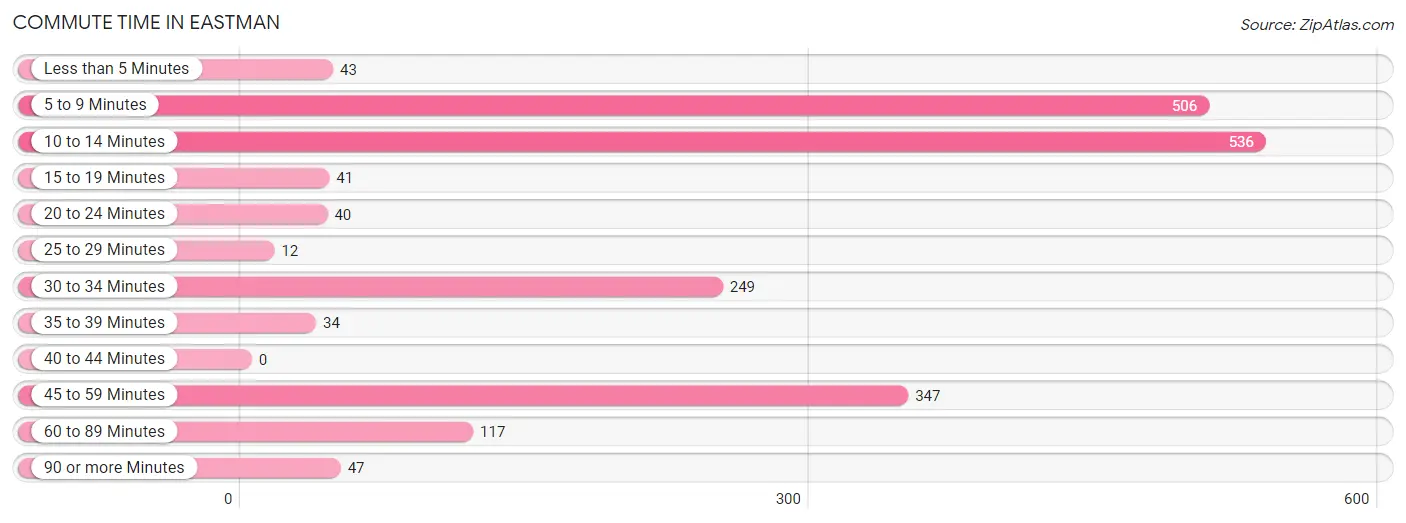
| Commute Time | # Commuters | % Commuters |
| Less than 5 Minutes | 43 | 2.2% |
| 5 to 9 Minutes | 506 | 25.7% |
| 10 to 14 Minutes | 536 | 27.2% |
| 15 to 19 Minutes | 41 | 2.1% |
| 20 to 24 Minutes | 40 | 2.0% |
| 25 to 29 Minutes | 12 | 0.6% |
| 30 to 34 Minutes | 249 | 12.6% |
| 35 to 39 Minutes | 34 | 1.7% |
| 40 to 44 Minutes | 0 | 0.0% |
| 45 to 59 Minutes | 347 | 17.6% |
| 60 to 89 Minutes | 117 | 5.9% |
| 90 or more Minutes | 47 | 2.4% |
Commute Time by Sex in Eastman
The most common commute times in Eastman are 45 to 59 minutes (286 commuters, 32.0%) for males and 10 to 14 minutes (425 commuters, 39.4%) for females.
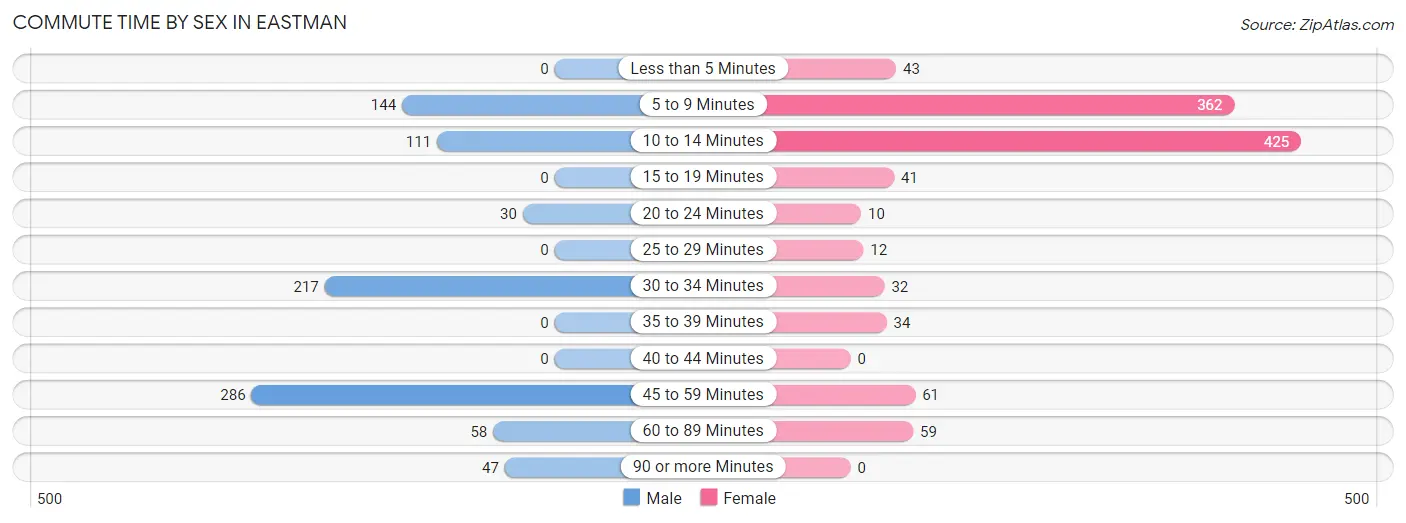
| Commute Time | Male | Female |
| Less than 5 Minutes | 0 (0.0%) | 43 (4.0%) |
| 5 to 9 Minutes | 144 (16.1%) | 362 (33.6%) |
| 10 to 14 Minutes | 111 (12.4%) | 425 (39.4%) |
| 15 to 19 Minutes | 0 (0.0%) | 41 (3.8%) |
| 20 to 24 Minutes | 30 (3.4%) | 10 (0.9%) |
| 25 to 29 Minutes | 0 (0.0%) | 12 (1.1%) |
| 30 to 34 Minutes | 217 (24.3%) | 32 (3.0%) |
| 35 to 39 Minutes | 0 (0.0%) | 34 (3.2%) |
| 40 to 44 Minutes | 0 (0.0%) | 0 (0.0%) |
| 45 to 59 Minutes | 286 (32.0%) | 61 (5.7%) |
| 60 to 89 Minutes | 58 (6.5%) | 59 (5.5%) |
| 90 or more Minutes | 47 (5.3%) | 0 (0.0%) |
Time of Departure to Work by Sex in Eastman
The most frequent times of departure to work in Eastman are 9:00 AM to 9:59 AM (201, 22.5%) for males and 7:00 AM to 7:29 AM (306, 28.4%) for females.
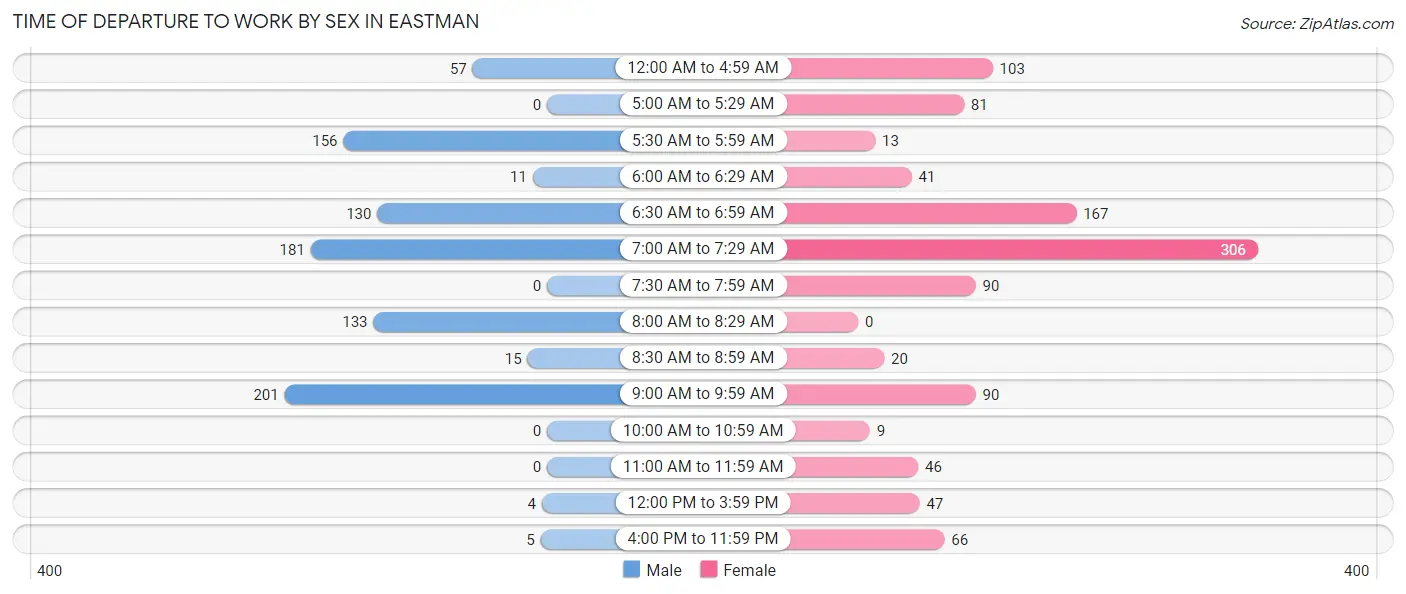
| Time of Departure | Male | Female |
| 12:00 AM to 4:59 AM | 57 (6.4%) | 103 (9.6%) |
| 5:00 AM to 5:29 AM | 0 (0.0%) | 81 (7.5%) |
| 5:30 AM to 5:59 AM | 156 (17.5%) | 13 (1.2%) |
| 6:00 AM to 6:29 AM | 11 (1.2%) | 41 (3.8%) |
| 6:30 AM to 6:59 AM | 130 (14.6%) | 167 (15.5%) |
| 7:00 AM to 7:29 AM | 181 (20.3%) | 306 (28.4%) |
| 7:30 AM to 7:59 AM | 0 (0.0%) | 90 (8.3%) |
| 8:00 AM to 8:29 AM | 133 (14.9%) | 0 (0.0%) |
| 8:30 AM to 8:59 AM | 15 (1.7%) | 20 (1.8%) |
| 9:00 AM to 9:59 AM | 201 (22.5%) | 90 (8.3%) |
| 10:00 AM to 10:59 AM | 0 (0.0%) | 9 (0.8%) |
| 11:00 AM to 11:59 AM | 0 (0.0%) | 46 (4.3%) |
| 12:00 PM to 3:59 PM | 4 (0.4%) | 47 (4.4%) |
| 4:00 PM to 11:59 PM | 5 (0.6%) | 66 (6.1%) |
| Total | 893 (100.0%) | 1,079 (100.0%) |
Housing Occupancy in Eastman
Occupancy by Ownership in Eastman
Of the total 1,981 dwellings in Eastman, owner-occupied units account for 981 (49.5%), while renter-occupied units make up 1,000 (50.5%).
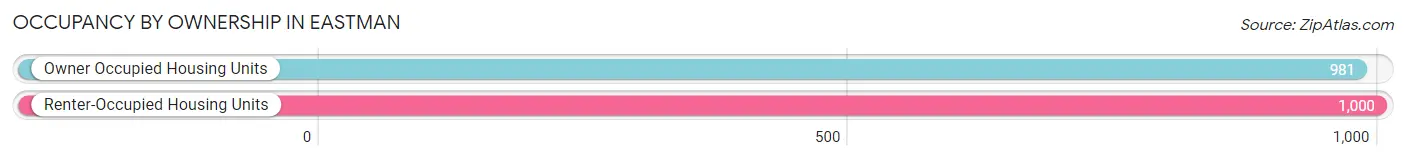
| Occupancy | # Housing Units | % Housing Units |
| Owner Occupied Housing Units | 981 | 49.5% |
| Renter-Occupied Housing Units | 1,000 | 50.5% |
| Total Occupied Housing Units | 1,981 | 100.0% |
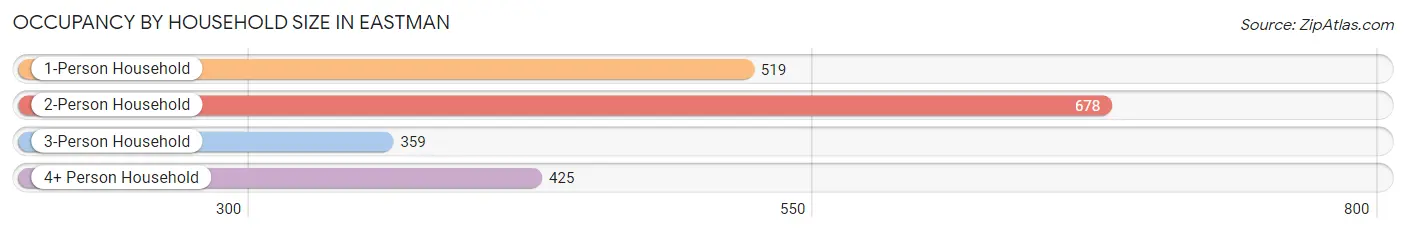
Occupancy by Household Size in Eastman
| Household Size | # Housing Units | % Housing Units |
| 1-Person Household | 519 | 26.2% |
| 2-Person Household | 678 | 34.2% |
| 3-Person Household | 359 | 18.1% |
| 4+ Person Household | 425 | 21.4% |
| Total Housing Units | 1,981 | 100.0% |
Occupancy by Ownership by Household Size in Eastman
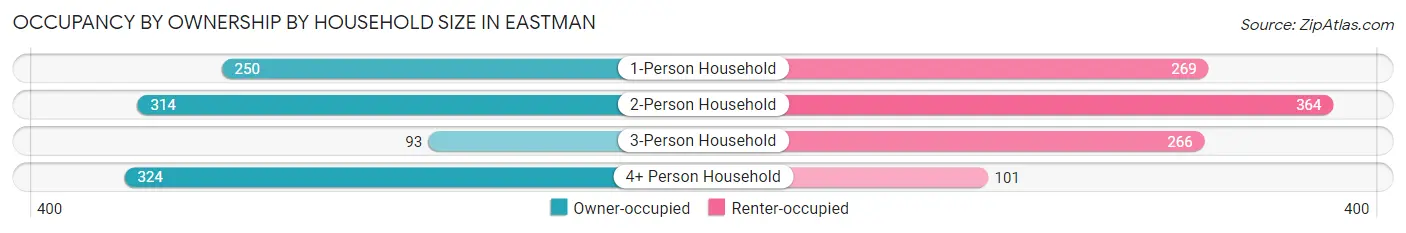
| Household Size | Owner-occupied | Renter-occupied |
| 1-Person Household | 250 (48.2%) | 269 (51.8%) |
| 2-Person Household | 314 (46.3%) | 364 (53.7%) |
| 3-Person Household | 93 (25.9%) | 266 (74.1%) |
| 4+ Person Household | 324 (76.2%) | 101 (23.8%) |
| Total Housing Units | 981 (49.5%) | 1,000 (50.5%) |
Occupancy by Educational Attainment in Eastman
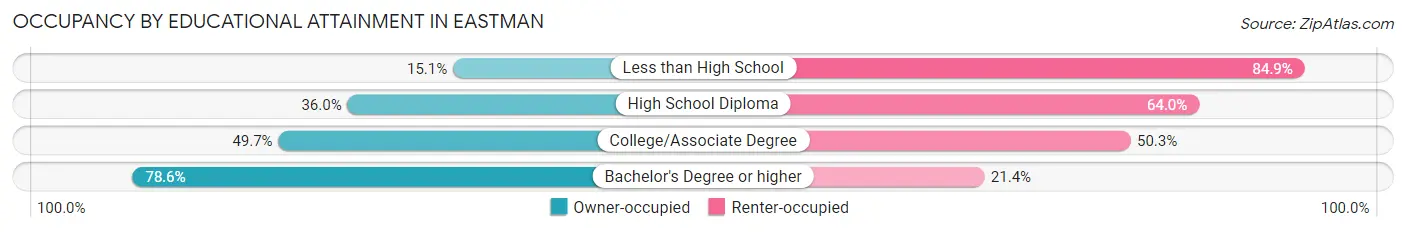
| Household Size | Owner-occupied | Renter-occupied |
| Less than High School | 25 (15.1%) | 141 (84.9%) |
| High School Diploma | 249 (36.0%) | 443 (64.0%) |
| College/Associate Degree | 302 (49.7%) | 306 (50.3%) |
| Bachelor's Degree or higher | 405 (78.6%) | 110 (21.4%) |
Occupancy by Age of Householder in Eastman
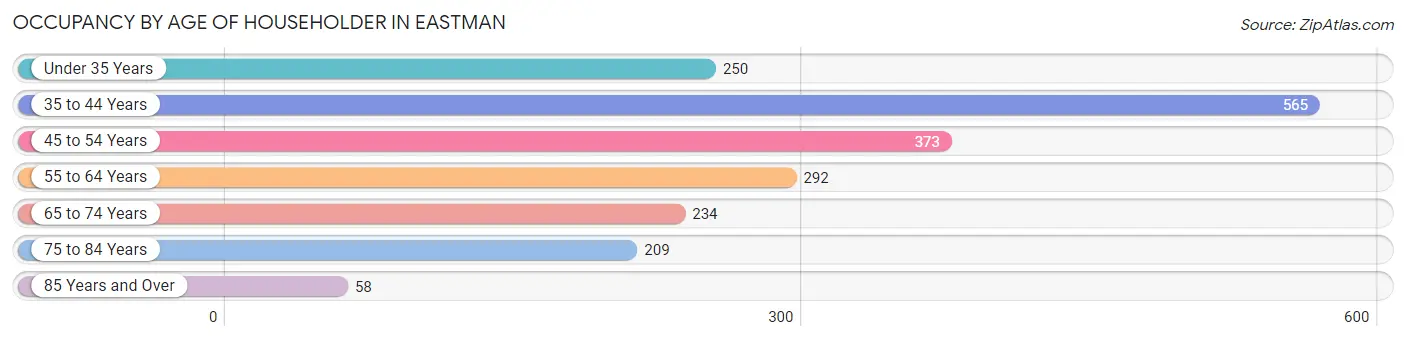
| Age Bracket | # Households | % Households |
| Under 35 Years | 250 | 12.6% |
| 35 to 44 Years | 565 | 28.5% |
| 45 to 54 Years | 373 | 18.8% |
| 55 to 64 Years | 292 | 14.7% |
| 65 to 74 Years | 234 | 11.8% |
| 75 to 84 Years | 209 | 10.5% |
| 85 Years and Over | 58 | 2.9% |
| Total | 1,981 | 100.0% |
Housing Finances in Eastman
Median Income by Occupancy in Eastman
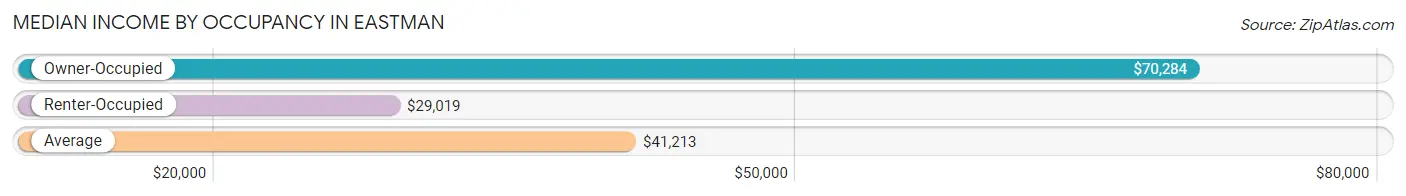
| Occupancy Type | # Households | Median Income |
| Owner-Occupied | 981 (49.5%) | $70,284 |
| Renter-Occupied | 1,000 (50.5%) | $29,019 |
| Average | 1,981 (100.0%) | $41,213 |
Occupancy by Householder Income Bracket in Eastman
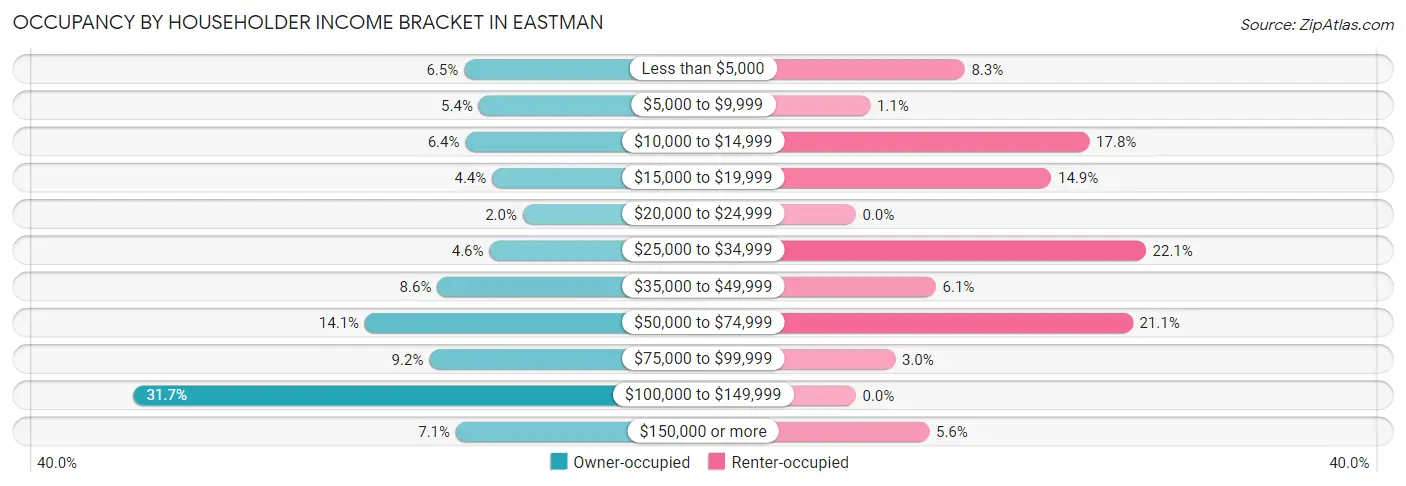
| Income Bracket | Owner-occupied | Renter-occupied |
| Less than $5,000 | 64 (6.5%) | 83 (8.3%) |
| $5,000 to $9,999 | 53 (5.4%) | 11 (1.1%) |
| $10,000 to $14,999 | 63 (6.4%) | 178 (17.8%) |
| $15,000 to $19,999 | 43 (4.4%) | 149 (14.9%) |
| $20,000 to $24,999 | 20 (2.0%) | 0 (0.0%) |
| $25,000 to $34,999 | 45 (4.6%) | 221 (22.1%) |
| $35,000 to $49,999 | 84 (8.6%) | 61 (6.1%) |
| $50,000 to $74,999 | 138 (14.1%) | 211 (21.1%) |
| $75,000 to $99,999 | 90 (9.2%) | 30 (3.0%) |
| $100,000 to $149,999 | 311 (31.7%) | 0 (0.0%) |
| $150,000 or more | 70 (7.1%) | 56 (5.6%) |
| Total | 981 (100.0%) | 1,000 (100.0%) |
Monthly Housing Cost Tiers in Eastman
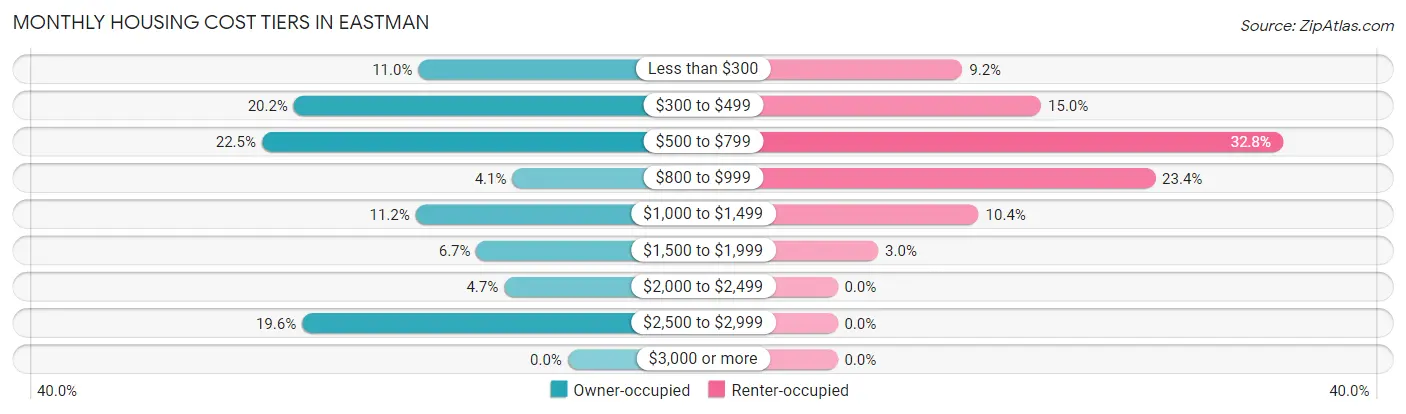
| Monthly Cost | Owner-occupied | Renter-occupied |
| Less than $300 | 108 (11.0%) | 92 (9.2%) |
| $300 to $499 | 198 (20.2%) | 150 (15.0%) |
| $500 to $799 | 221 (22.5%) | 328 (32.8%) |
| $800 to $999 | 40 (4.1%) | 234 (23.4%) |
| $1,000 to $1,499 | 110 (11.2%) | 104 (10.4%) |
| $1,500 to $1,999 | 66 (6.7%) | 30 (3.0%) |
| $2,000 to $2,499 | 46 (4.7%) | 0 (0.0%) |
| $2,500 to $2,999 | 192 (19.6%) | 0 (0.0%) |
| $3,000 or more | 0 (0.0%) | 0 (0.0%) |
| Total | 981 (100.0%) | 1,000 (100.0%) |
Physical Housing Characteristics in Eastman
Housing Structures in Eastman
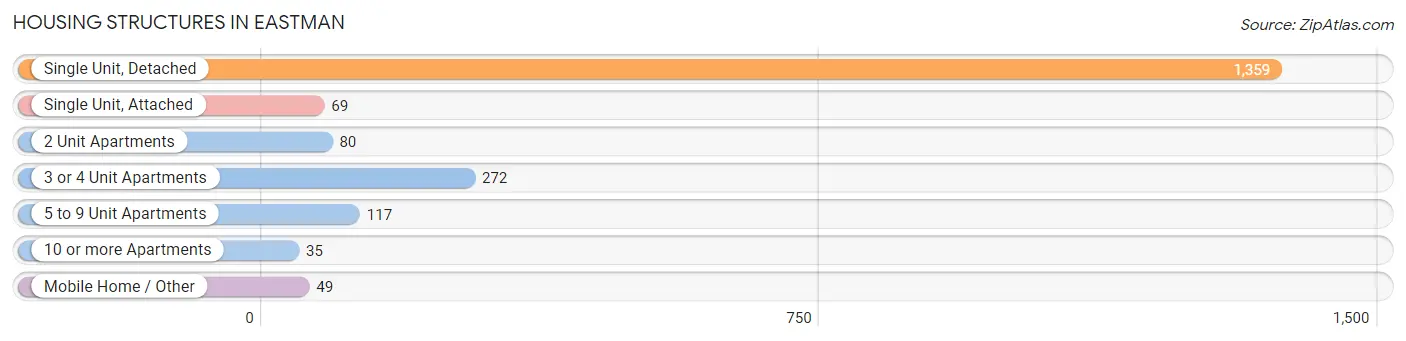
| Structure Type | # Housing Units | % Housing Units |
| Single Unit, Detached | 1,359 | 68.6% |
| Single Unit, Attached | 69 | 3.5% |
| 2 Unit Apartments | 80 | 4.0% |
| 3 or 4 Unit Apartments | 272 | 13.7% |
| 5 to 9 Unit Apartments | 117 | 5.9% |
| 10 or more Apartments | 35 | 1.8% |
| Mobile Home / Other | 49 | 2.5% |
| Total | 1,981 | 100.0% |
Housing Structures by Occupancy in Eastman
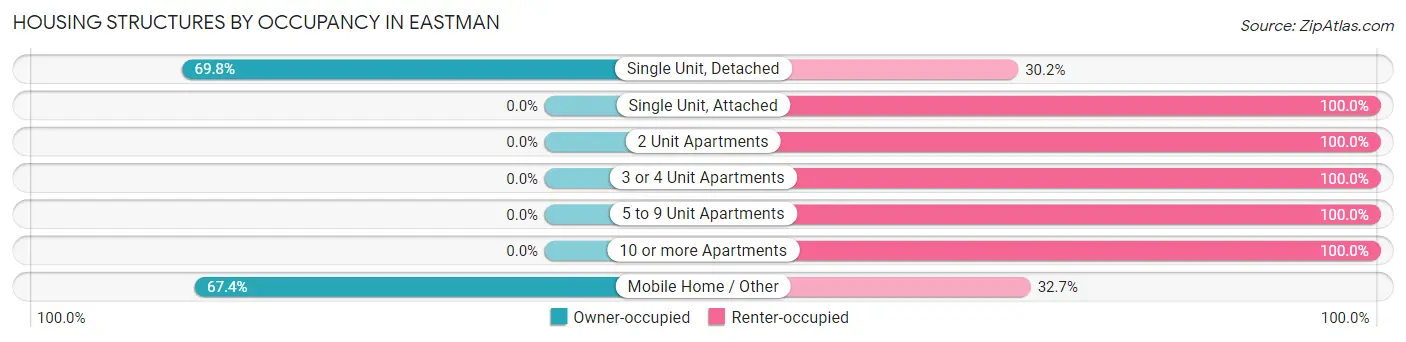
| Structure Type | Owner-occupied | Renter-occupied |
| Single Unit, Detached | 948 (69.8%) | 411 (30.2%) |
| Single Unit, Attached | 0 (0.0%) | 69 (100.0%) |
| 2 Unit Apartments | 0 (0.0%) | 80 (100.0%) |
| 3 or 4 Unit Apartments | 0 (0.0%) | 272 (100.0%) |
| 5 to 9 Unit Apartments | 0 (0.0%) | 117 (100.0%) |
| 10 or more Apartments | 0 (0.0%) | 35 (100.0%) |
| Mobile Home / Other | 33 (67.3%) | 16 (32.7%) |
| Total | 981 (49.5%) | 1,000 (50.5%) |
Housing Structures by Number of Rooms in Eastman
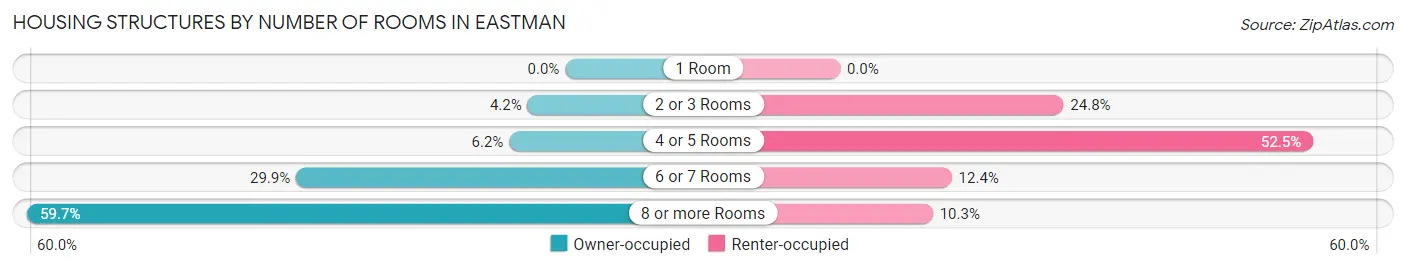
| Number of Rooms | Owner-occupied | Renter-occupied |
| 1 Room | 0 (0.0%) | 0 (0.0%) |
| 2 or 3 Rooms | 41 (4.2%) | 248 (24.8%) |
| 4 or 5 Rooms | 61 (6.2%) | 525 (52.5%) |
| 6 or 7 Rooms | 293 (29.9%) | 124 (12.4%) |
| 8 or more Rooms | 586 (59.7%) | 103 (10.3%) |
| Total | 981 (100.0%) | 1,000 (100.0%) |
Housing Structure by Heating Type in Eastman
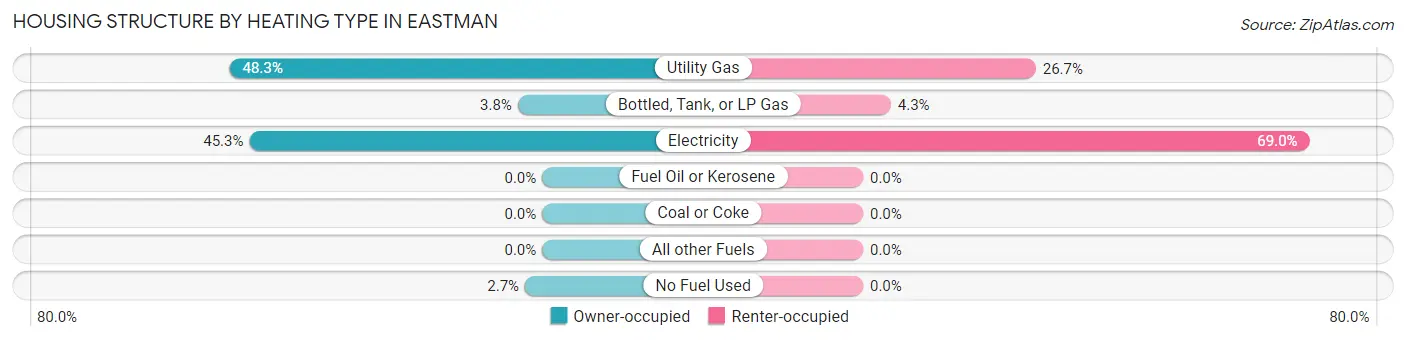
| Heating Type | Owner-occupied | Renter-occupied |
| Utility Gas | 474 (48.3%) | 267 (26.7%) |
| Bottled, Tank, or LP Gas | 37 (3.8%) | 43 (4.3%) |
| Electricity | 444 (45.3%) | 690 (69.0%) |
| Fuel Oil or Kerosene | 0 (0.0%) | 0 (0.0%) |
| Coal or Coke | 0 (0.0%) | 0 (0.0%) |
| All other Fuels | 0 (0.0%) | 0 (0.0%) |
| No Fuel Used | 26 (2.6%) | 0 (0.0%) |
| Total | 981 (100.0%) | 1,000 (100.0%) |
Household Vehicle Usage in Eastman
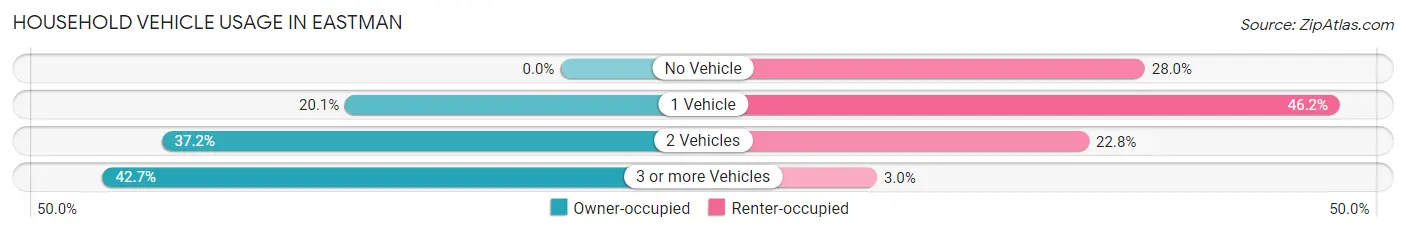
| Vehicles per Household | Owner-occupied | Renter-occupied |
| No Vehicle | 0 (0.0%) | 280 (28.0%) |
| 1 Vehicle | 197 (20.1%) | 462 (46.2%) |
| 2 Vehicles | 365 (37.2%) | 228 (22.8%) |
| 3 or more Vehicles | 419 (42.7%) | 30 (3.0%) |
| Total | 981 (100.0%) | 1,000 (100.0%) |
Real Estate & Mortgages in Eastman
Real Estate and Mortgage Overview in Eastman
| Characteristic | Without Mortgage | With Mortgage |
| Housing Units | 454 | 527 |
| Median Property Value | $79,400 | $208,000 |
| Median Household Income | $45,625 | $57 |
| Monthly Housing Costs | $430 | $0 |
| Real Estate Taxes | $982 | $17 |
Property Value by Mortgage Status in Eastman
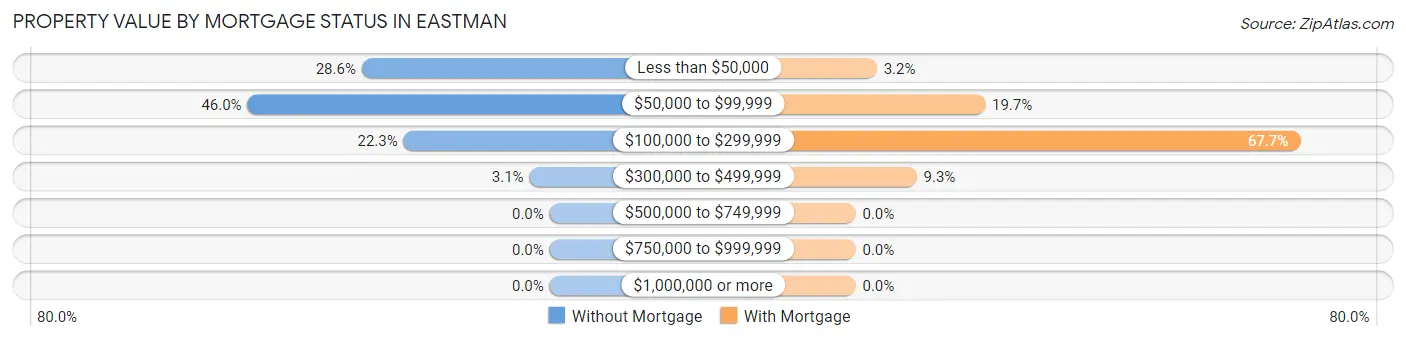
| Property Value | Without Mortgage | With Mortgage |
| Less than $50,000 | 130 (28.6%) | 17 (3.2%) |
| $50,000 to $99,999 | 209 (46.0%) | 104 (19.7%) |
| $100,000 to $299,999 | 101 (22.3%) | 357 (67.7%) |
| $300,000 to $499,999 | 14 (3.1%) | 49 (9.3%) |
| $500,000 to $749,999 | 0 (0.0%) | 0 (0.0%) |
| $750,000 to $999,999 | 0 (0.0%) | 0 (0.0%) |
| $1,000,000 or more | 0 (0.0%) | 0 (0.0%) |
| Total | 454 (100.0%) | 527 (100.0%) |
Household Income by Mortgage Status in Eastman
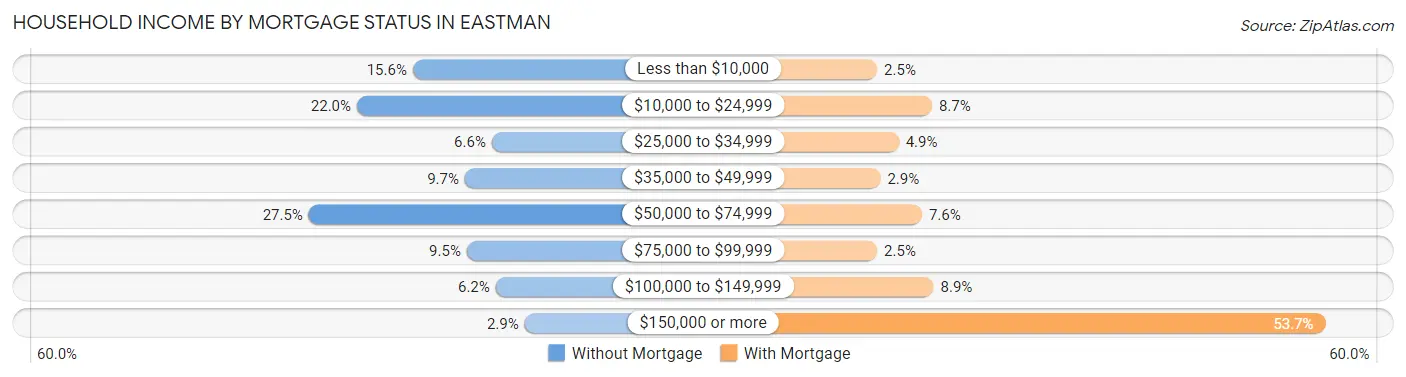
| Household Income | Without Mortgage | With Mortgage |
| Less than $10,000 | 71 (15.6%) | 13 (2.5%) |
| $10,000 to $24,999 | 100 (22.0%) | 46 (8.7%) |
| $25,000 to $34,999 | 30 (6.6%) | 26 (4.9%) |
| $35,000 to $49,999 | 44 (9.7%) | 15 (2.9%) |
| $50,000 to $74,999 | 125 (27.5%) | 40 (7.6%) |
| $75,000 to $99,999 | 43 (9.5%) | 13 (2.5%) |
| $100,000 to $149,999 | 28 (6.2%) | 47 (8.9%) |
| $150,000 or more | 13 (2.9%) | 283 (53.7%) |
| Total | 454 (100.0%) | 527 (100.0%) |
Property Value to Household Income Ratio in Eastman
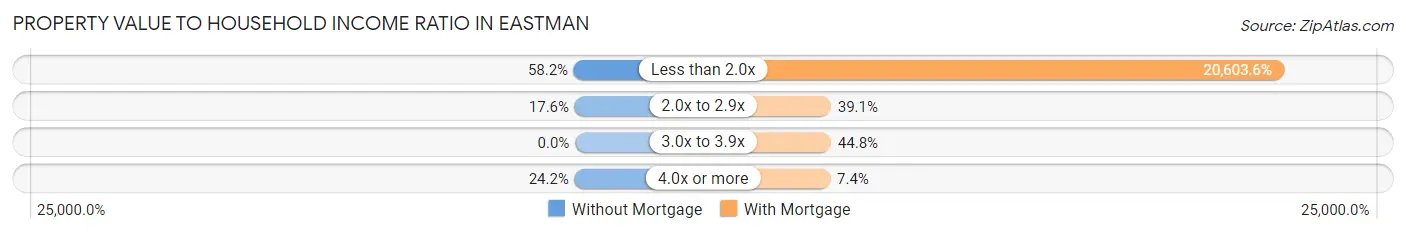
| Value-to-Income Ratio | Without Mortgage | With Mortgage |
| Less than 2.0x | 264 (58.2%) | 108,581 (20,603.6%) |
| 2.0x to 2.9x | 80 (17.6%) | 206 (39.1%) |
| 3.0x to 3.9x | 0 (0.0%) | 236 (44.8%) |
| 4.0x or more | 110 (24.2%) | 39 (7.4%) |
| Total | 454 (100.0%) | 527 (100.0%) |
Real Estate Taxes by Mortgage Status in Eastman
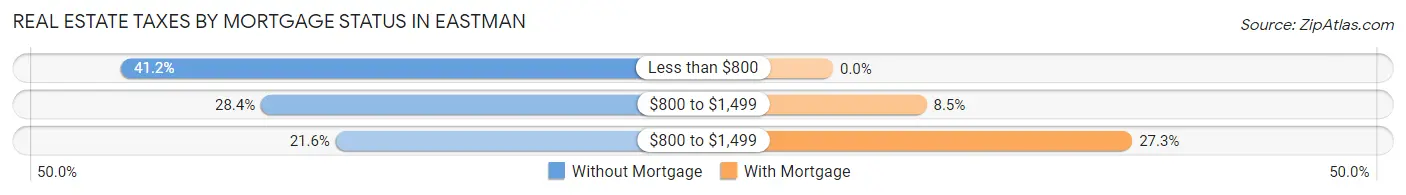
| Property Taxes | Without Mortgage | With Mortgage |
| Less than $800 | 187 (41.2%) | 0 (0.0%) |
| $800 to $1,499 | 129 (28.4%) | 45 (8.5%) |
| $800 to $1,499 | 98 (21.6%) | 144 (27.3%) |
| Total | 454 (100.0%) | 527 (100.0%) |
Health & Disability in Eastman
Health Insurance Coverage by Age in Eastman
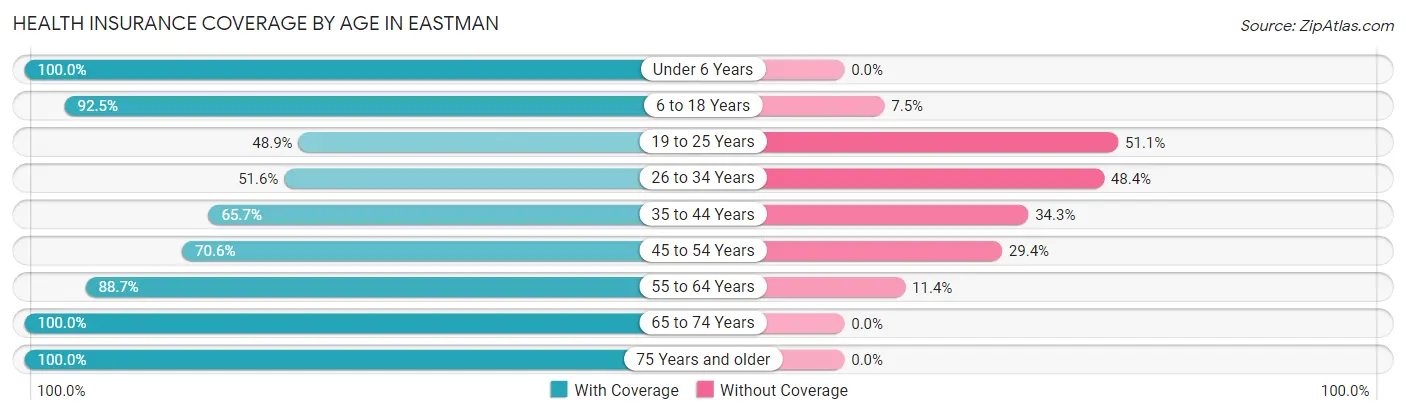
| Age Bracket | With Coverage | Without Coverage |
| Under 6 Years | 353 (100.0%) | 0 (0.0%) |
| 6 to 18 Years | 978 (92.5%) | 79 (7.5%) |
| 19 to 25 Years | 254 (48.9%) | 265 (51.1%) |
| 26 to 34 Years | 195 (51.6%) | 183 (48.4%) |
| 35 to 44 Years | 722 (65.7%) | 377 (34.3%) |
| 45 to 54 Years | 490 (70.6%) | 204 (29.4%) |
| 55 to 64 Years | 375 (88.6%) | 48 (11.4%) |
| 65 to 74 Years | 560 (100.0%) | 0 (0.0%) |
| 75 Years and older | 363 (100.0%) | 0 (0.0%) |
| Total | 4,290 (78.8%) | 1,156 (21.2%) |
Health Insurance Coverage by Citizenship Status in Eastman
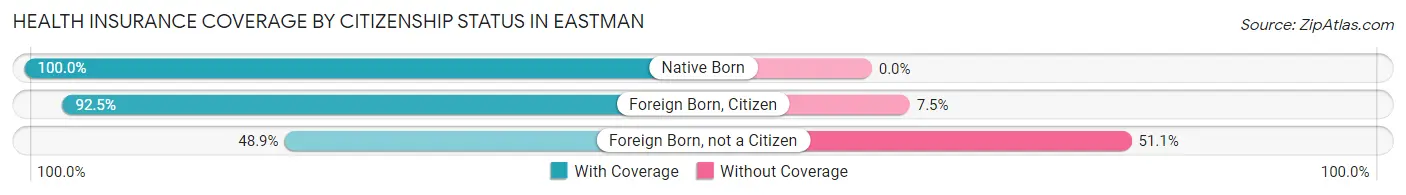
| Citizenship Status | With Coverage | Without Coverage |
| Native Born | 353 (100.0%) | 0 (0.0%) |
| Foreign Born, Citizen | 978 (92.5%) | 79 (7.5%) |
| Foreign Born, not a Citizen | 254 (48.9%) | 265 (51.1%) |
Health Insurance Coverage by Household Income in Eastman
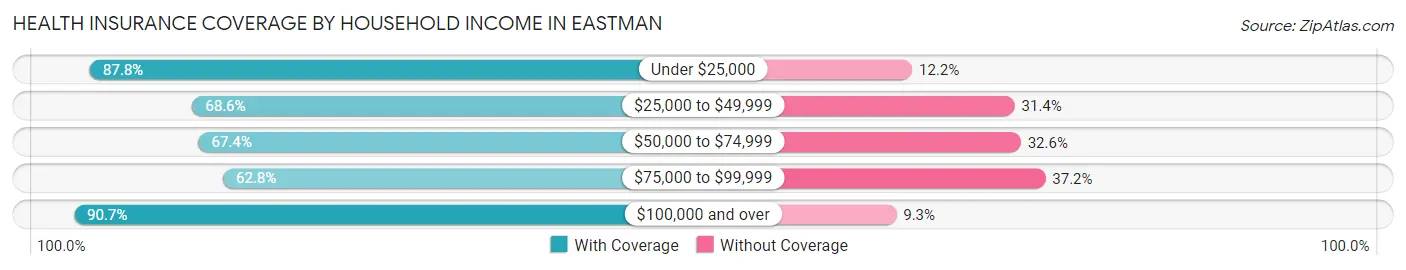
| Household Income | With Coverage | Without Coverage |
| Under $25,000 | 997 (87.8%) | 139 (12.2%) |
| $25,000 to $49,999 | 735 (68.6%) | 337 (31.4%) |
| $50,000 to $74,999 | 691 (67.4%) | 334 (32.6%) |
| $75,000 to $99,999 | 292 (62.8%) | 173 (37.2%) |
| $100,000 and over | 1,449 (90.7%) | 148 (9.3%) |
Public vs Private Health Insurance Coverage by Age in Eastman
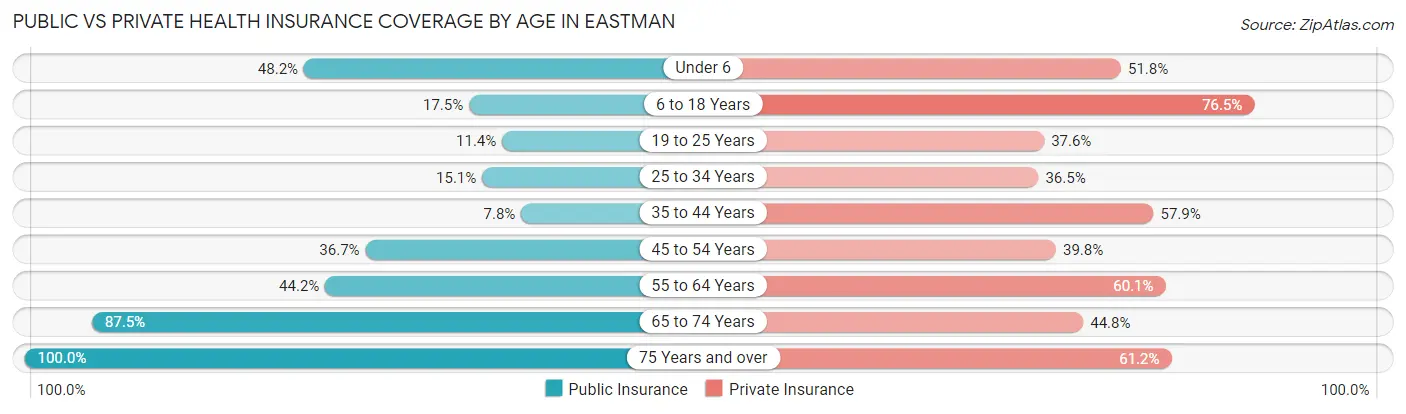
| Age Bracket | Public Insurance | Private Insurance |
| Under 6 | 170 (48.2%) | 183 (51.8%) |
| 6 to 18 Years | 185 (17.5%) | 809 (76.5%) |
| 19 to 25 Years | 59 (11.4%) | 195 (37.6%) |
| 25 to 34 Years | 57 (15.1%) | 138 (36.5%) |
| 35 to 44 Years | 86 (7.8%) | 636 (57.9%) |
| 45 to 54 Years | 255 (36.7%) | 276 (39.8%) |
| 55 to 64 Years | 187 (44.2%) | 254 (60.1%) |
| 65 to 74 Years | 490 (87.5%) | 251 (44.8%) |
| 75 Years and over | 363 (100.0%) | 222 (61.2%) |
| Total | 1,852 (34.0%) | 2,964 (54.4%) |
Disability Status by Sex by Age in Eastman
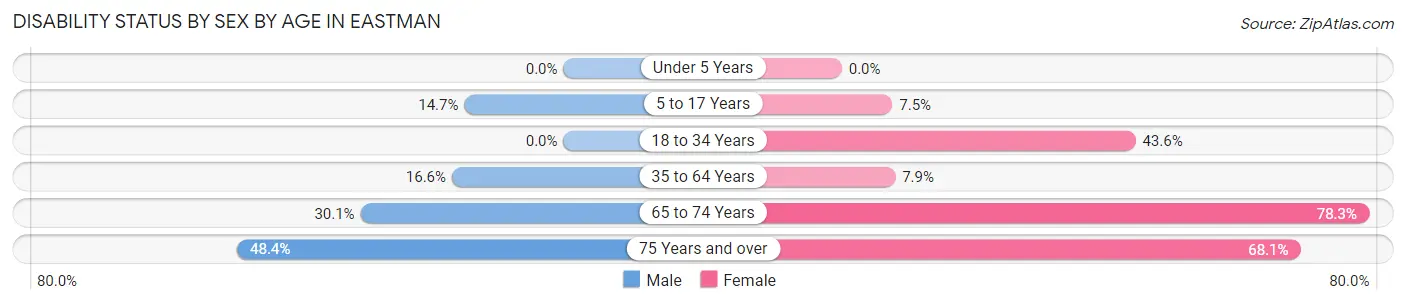
| Age Bracket | Male | Female |
| Under 5 Years | 0 (0.0%) | 0 (0.0%) |
| 5 to 17 Years | 74 (14.7%) | 35 (7.5%) |
| 18 to 34 Years | 0 (0.0%) | 174 (43.6%) |
| 35 to 64 Years | 179 (16.6%) | 90 (7.9%) |
| 65 to 74 Years | 69 (30.1%) | 259 (78.2%) |
| 75 Years and over | 62 (48.4%) | 160 (68.1%) |
Disability Class by Sex by Age in Eastman
Disability Class: Hearing Difficulty
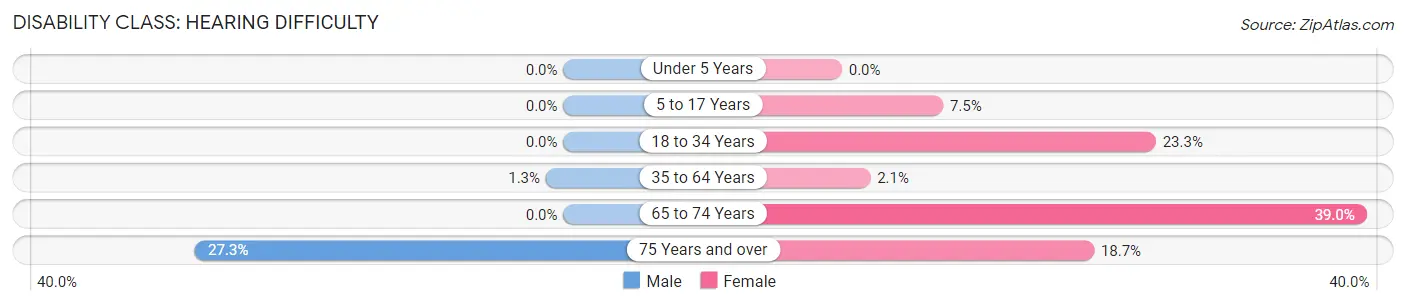
| Age Bracket | Male | Female |
| Under 5 Years | 0 (0.0%) | 0 (0.0%) |
| 5 to 17 Years | 0 (0.0%) | 35 (7.5%) |
| 18 to 34 Years | 0 (0.0%) | 93 (23.3%) |
| 35 to 64 Years | 14 (1.3%) | 24 (2.1%) |
| 65 to 74 Years | 0 (0.0%) | 129 (39.0%) |
| 75 Years and over | 35 (27.3%) | 44 (18.7%) |
Disability Class: Vision Difficulty
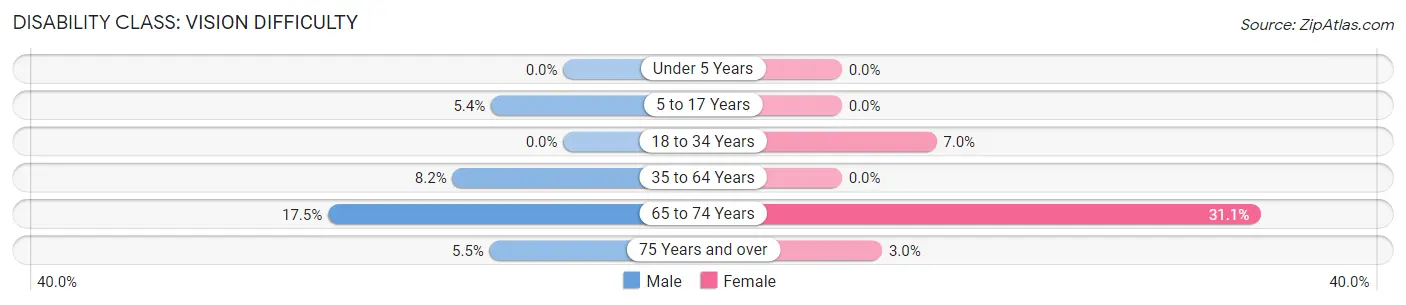
| Age Bracket | Male | Female |
| Under 5 Years | 0 (0.0%) | 0 (0.0%) |
| 5 to 17 Years | 27 (5.4%) | 0 (0.0%) |
| 18 to 34 Years | 0 (0.0%) | 28 (7.0%) |
| 35 to 64 Years | 89 (8.2%) | 0 (0.0%) |
| 65 to 74 Years | 40 (17.5%) | 103 (31.1%) |
| 75 Years and over | 7 (5.5%) | 7 (3.0%) |
Disability Class: Cognitive Difficulty
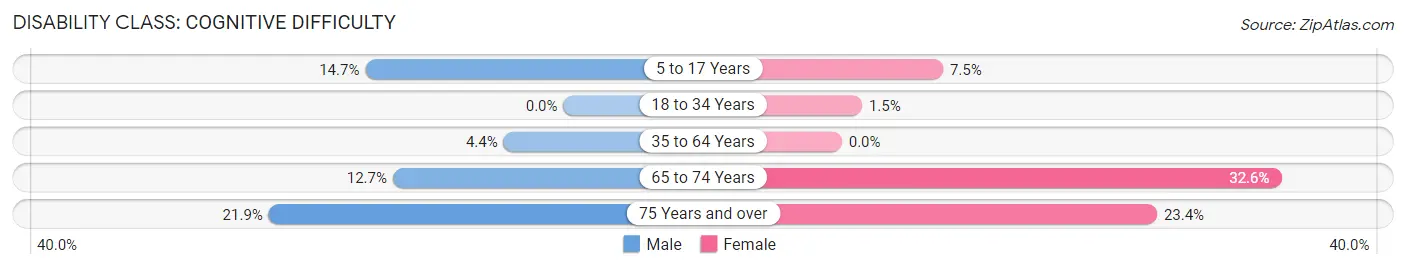
| Age Bracket | Male | Female |
| 5 to 17 Years | 74 (14.7%) | 35 (7.5%) |
| 18 to 34 Years | 0 (0.0%) | 6 (1.5%) |
| 35 to 64 Years | 48 (4.4%) | 0 (0.0%) |
| 65 to 74 Years | 29 (12.7%) | 108 (32.6%) |
| 75 Years and over | 28 (21.9%) | 55 (23.4%) |
Disability Class: Ambulatory Difficulty
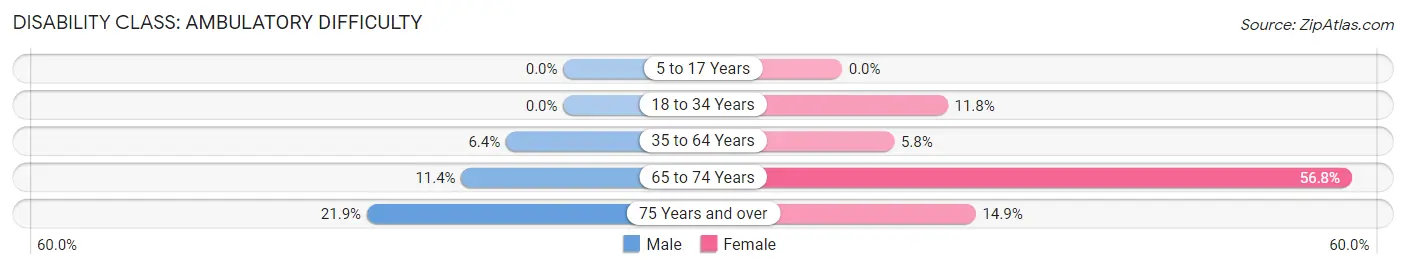
| Age Bracket | Male | Female |
| 5 to 17 Years | 0 (0.0%) | 0 (0.0%) |
| 18 to 34 Years | 0 (0.0%) | 47 (11.8%) |
| 35 to 64 Years | 69 (6.4%) | 66 (5.8%) |
| 65 to 74 Years | 26 (11.4%) | 188 (56.8%) |
| 75 Years and over | 28 (21.9%) | 35 (14.9%) |
Disability Class: Self-Care Difficulty
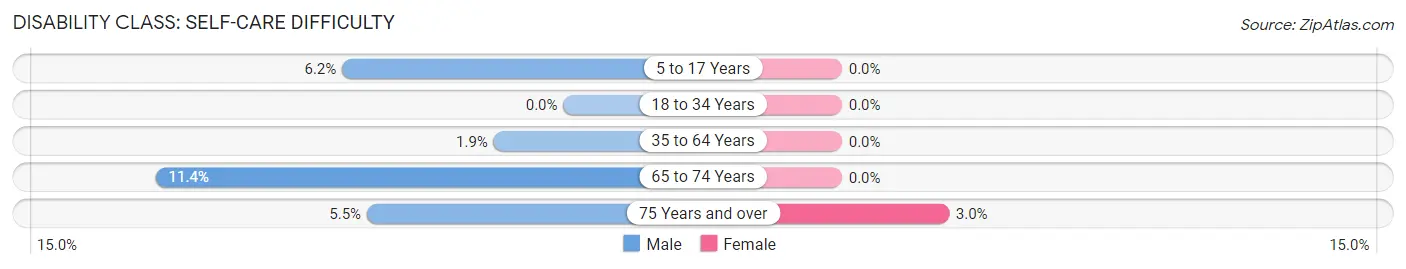
| Age Bracket | Male | Female |
| 5 to 17 Years | 31 (6.2%) | 0 (0.0%) |
| 18 to 34 Years | 0 (0.0%) | 0 (0.0%) |
| 35 to 64 Years | 21 (1.9%) | 0 (0.0%) |
| 65 to 74 Years | 26 (11.4%) | 0 (0.0%) |
| 75 Years and over | 7 (5.5%) | 7 (3.0%) |
Technology Access in Eastman
Computing Device Access in Eastman
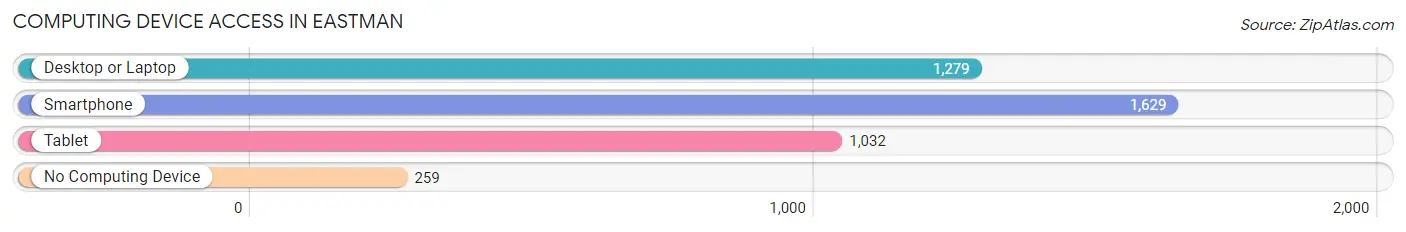
| Device Type | # Households | % Households |
| Desktop or Laptop | 1,279 | 64.6% |
| Smartphone | 1,629 | 82.2% |
| Tablet | 1,032 | 52.1% |
| No Computing Device | 259 | 13.1% |
| Total | 1,981 | 100.0% |
Internet Access in Eastman
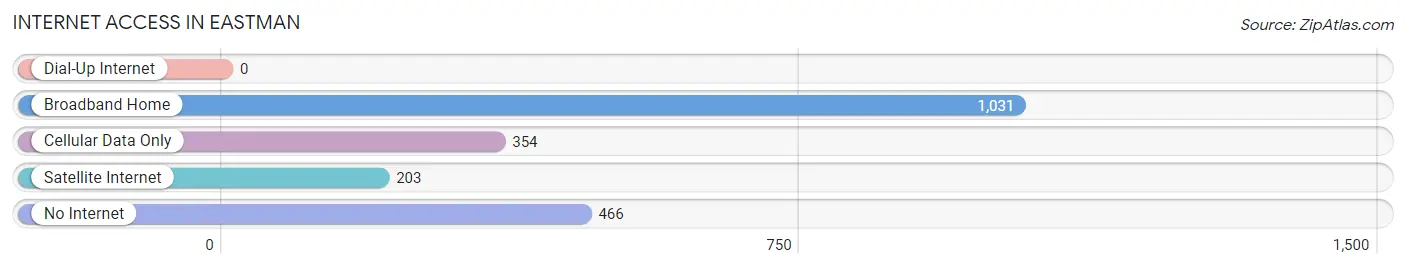
| Internet Type | # Households | % Households |
| Dial-Up Internet | 0 | 0.0% |
| Broadband Home | 1,031 | 52.0% |
| Cellular Data Only | 354 | 17.9% |
| Satellite Internet | 203 | 10.2% |
| No Internet | 466 | 23.5% |
| Total | 1,981 | 100.0% |
Eastman Summary
Eastman, Georgia is a small city located in Dodge County, in the southeastern part of the state. It is situated along the Ocmulgee River, about halfway between Macon and Savannah. The city was founded in 1871 and has a population of 5,500 people.
History
Eastman was founded in 1871 by William Eastman, a former Confederate soldier. He purchased the land from the Creek Indians and named the town after himself. The town was incorporated in 1872 and quickly became a thriving center of commerce. The railroad arrived in 1881, connecting Eastman to the rest of the state.
The town grew rapidly in the late 19th and early 20th centuries, becoming a major center for cotton production and processing. The town was also home to several large manufacturing plants, including a cotton mill, a furniture factory, and a shoe factory.
In the 1950s, Eastman began to decline as the cotton industry moved away from the area. The town's population decreased and many of the factories closed. In the late 1970s, the town began to experience a resurgence as new businesses moved in and the population began to grow again.
Geography
Eastman is located in the southeastern part of the state, about halfway between Macon and Savannah. The city is situated along the Ocmulgee River, which provides a natural border between Eastman and the neighboring towns of Rhine and Chauncey. The city is surrounded by rolling hills and is located in a region of the state known as the “Black Belt”, due to its rich, dark soil.
The climate in Eastman is mild and humid, with hot summers and mild winters. The average annual temperature is around 70 degrees Fahrenheit. The area receives an average of 48 inches of rain per year.
Economy
Eastman’s economy is largely based on agriculture and manufacturing. The city is home to several large manufacturing plants, including a cotton mill, a furniture factory, and a shoe factory. The city is also home to several small businesses, including restaurants, retail stores, and service providers.
The city is also home to several educational institutions, including a community college and a technical college. The city is also home to a hospital and several medical clinics.
Demographics
As of the 2010 census, Eastman had a population of 5,500 people. The racial makeup of the city was 57.3% White, 37.2% African American, 0.3% Native American, 0.7% Asian, and 4.5% from other races. The median household income was $30,000, and the median age was 37.
Eastman is a small, close-knit community with a strong sense of pride and tradition. The city is home to several churches, a library, and a museum. The city also hosts several annual festivals and events, including the Eastman Cotton Festival and the Eastman Music Festival.
Common Questions
What is Per Capita Income in Eastman?
Per Capita income in Eastman is $22,787.
What is the Median Family Income in Eastman?
Median Family Income in Eastman is $52,480.
What is the Median Household income in Eastman?
Median Household Income in Eastman is $41,213.
What is Family Income Deficit in Eastman?
Family Income Deficit in Eastman is $8,721.
Families that are below poverty line in Eastman earn $8,721 less on average than the poverty threshold level.
What is Inequality or Gini Index in Eastman?
Inequality or Gini Index in Eastman is 0.52.
What is the Total Population of Eastman?
Total Population of Eastman is 5,635.
What is the Total Male Population of Eastman?
Total Male Population of Eastman is 2,879.
What is the Total Female Population of Eastman?
Total Female Population of Eastman is 2,756.
What is the Ratio of Males per 100 Females in Eastman?
There are 104.46 Males per 100 Females in Eastman.
What is the Ratio of Females per 100 Males in Eastman?
There are 95.73 Females per 100 Males in Eastman.
What is the Median Population Age in Eastman?
Median Population Age in Eastman is 38.5 Years.
What is the Average Family Size in Eastman
Average Family Size in Eastman is 3.2 People.
What is the Average Household Size in Eastman
Average Household Size in Eastman is 2.7 People.
How Large is the Labor Force in Eastman?
There are 2,146 People in the Labor Forcein in Eastman.
What is the Percentage of People in the Labor Force in Eastman?
48.0% of People are in the Labor Force in Eastman.
What is the Unemployment Rate in Eastman?
Unemployment Rate in Eastman is 2.1%.