Danville, GA Map & Demographics
Danville Map
Danville Overview
$20,619
PER CAPITA INCOME
$70,139
AVG FAMILY INCOME
$46,750
AVG HOUSEHOLD INCOME
0.38
INEQUALITY / GINI INDEX
186
TOTAL POPULATION
106
MALE POPULATION
80
FEMALE POPULATION
132.50
MALES / 100 FEMALES
75.47
FEMALES / 100 MALES
46.8
MEDIAN AGE
3.9
AVG FAMILY SIZE
3.0
AVG HOUSEHOLD SIZE
46
LABOR FORCE [ PEOPLE ]
33.3%
PERCENT IN LABOR FORCE
Danville Zip Codes
Danville Area Codes
Income in Danville
Income Overview in Danville
Per Capita Income in Danville is $20,619, while median incomes of families and households are $70,139 and $46,750 respectively.
| Characteristic | Number | Measure |
| Per Capita Income | 186 | $20,619 |
| Median Family Income | 35 | $70,139 |
| Mean Family Income | 35 | $57,914 |
| Median Household Income | 63 | $46,750 |
| Mean Household Income | 63 | $51,900 |
| Income Deficit | 35 | $0 |
| Wage / Income Gap (%) | 186 | 0.00% |
| Wage / Income Gap ($) | 186 | 100.00¢ per $1 |
| Gini / Inequality Index | 186 | 0.38 |
Earnings by Sex in Danville
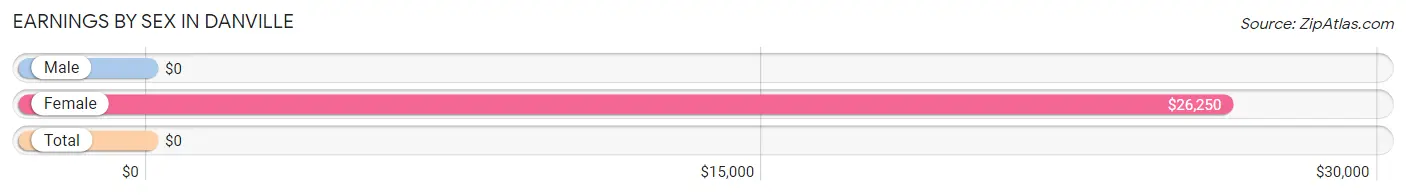
| Sex | Number | Average Earnings |
| Male | 39 (84.8%) | $0 |
| Female | 7 (15.2%) | $26,250 |
| Total | 46 (100.0%) | $0 |
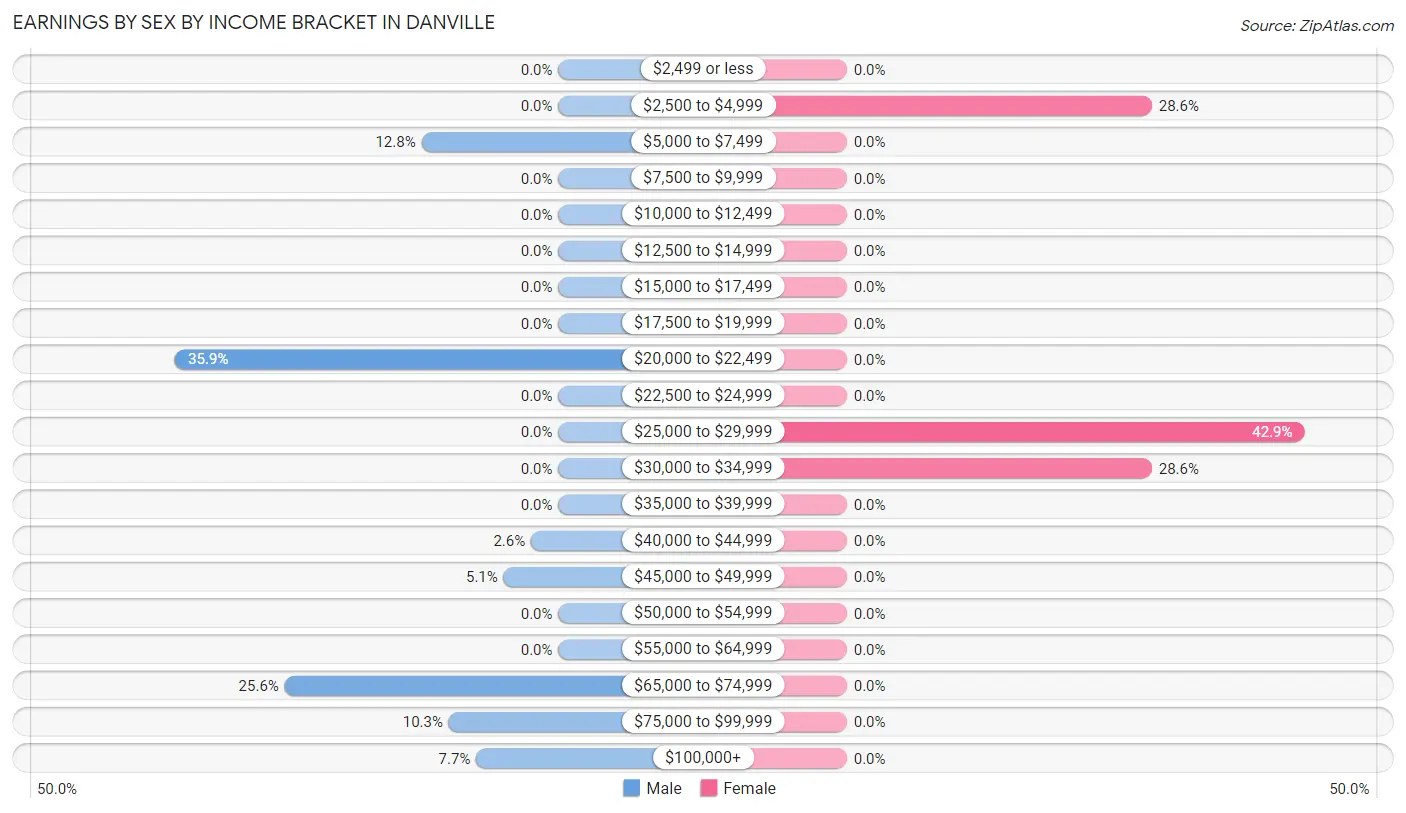
Earnings by Sex by Income Bracket in Danville
The most common earnings brackets in Danville are $20,000 to $22,499 for men (14 | 35.9%) and $25,000 to $29,999 for women (3 | 42.9%).
| Income | Male | Female |
| $2,499 or less | 0 (0.0%) | 0 (0.0%) |
| $2,500 to $4,999 | 0 (0.0%) | 2 (28.6%) |
| $5,000 to $7,499 | 5 (12.8%) | 0 (0.0%) |
| $7,500 to $9,999 | 0 (0.0%) | 0 (0.0%) |
| $10,000 to $12,499 | 0 (0.0%) | 0 (0.0%) |
| $12,500 to $14,999 | 0 (0.0%) | 0 (0.0%) |
| $15,000 to $17,499 | 0 (0.0%) | 0 (0.0%) |
| $17,500 to $19,999 | 0 (0.0%) | 0 (0.0%) |
| $20,000 to $22,499 | 14 (35.9%) | 0 (0.0%) |
| $22,500 to $24,999 | 0 (0.0%) | 0 (0.0%) |
| $25,000 to $29,999 | 0 (0.0%) | 3 (42.9%) |
| $30,000 to $34,999 | 0 (0.0%) | 2 (28.6%) |
| $35,000 to $39,999 | 0 (0.0%) | 0 (0.0%) |
| $40,000 to $44,999 | 1 (2.6%) | 0 (0.0%) |
| $45,000 to $49,999 | 2 (5.1%) | 0 (0.0%) |
| $50,000 to $54,999 | 0 (0.0%) | 0 (0.0%) |
| $55,000 to $64,999 | 0 (0.0%) | 0 (0.0%) |
| $65,000 to $74,999 | 10 (25.6%) | 0 (0.0%) |
| $75,000 to $99,999 | 4 (10.3%) | 0 (0.0%) |
| $100,000+ | 3 (7.7%) | 0 (0.0%) |
| Total | 39 (100.0%) | 7 (100.0%) |
Earnings by Sex by Educational Attainment in Danville
| Educational Attainment | Male Income | Female Income |
| Less than High School | - | - |
| High School Diploma | - | - |
| College or Associate's Degree | - | - |
| Bachelor's Degree | - | - |
| Graduate Degree | - | - |
| Total | - | - |
Family Income in Danville
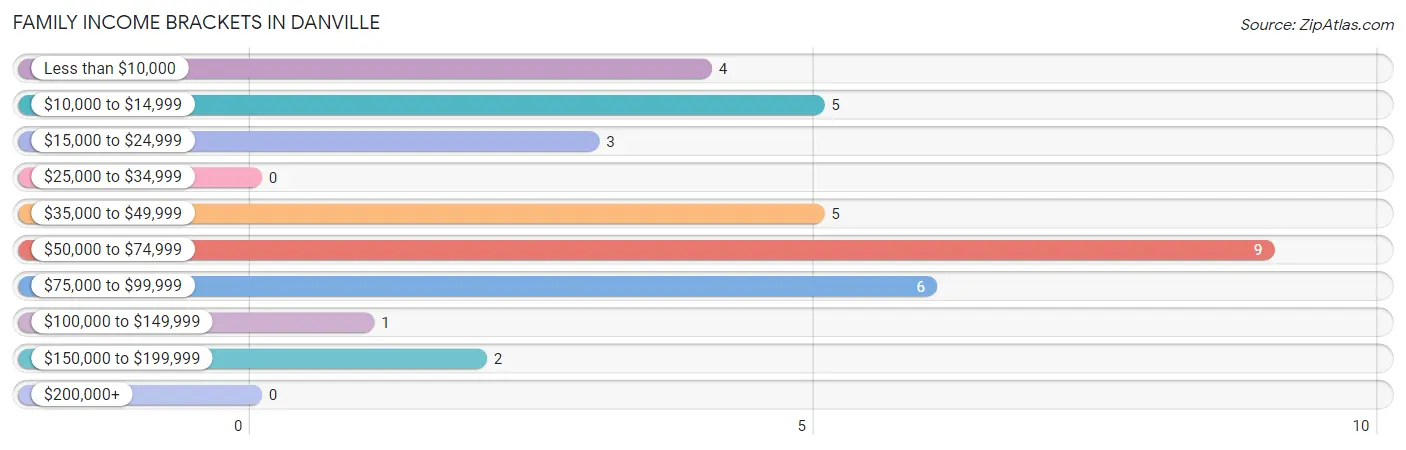
Family Income Brackets in Danville
According to the Danville family income data, there are 9 families falling into the $50,000 to $74,999 income range, which is the most common income bracket and makes up 25.7% of all families.
| Income Bracket | # Families | % Families |
| Less than $10,000 | 4 | 11.4% |
| $10,000 to $14,999 | 5 | 14.3% |
| $15,000 to $24,999 | 3 | 8.6% |
| $25,000 to $34,999 | 0 | 0.0% |
| $35,000 to $49,999 | 5 | 14.3% |
| $50,000 to $74,999 | 9 | 25.7% |
| $75,000 to $99,999 | 6 | 17.1% |
| $100,000 to $149,999 | 1 | 2.9% |
| $150,000 to $199,999 | 2 | 5.7% |
| $200,000+ | 0 | 0.0% |
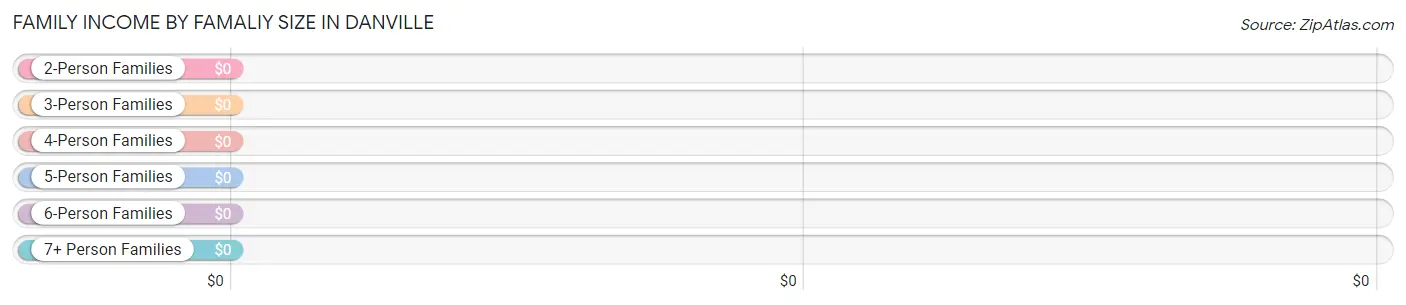
Family Income by Famaliy Size in Danville
| Income Bracket | # Families | Median Income |
| 2-Person Families | 10 (28.6%) | $0 |
| 3-Person Families | 11 (31.4%) | $0 |
| 4-Person Families | 7 (20.0%) | $0 |
| 5-Person Families | 7 (20.0%) | $0 |
| 6-Person Families | 0 (0.0%) | $0 |
| 7+ Person Families | 0 (0.0%) | $0 |
| Total | 35 (100.0%) | $70,139 |
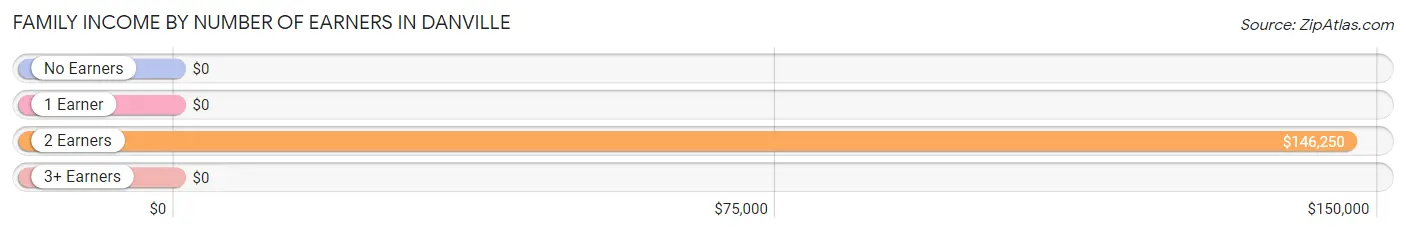
Family Income by Number of Earners in Danville
| Number of Earners | # Families | Median Income |
| No Earners | 20 (57.1%) | $0 |
| 1 Earner | 10 (28.6%) | $0 |
| 2 Earners | 5 (14.3%) | $146,250 |
| 3+ Earners | 0 (0.0%) | $0 |
| Total | 35 (100.0%) | $70,139 |
Household Income in Danville
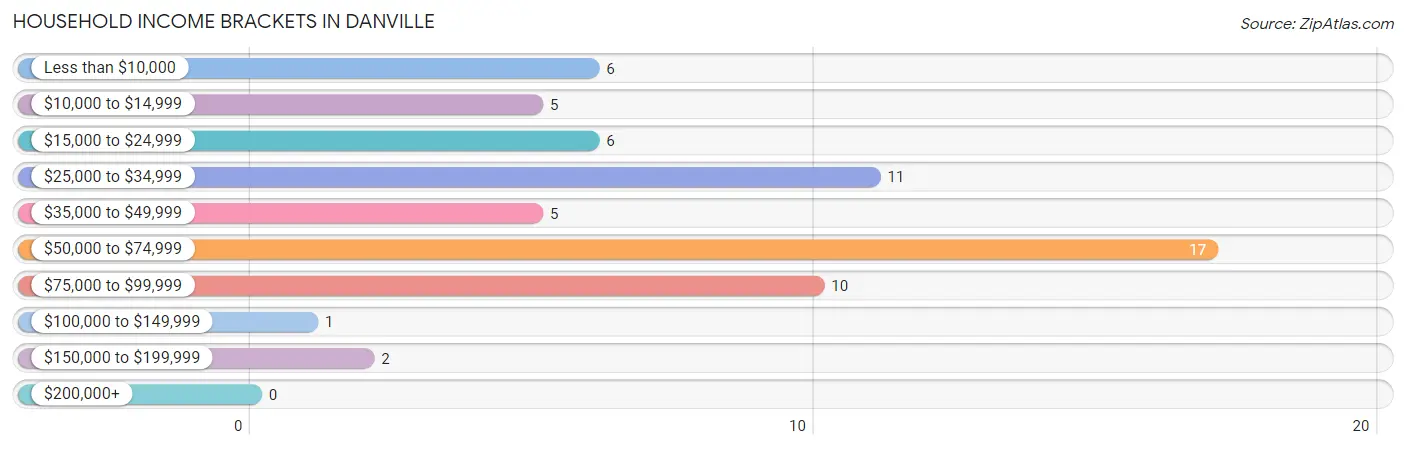
Household Income Brackets in Danville
With 17 households falling in the category, the $50,000 to $74,999 income range is the most frequent in Danville, accounting for 27.0% of all households.
| Income Bracket | # Households | % Households |
| Less than $10,000 | 6 | 9.5% |
| $10,000 to $14,999 | 5 | 7.9% |
| $15,000 to $24,999 | 6 | 9.5% |
| $25,000 to $34,999 | 11 | 17.5% |
| $35,000 to $49,999 | 5 | 7.9% |
| $50,000 to $74,999 | 17 | 27.0% |
| $75,000 to $99,999 | 10 | 15.9% |
| $100,000 to $149,999 | 1 | 1.6% |
| $150,000 to $199,999 | 2 | 3.2% |
| $200,000+ | 0 | 0.0% |
Household Income by Householder Age in Danville
| Income Bracket | # Households | Median Income |
| 15 to 24 Years | 0 (0.0%) | $0 |
| 25 to 44 Years | 13 (20.6%) | $0 |
| 45 to 64 Years | 16 (25.4%) | $0 |
| 65+ Years | 34 (54.0%) | $0 |
| Total | 63 (100.0%) | $46,750 |
Poverty in Danville
Income Below Poverty by Sex and Age in Danville
With 37.7% poverty level for males and 40.0% for females among the residents of Danville, under 5 year old males and under 5 year old females are the most vulnerable to poverty, with 5 males (100.0%) and 6 females (100.0%) in their respective age groups living below the poverty level.
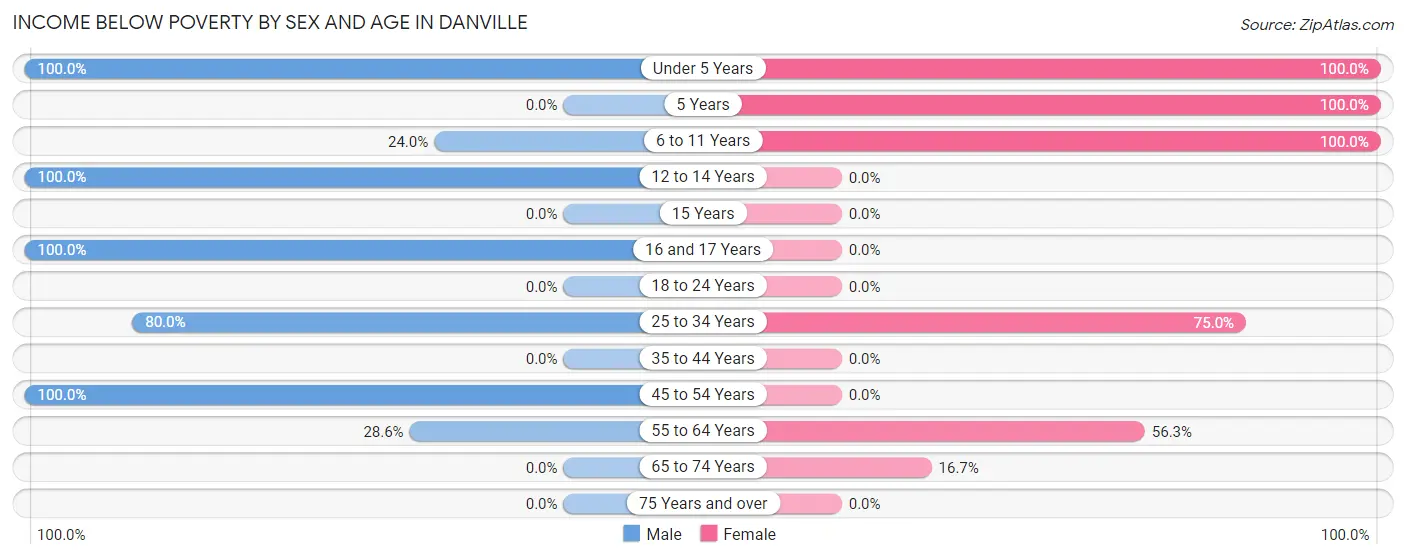
| Age Bracket | Male | Female |
| Under 5 Years | 5 (100.0%) | 6 (100.0%) |
| 5 Years | 0 (0.0%) | 2 (100.0%) |
| 6 to 11 Years | 6 (24.0%) | 4 (100.0%) |
| 12 to 14 Years | 6 (100.0%) | 0 (0.0%) |
| 15 Years | 0 (0.0%) | 0 (0.0%) |
| 16 and 17 Years | 4 (100.0%) | 0 (0.0%) |
| 18 to 24 Years | 0 (0.0%) | 0 (0.0%) |
| 25 to 34 Years | 4 (80.0%) | 6 (75.0%) |
| 35 to 44 Years | 0 (0.0%) | 0 (0.0%) |
| 45 to 54 Years | 9 (100.0%) | 0 (0.0%) |
| 55 to 64 Years | 6 (28.6%) | 9 (56.2%) |
| 65 to 74 Years | 0 (0.0%) | 5 (16.7%) |
| 75 Years and over | 0 (0.0%) | 0 (0.0%) |
| Total | 40 (37.7%) | 32 (40.0%) |
Income Above Poverty by Sex and Age in Danville
According to the poverty statistics in Danville, males aged 18 to 24 years and females aged 18 to 24 years are the age groups that are most secure financially, with 100.0% of males and 100.0% of females in these age groups living above the poverty line.
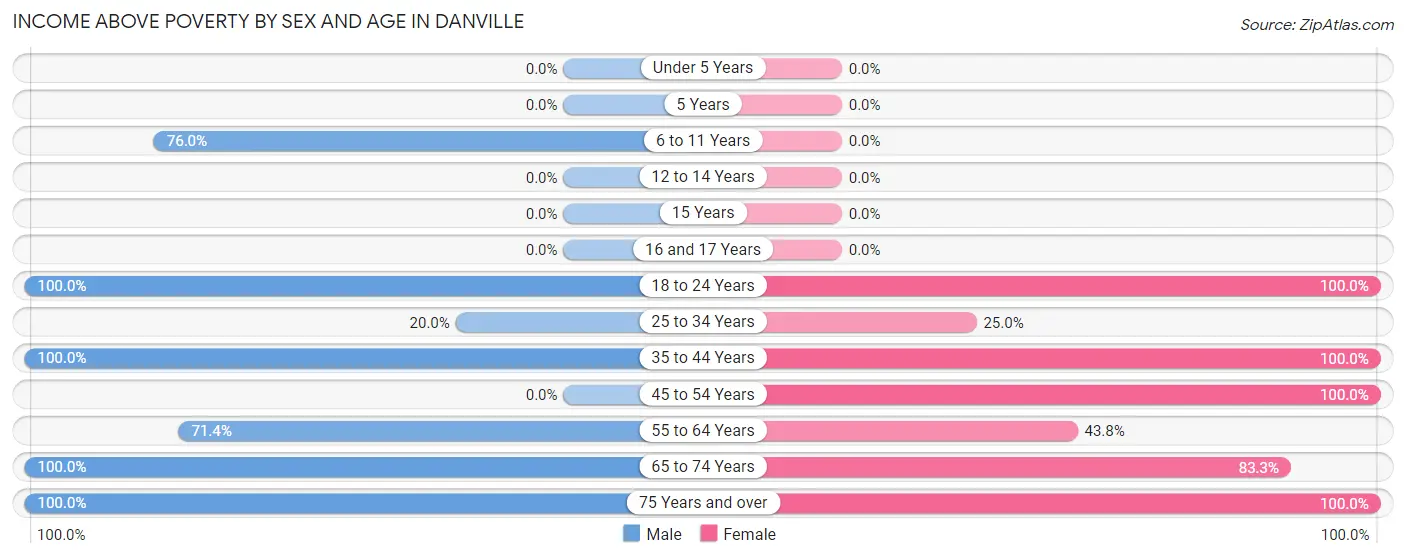
| Age Bracket | Male | Female |
| Under 5 Years | 0 (0.0%) | 0 (0.0%) |
| 5 Years | 0 (0.0%) | 0 (0.0%) |
| 6 to 11 Years | 19 (76.0%) | 0 (0.0%) |
| 12 to 14 Years | 0 (0.0%) | 0 (0.0%) |
| 15 Years | 0 (0.0%) | 0 (0.0%) |
| 16 and 17 Years | 0 (0.0%) | 0 (0.0%) |
| 18 to 24 Years | 2 (100.0%) | 1 (100.0%) |
| 25 to 34 Years | 1 (20.0%) | 2 (25.0%) |
| 35 to 44 Years | 14 (100.0%) | 4 (100.0%) |
| 45 to 54 Years | 0 (0.0%) | 2 (100.0%) |
| 55 to 64 Years | 15 (71.4%) | 7 (43.8%) |
| 65 to 74 Years | 14 (100.0%) | 25 (83.3%) |
| 75 Years and over | 1 (100.0%) | 7 (100.0%) |
| Total | 66 (62.3%) | 48 (60.0%) |
Income Below Poverty Among Married-Couple Families in Danville
The poverty statistics for married-couple families in Danville show that 18.2% or 4 of the total 22 families live below the poverty line. Families with 3 or 4 children have the highest poverty rate of 100.0%, comprising of 4 families. On the other hand, families with no children have the lowest poverty rate of 0.0%, which includes 0 families.
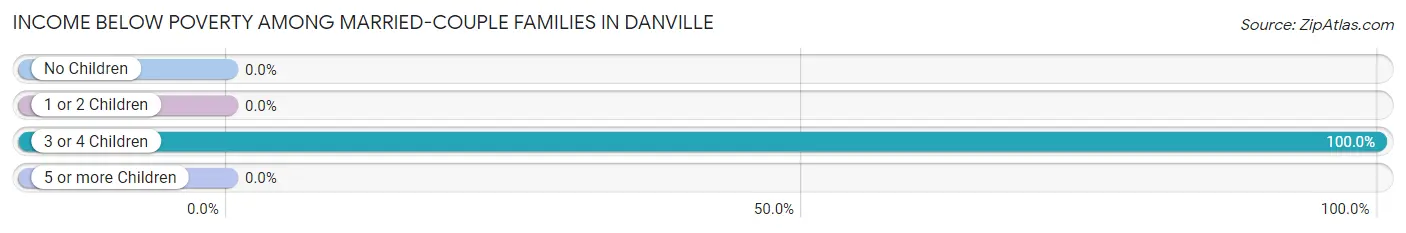
| Children | Above Poverty | Below Poverty |
| No Children | 11 (100.0%) | 0 (0.0%) |
| 1 or 2 Children | 7 (100.0%) | 0 (0.0%) |
| 3 or 4 Children | 0 (0.0%) | 4 (100.0%) |
| 5 or more Children | 0 (0.0%) | 0 (0.0%) |
| Total | 18 (81.8%) | 4 (18.2%) |
Income Below Poverty Among Single-Parent Households in Danville
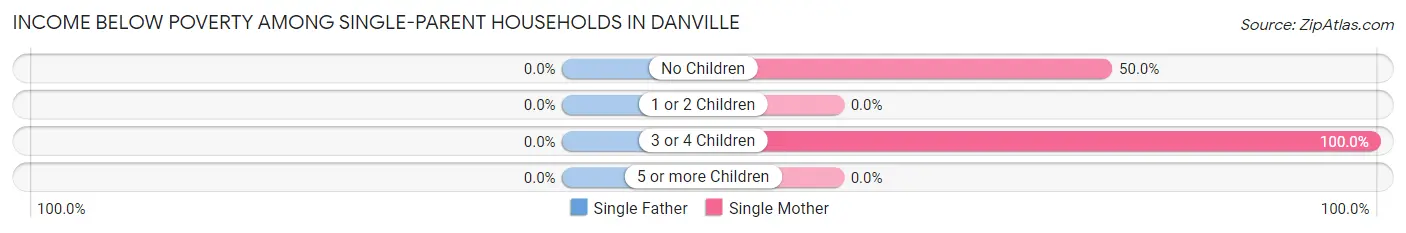
| Children | Single Father | Single Mother |
| No Children | 0 (0.0%) | 5 (50.0%) |
| 1 or 2 Children | 0 (0.0%) | 0 (0.0%) |
| 3 or 4 Children | 0 (0.0%) | 3 (100.0%) |
| 5 or more Children | 0 (0.0%) | 0 (0.0%) |
| Total | 0 (0.0%) | 8 (61.5%) |
Income Below Poverty Among Married-Couple vs Single-Parent Households in Danville
The poverty data for Danville shows that 4 of the married-couple family households (18.2%) and 8 of the single-parent households (61.5%) are living below the poverty level. Within the married-couple family households, those with 3 or 4 children have the highest poverty rate, with 4 households (100.0%) falling below the poverty line. Among the single-parent households, those with 3 or 4 children have the highest poverty rate, with 3 household (100.0%) living below poverty.
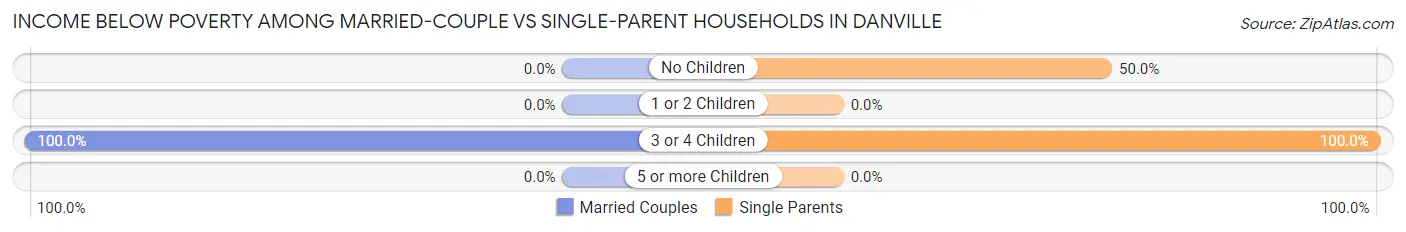
| Children | Married-Couple Families | Single-Parent Households |
| No Children | 0 (0.0%) | 5 (50.0%) |
| 1 or 2 Children | 0 (0.0%) | 0 (0.0%) |
| 3 or 4 Children | 4 (100.0%) | 3 (100.0%) |
| 5 or more Children | 0 (0.0%) | 0 (0.0%) |
| Total | 4 (18.2%) | 8 (61.5%) |
Race in Danville
The most populous races in Danville are White / Caucasian (98 | 52.7%), and Black / African American (88 | 47.3%).
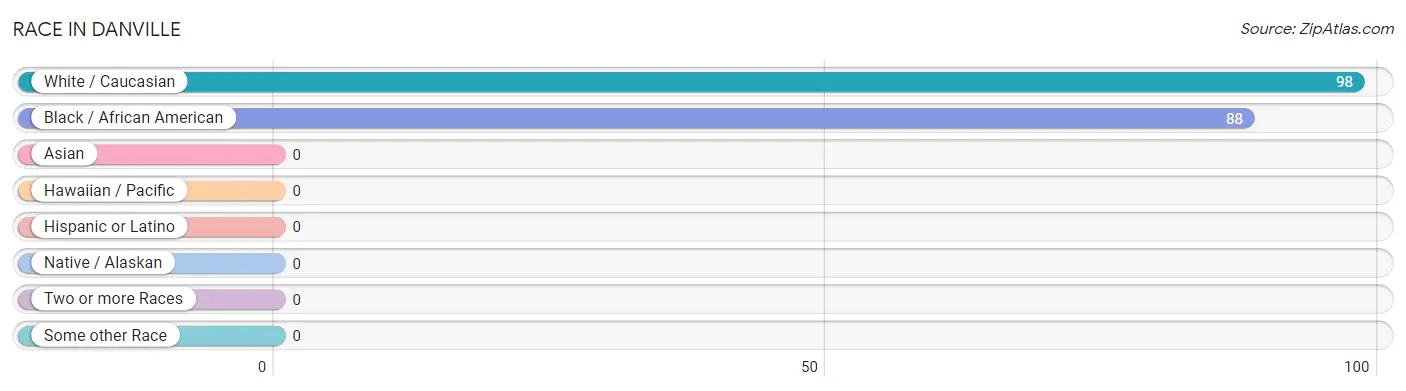
| Race | # Population | % Population |
| Asian | 0 | 0.0% |
| Black / African American | 88 | 47.3% |
| Hawaiian / Pacific | 0 | 0.0% |
| Hispanic or Latino | 0 | 0.0% |
| Native / Alaskan | 0 | 0.0% |
| White / Caucasian | 98 | 52.7% |
| Two or more Races | 0 | 0.0% |
| Some other Race | 0 | 0.0% |
| Total | 186 | 100.0% |
Ancestry in Danville
The most populous ancestries reported in Danville are American (17 | 9.1%), German (7 | 3.8%), English (6 | 3.2%), French (6 | 3.2%), and Eastern European (1 | 0.5%), together accounting for 19.9% of all Danville residents.
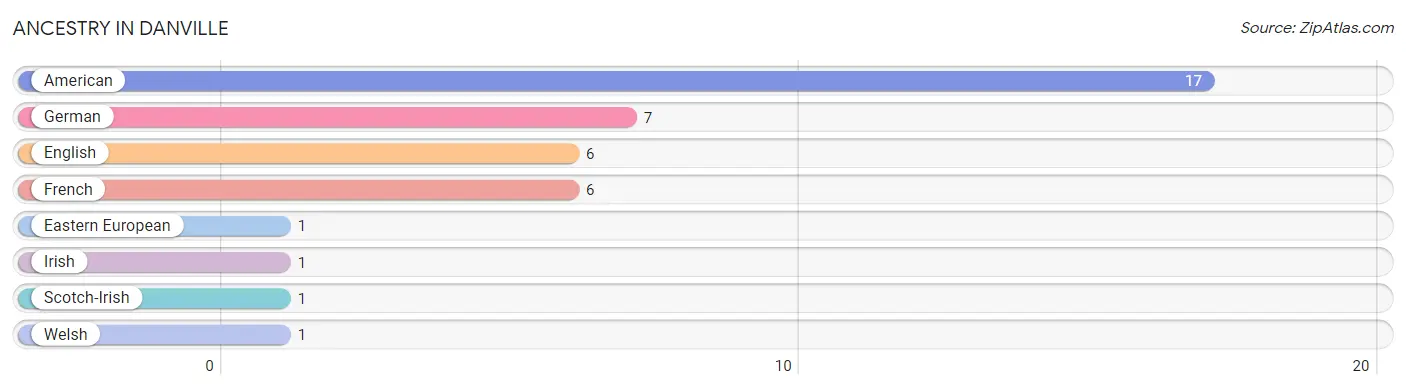
| Ancestry | # Population | % Population |
| American | 17 | 9.1% |
| Eastern European | 1 | 0.5% |
| English | 6 | 3.2% |
| French | 6 | 3.2% |
| German | 7 | 3.8% |
| Irish | 1 | 0.5% |
| Scotch-Irish | 1 | 0.5% |
| Welsh | 1 | 0.5% | View All 8 Rows |
Immigrants in Danville

| Immigration Origin | # Population | % Population | View All 0 Rows |
Sex and Age in Danville
Sex and Age in Danville
The most populous age groups in Danville are 10 to 14 Years (16 | 15.1%) for men and 70 to 74 Years (17 | 21.2%) for women.
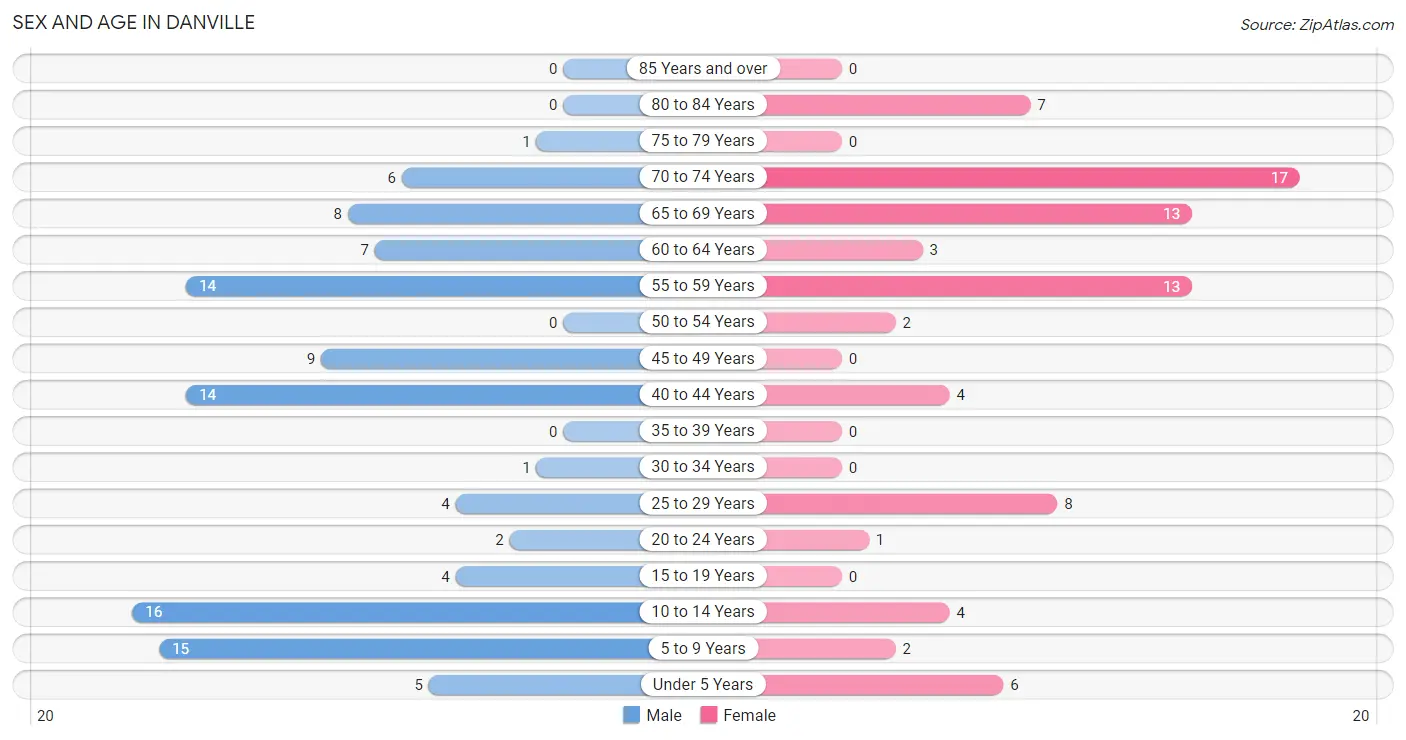
| Age Bracket | Male | Female |
| Under 5 Years | 5 (4.7%) | 6 (7.5%) |
| 5 to 9 Years | 15 (14.1%) | 2 (2.5%) |
| 10 to 14 Years | 16 (15.1%) | 4 (5.0%) |
| 15 to 19 Years | 4 (3.8%) | 0 (0.0%) |
| 20 to 24 Years | 2 (1.9%) | 1 (1.3%) |
| 25 to 29 Years | 4 (3.8%) | 8 (10.0%) |
| 30 to 34 Years | 1 (0.9%) | 0 (0.0%) |
| 35 to 39 Years | 0 (0.0%) | 0 (0.0%) |
| 40 to 44 Years | 14 (13.2%) | 4 (5.0%) |
| 45 to 49 Years | 9 (8.5%) | 0 (0.0%) |
| 50 to 54 Years | 0 (0.0%) | 2 (2.5%) |
| 55 to 59 Years | 14 (13.2%) | 13 (16.3%) |
| 60 to 64 Years | 7 (6.6%) | 3 (3.7%) |
| 65 to 69 Years | 8 (7.5%) | 13 (16.3%) |
| 70 to 74 Years | 6 (5.7%) | 17 (21.2%) |
| 75 to 79 Years | 1 (0.9%) | 0 (0.0%) |
| 80 to 84 Years | 0 (0.0%) | 7 (8.7%) |
| 85 Years and over | 0 (0.0%) | 0 (0.0%) |
| Total | 106 (100.0%) | 80 (100.0%) |
Families and Households in Danville
Median Family Size in Danville
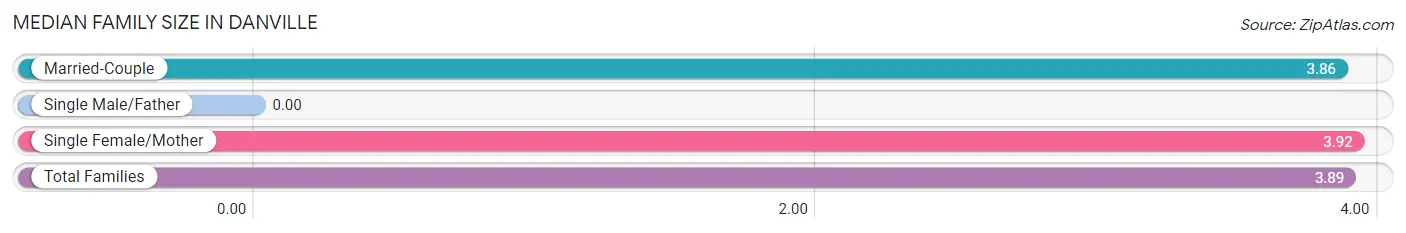
| Family Type | # Families | Family Size |
| Married-Couple | 22 (62.9%) | 3.86 |
| Single Male/Father | 0 (0.0%) | - |
| Single Female/Mother | 13 (37.1%) | 3.92 |
| Total Families | 35 (100.0%) | 3.89 |
Median Household Size in Danville
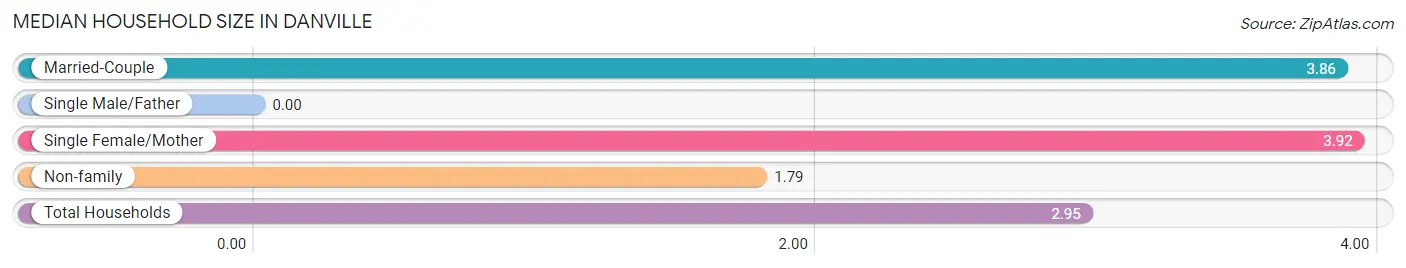
| Household Type | # Households | Household Size |
| Married-Couple | 22 (34.9%) | 3.86 |
| Single Male/Father | 0 (0.0%) | - |
| Single Female/Mother | 13 (20.6%) | 3.92 |
| Non-family | 28 (44.4%) | 1.79 |
| Total Households | 63 (100.0%) | 2.95 |
Household Size by Marriage Status in Danville
Out of a total of 63 households in Danville, 35 (55.6%) are family households, while 28 (44.4%) are nonfamily households. The most numerous type of family households are 3-person households, comprising 11, and the most common type of nonfamily households are 1-person households, comprising 15.
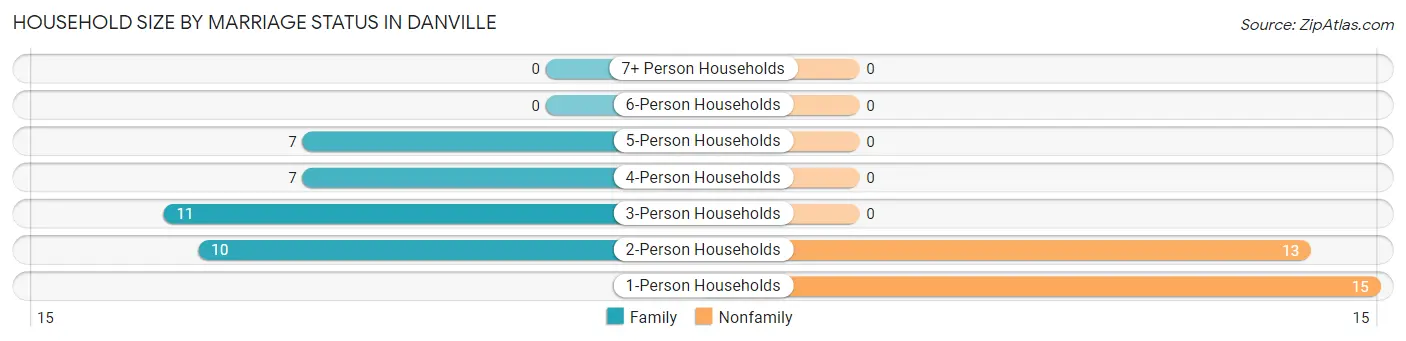
| Household Size | Family Households | Nonfamily Households |
| 1-Person Households | - | 15 (23.8%) |
| 2-Person Households | 10 (15.9%) | 13 (20.6%) |
| 3-Person Households | 11 (17.5%) | 0 (0.0%) |
| 4-Person Households | 7 (11.1%) | 0 (0.0%) |
| 5-Person Households | 7 (11.1%) | 0 (0.0%) |
| 6-Person Households | 0 (0.0%) | 0 (0.0%) |
| 7+ Person Households | 0 (0.0%) | 0 (0.0%) |
| Total | 35 (55.6%) | 28 (44.4%) |
Female Fertility in Danville
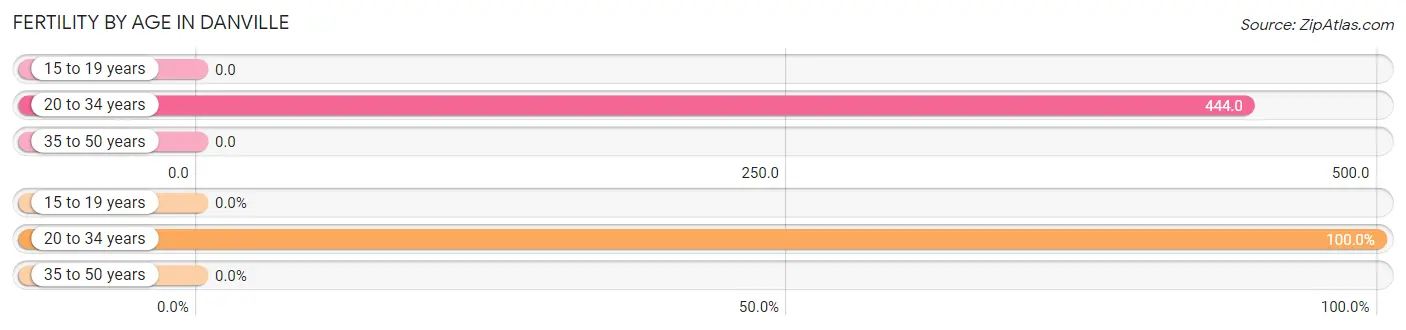
Fertility by Age in Danville
Average fertility rate in Danville is 308.0 births per 1,000 women. Women in the age bracket of 20 to 34 years have the highest fertility rate with 444.0 births per 1,000 women. Women in the age bracket of 20 to 34 years acount for 100.0% of all women with births.
| Age Bracket | Women with Births | Births / 1,000 Women |
| 15 to 19 years | 0 (0.0%) | 0.0 |
| 20 to 34 years | 4 (100.0%) | 444.0 |
| 35 to 50 years | 0 (0.0%) | 0.0 |
| Total | 4 (100.0%) | 308.0 |
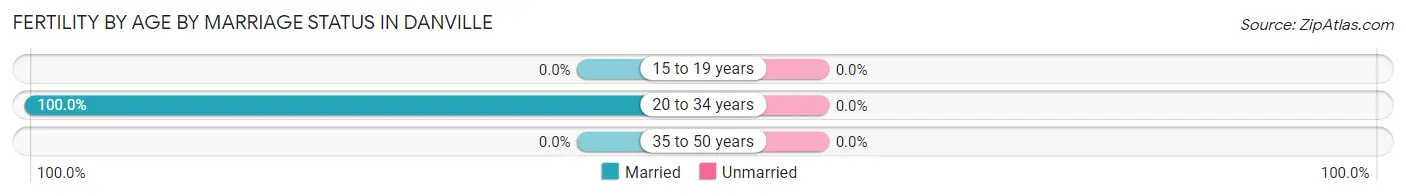
Fertility by Age by Marriage Status in Danville
| Age Bracket | Married | Unmarried |
| 15 to 19 years | 0 (0.0%) | 0 (0.0%) |
| 20 to 34 years | 4 (100.0%) | 0 (0.0%) |
| 35 to 50 years | 0 (0.0%) | 0 (0.0%) |
| Total | 4 (100.0%) | 0 (0.0%) |
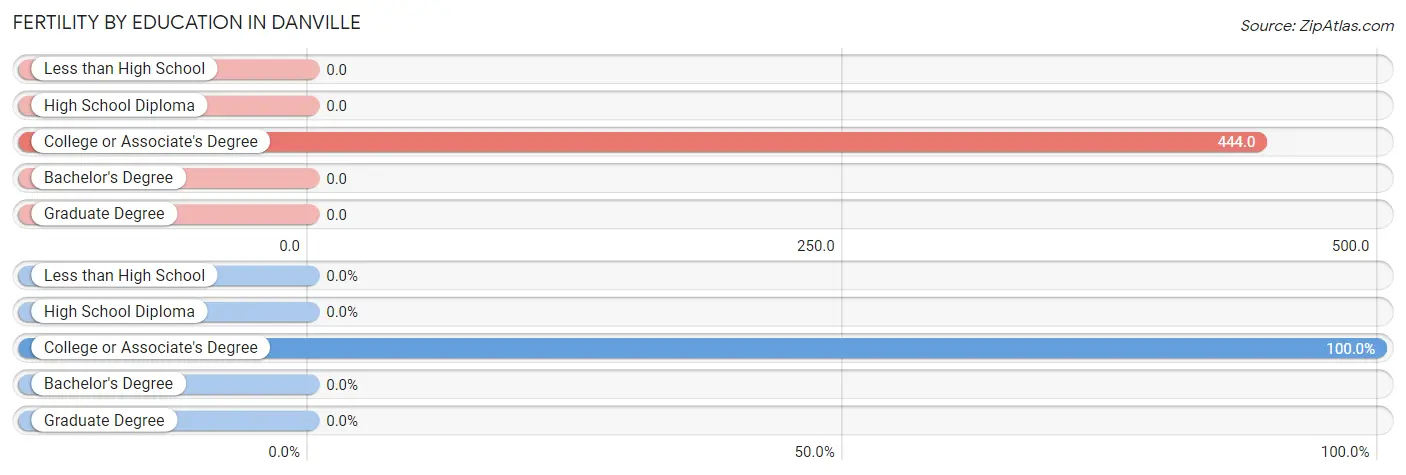
Fertility by Education in Danville
| Educational Attainment | Women with Births | Births / 1,000 Women |
| Less than High School | 0 (0.0%) | 0.0 |
| High School Diploma | 0 (0.0%) | 0.0 |
| College or Associate's Degree | 4 (100.0%) | 444.0 |
| Bachelor's Degree | 0 (0.0%) | 0.0 |
| Graduate Degree | 0 (0.0%) | 0.0 |
| Total | 4 (100.0%) | 308.0 |
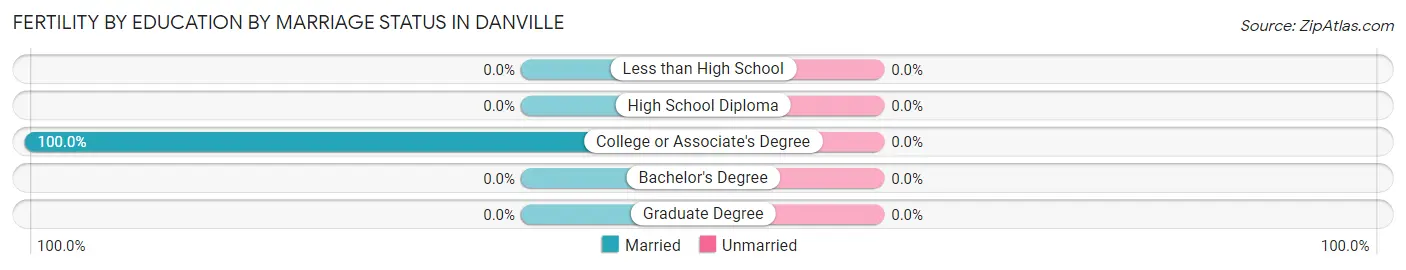
Fertility by Education by Marriage Status in Danville
| Educational Attainment | Married | Unmarried |
| Less than High School | 0 (0.0%) | 0 (0.0%) |
| High School Diploma | 0 (0.0%) | 0 (0.0%) |
| College or Associate's Degree | 4 (100.0%) | 0 (0.0%) |
| Bachelor's Degree | 0 (0.0%) | 0 (0.0%) |
| Graduate Degree | 0 (0.0%) | 0 (0.0%) |
| Total | 4 (100.0%) | 0 (0.0%) |
Employment Characteristics in Danville
Employment by Class of Employer in Danville
Among the 42 employed individuals in Danville, private company employees (35 | 83.3%), local government employees (5 | 11.9%), and self-employed (incorporated) (2 | 4.8%) make up the most common classes of employment.
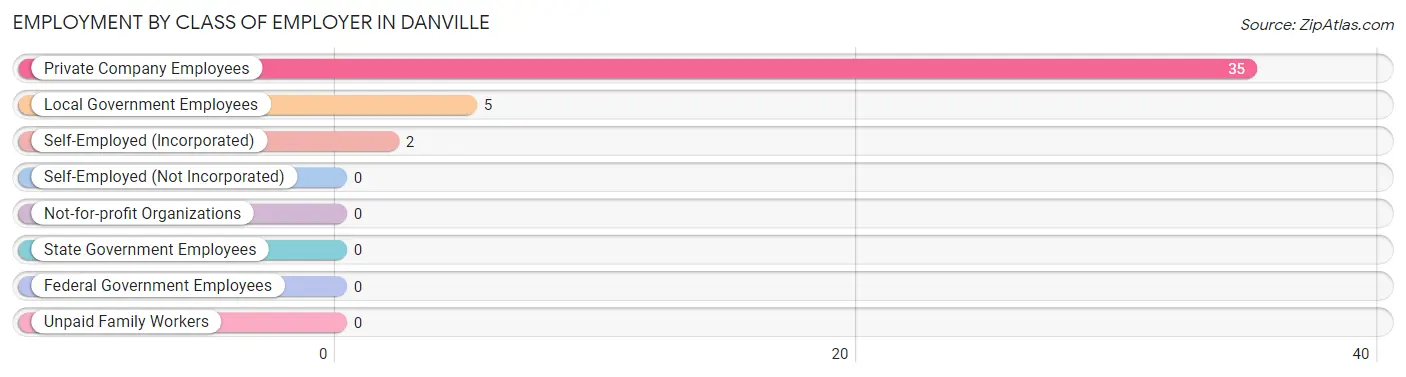
| Employer Class | # Employees | % Employees |
| Private Company Employees | 35 | 83.3% |
| Self-Employed (Incorporated) | 2 | 4.8% |
| Self-Employed (Not Incorporated) | 0 | 0.0% |
| Not-for-profit Organizations | 0 | 0.0% |
| Local Government Employees | 5 | 11.9% |
| State Government Employees | 0 | 0.0% |
| Federal Government Employees | 0 | 0.0% |
| Unpaid Family Workers | 0 | 0.0% |
| Total | 42 | 100.0% |
Employment Status by Age in Danville
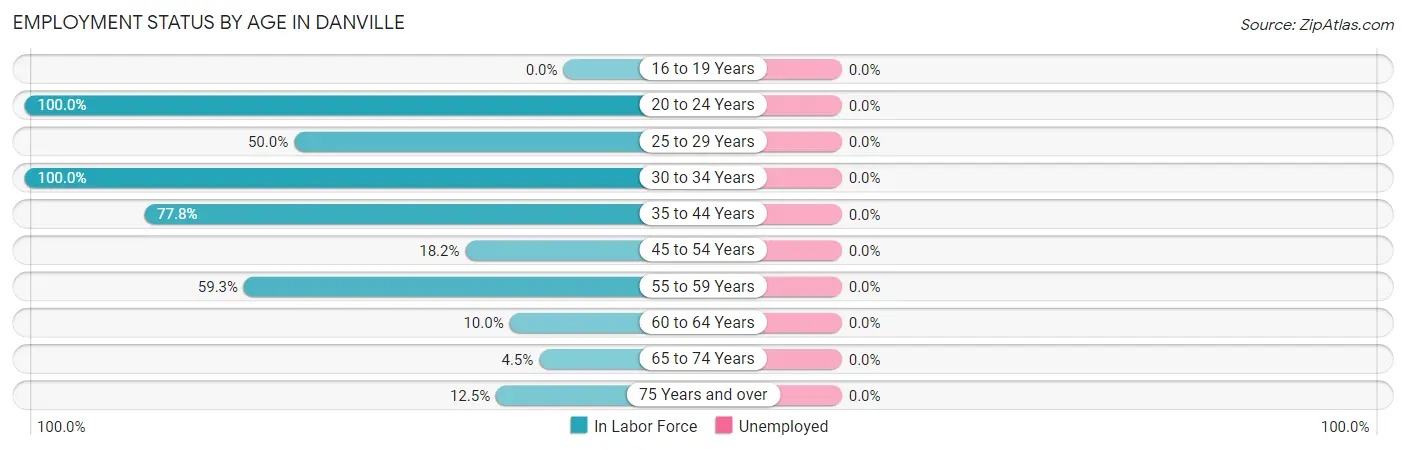
| Age Bracket | In Labor Force | Unemployed |
| 16 to 19 Years | 0 (0.0%) | 0 (0.0%) |
| 20 to 24 Years | 3 (100.0%) | 0 (0.0%) |
| 25 to 29 Years | 6 (50.0%) | 0 (0.0%) |
| 30 to 34 Years | 1 (100.0%) | 0 (0.0%) |
| 35 to 44 Years | 14 (77.8%) | 0 (0.0%) |
| 45 to 54 Years | 2 (18.2%) | 0 (0.0%) |
| 55 to 59 Years | 16 (59.3%) | 0 (0.0%) |
| 60 to 64 Years | 1 (10.0%) | 0 (0.0%) |
| 65 to 74 Years | 2 (4.5%) | 0 (0.0%) |
| 75 Years and over | 1 (12.5%) | 0 (0.0%) |
| Total | 46 (33.3%) | 0 (0.0%) |
Employment Status by Educational Attainment in Danville
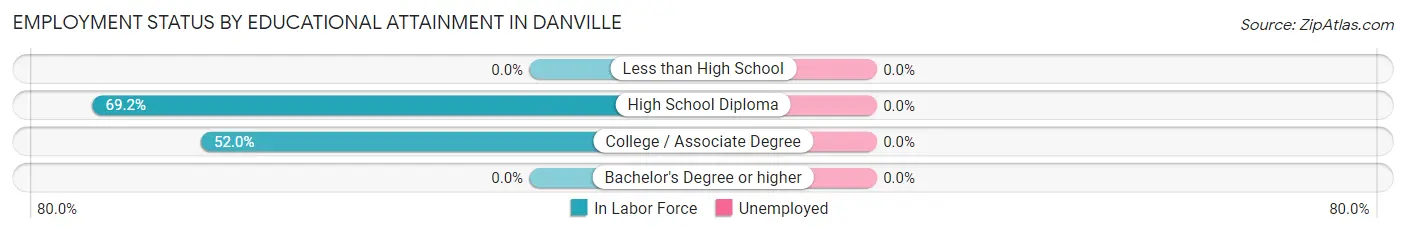
| Educational Attainment | In Labor Force | Unemployed |
| Less than High School | 0 (0.0%) | 0 (0.0%) |
| High School Diploma | 27 (69.2%) | 0 (0.0%) |
| College / Associate Degree | 13 (52.0%) | 0 (0.0%) |
| Bachelor's Degree or higher | 0 (0.0%) | 0 (0.0%) |
| Total | 40 (50.6%) | 0 (0.0%) |
Employment Occupations by Sex in Danville
Management, Business, Science and Arts Occupations
The most common Management, Business, Science and Arts occupations in Danville are Community & Social Service (6 | 13.0%), Education Instruction & Library (4 | 8.7%), Management (2 | 4.3%), and Legal Services & Support (2 | 4.3%).
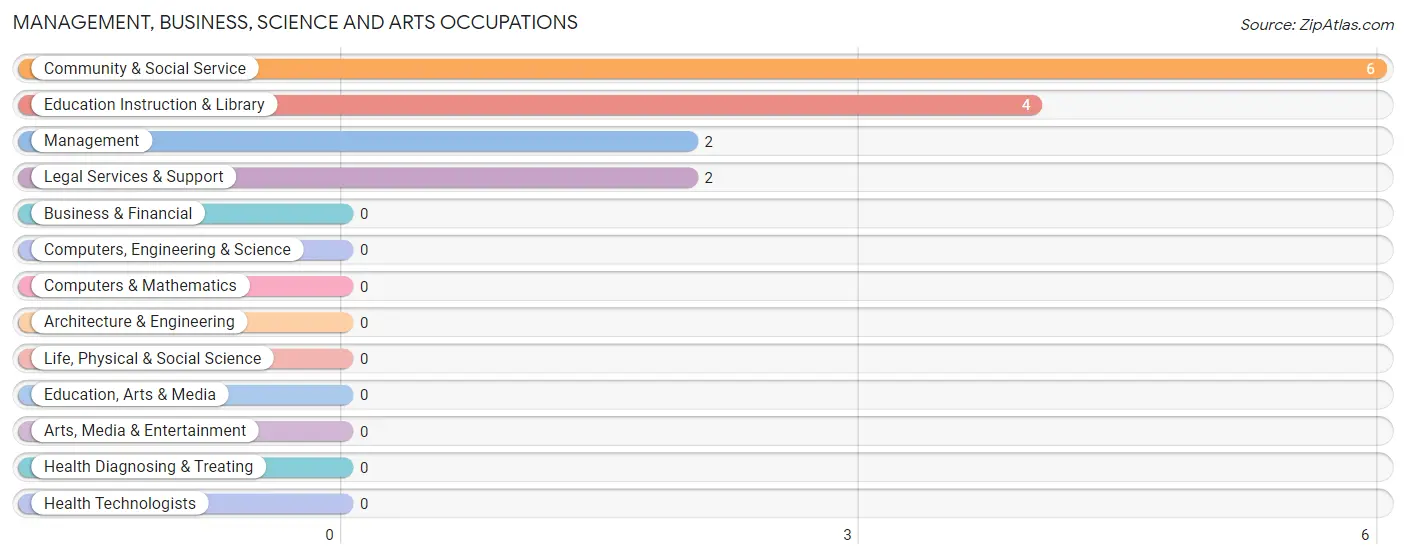
Management, Business, Science and Arts Occupations by Sex
Within the Management, Business, Science and Arts occupations in Danville, the most male-oriented occupations are Management (100.0%), Legal Services & Support (100.0%), and Community & Social Service (33.3%), while the most female-oriented occupations are Education Instruction & Library (100.0%), and Community & Social Service (66.7%).
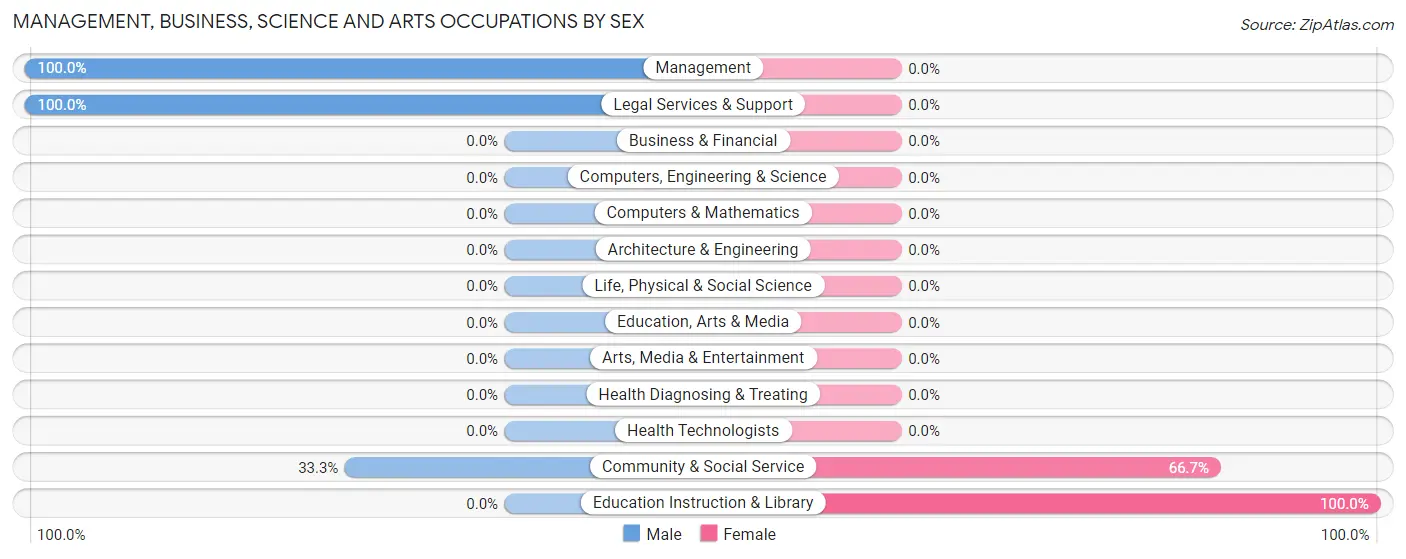
| Occupation | Male | Female |
| Management | 2 (100.0%) | 0 (0.0%) |
| Business & Financial | 0 (0.0%) | 0 (0.0%) |
| Computers, Engineering & Science | 0 (0.0%) | 0 (0.0%) |
| Computers & Mathematics | 0 (0.0%) | 0 (0.0%) |
| Architecture & Engineering | 0 (0.0%) | 0 (0.0%) |
| Life, Physical & Social Science | 0 (0.0%) | 0 (0.0%) |
| Community & Social Service | 2 (33.3%) | 4 (66.7%) |
| Education, Arts & Media | 0 (0.0%) | 0 (0.0%) |
| Legal Services & Support | 2 (100.0%) | 0 (0.0%) |
| Education Instruction & Library | 0 (0.0%) | 4 (100.0%) |
| Arts, Media & Entertainment | 0 (0.0%) | 0 (0.0%) |
| Health Diagnosing & Treating | 0 (0.0%) | 0 (0.0%) |
| Health Technologists | 0 (0.0%) | 0 (0.0%) |
| Total (Category) | 4 (50.0%) | 4 (50.0%) |
| Total (Overall) | 39 (84.8%) | 7 (15.2%) |
Services Occupations
Services Occupations by Sex
| Occupation | Male | Female |
| Healthcare Support | 0 (0.0%) | 0 (0.0%) |
| Security & Protection | 0 (0.0%) | 0 (0.0%) |
| Firefighting & Prevention | 0 (0.0%) | 0 (0.0%) |
| Law Enforcement | 0 (0.0%) | 0 (0.0%) |
| Food Preparation & Serving | 0 (0.0%) | 0 (0.0%) |
| Cleaning & Maintenance | 0 (0.0%) | 0 (0.0%) |
| Personal Care & Service | 0 (0.0%) | 0 (0.0%) |
| Total (Category) | 0 (0.0%) | 0 (0.0%) |
| Total (Overall) | 39 (84.8%) | 7 (15.2%) |
Sales and Office Occupations
The most common Sales and Office occupations in Danville are , and Office & Administration (3 | 6.5%).
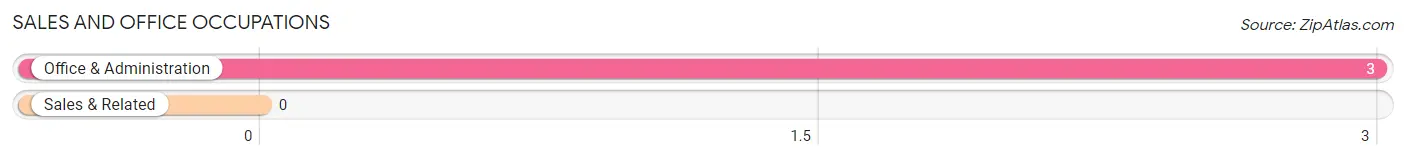
Sales and Office Occupations by Sex
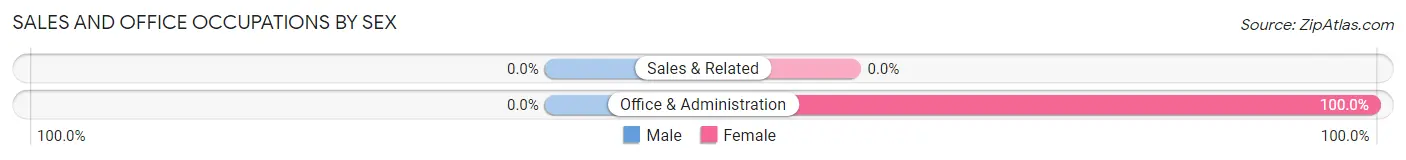
| Occupation | Male | Female |
| Sales & Related | 0 (0.0%) | 0 (0.0%) |
| Office & Administration | 0 (0.0%) | 3 (100.0%) |
| Total (Category) | 0 (0.0%) | 3 (100.0%) |
| Total (Overall) | 39 (84.8%) | 7 (15.2%) |
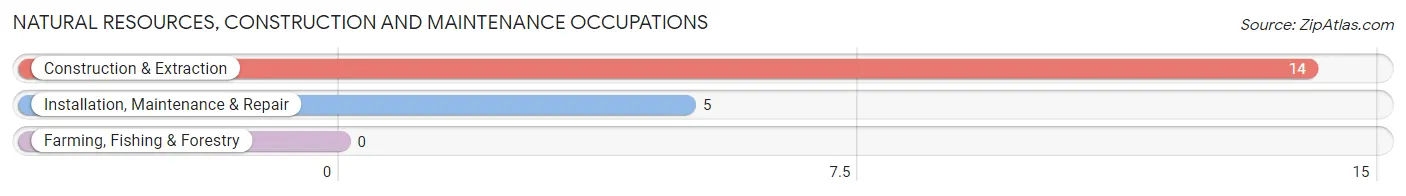
Natural Resources, Construction and Maintenance Occupations
The most common Natural Resources, Construction and Maintenance occupations in Danville are Construction & Extraction (14 | 30.4%), and Installation, Maintenance & Repair (5 | 10.9%).
Natural Resources, Construction and Maintenance Occupations by Sex
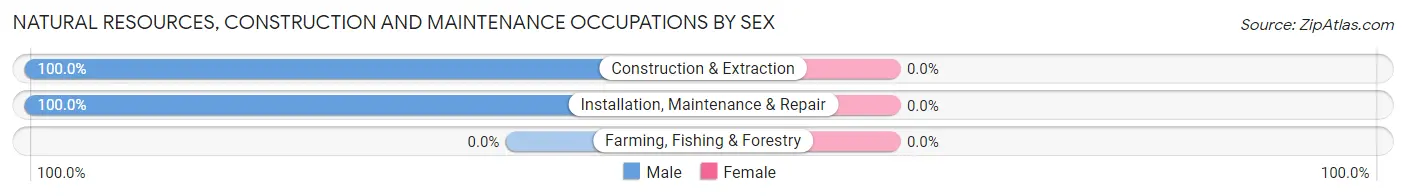
| Occupation | Male | Female |
| Farming, Fishing & Forestry | 0 (0.0%) | 0 (0.0%) |
| Construction & Extraction | 14 (100.0%) | 0 (0.0%) |
| Installation, Maintenance & Repair | 5 (100.0%) | 0 (0.0%) |
| Total (Category) | 19 (100.0%) | 0 (0.0%) |
| Total (Overall) | 39 (84.8%) | 7 (15.2%) |
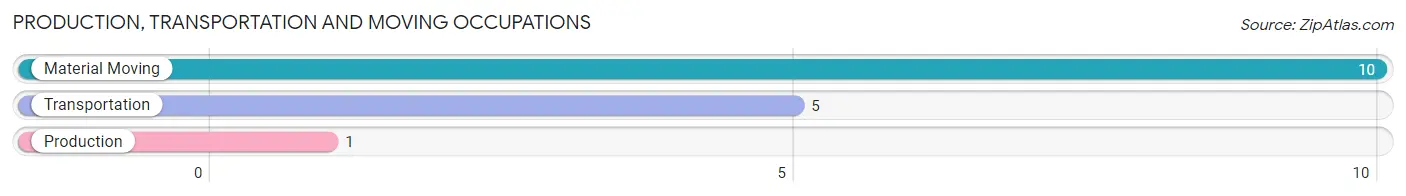
Production, Transportation and Moving Occupations
The most common Production, Transportation and Moving occupations in Danville are Material Moving (10 | 21.7%), Transportation (5 | 10.9%), and Production (1 | 2.2%).
Production, Transportation and Moving Occupations by Sex
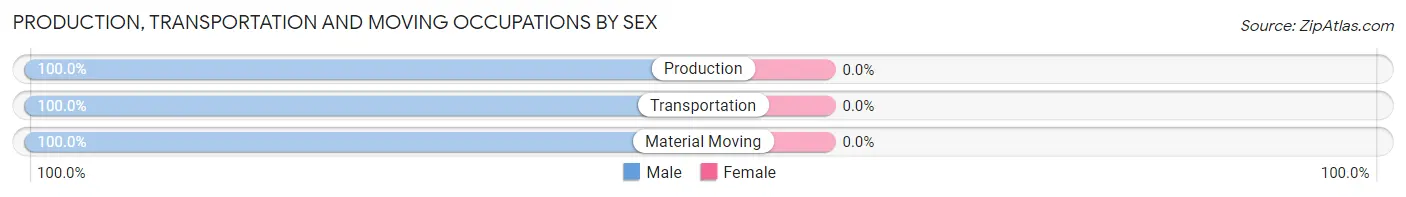
| Occupation | Male | Female |
| Production | 1 (100.0%) | 0 (0.0%) |
| Transportation | 5 (100.0%) | 0 (0.0%) |
| Material Moving | 10 (100.0%) | 0 (0.0%) |
| Total (Category) | 16 (100.0%) | 0 (0.0%) |
| Total (Overall) | 39 (84.8%) | 7 (15.2%) |
Employment Industries by Sex in Danville
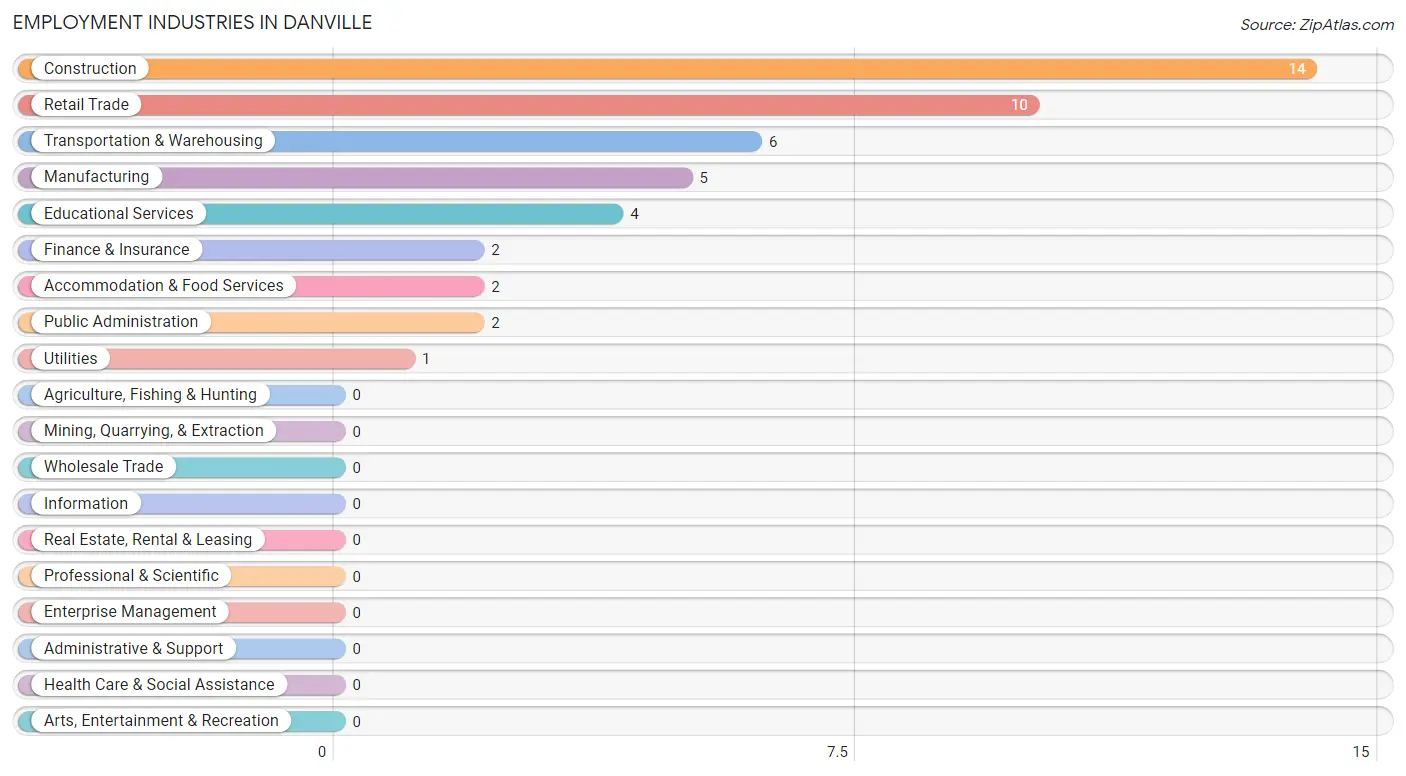
Employment Industries in Danville
The major employment industries in Danville include Construction (14 | 30.4%), Retail Trade (10 | 21.7%), Transportation & Warehousing (6 | 13.0%), Manufacturing (5 | 10.9%), and Educational Services (4 | 8.7%).
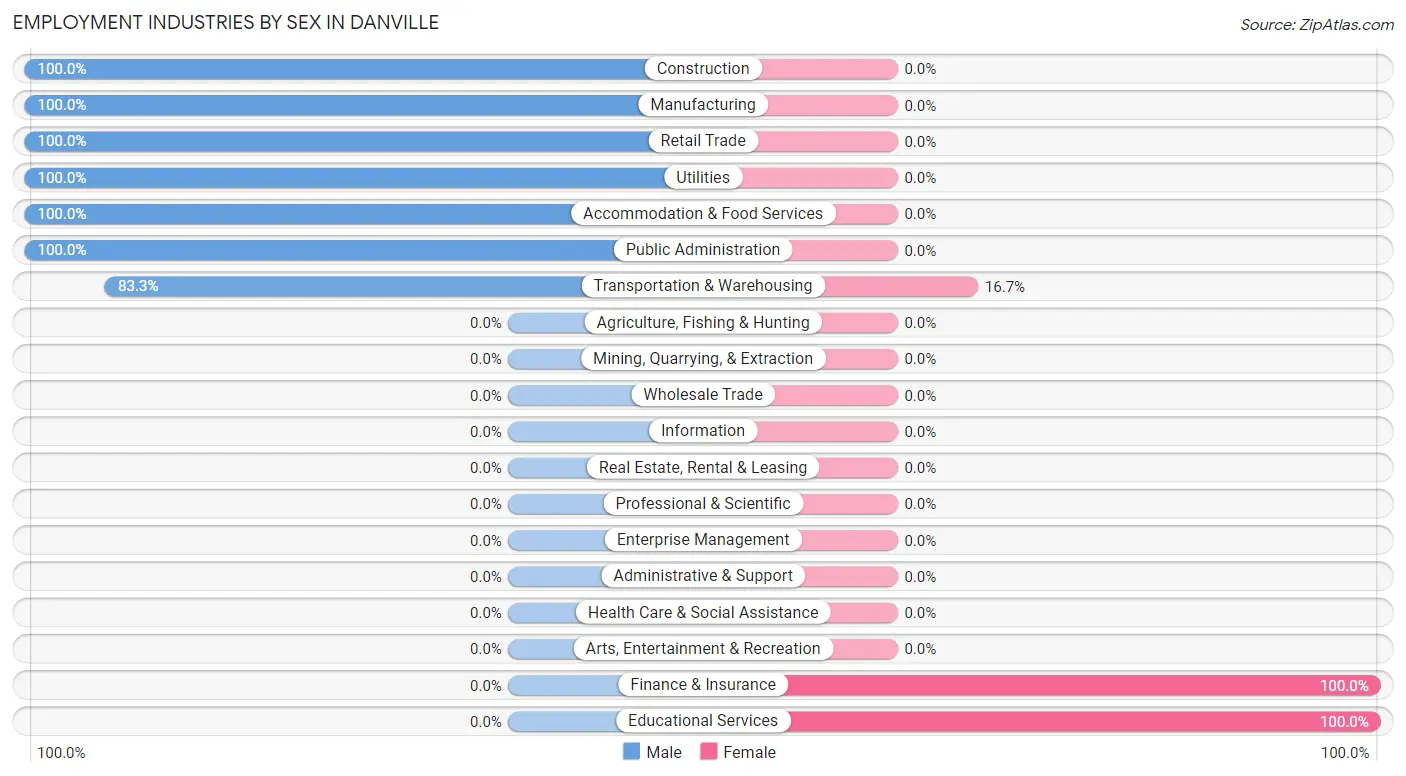
Employment Industries by Sex in Danville
The Danville industries that see more men than women are Construction (100.0%), Manufacturing (100.0%), and Retail Trade (100.0%), whereas the industries that tend to have a higher number of women are Finance & Insurance (100.0%), Educational Services (100.0%), and Transportation & Warehousing (16.7%).
| Industry | Male | Female |
| Agriculture, Fishing & Hunting | 0 (0.0%) | 0 (0.0%) |
| Mining, Quarrying, & Extraction | 0 (0.0%) | 0 (0.0%) |
| Construction | 14 (100.0%) | 0 (0.0%) |
| Manufacturing | 5 (100.0%) | 0 (0.0%) |
| Wholesale Trade | 0 (0.0%) | 0 (0.0%) |
| Retail Trade | 10 (100.0%) | 0 (0.0%) |
| Transportation & Warehousing | 5 (83.3%) | 1 (16.7%) |
| Utilities | 1 (100.0%) | 0 (0.0%) |
| Information | 0 (0.0%) | 0 (0.0%) |
| Finance & Insurance | 0 (0.0%) | 2 (100.0%) |
| Real Estate, Rental & Leasing | 0 (0.0%) | 0 (0.0%) |
| Professional & Scientific | 0 (0.0%) | 0 (0.0%) |
| Enterprise Management | 0 (0.0%) | 0 (0.0%) |
| Administrative & Support | 0 (0.0%) | 0 (0.0%) |
| Educational Services | 0 (0.0%) | 4 (100.0%) |
| Health Care & Social Assistance | 0 (0.0%) | 0 (0.0%) |
| Arts, Entertainment & Recreation | 0 (0.0%) | 0 (0.0%) |
| Accommodation & Food Services | 2 (100.0%) | 0 (0.0%) |
| Public Administration | 2 (100.0%) | 0 (0.0%) |
| Total | 39 (84.8%) | 7 (15.2%) |
Education in Danville
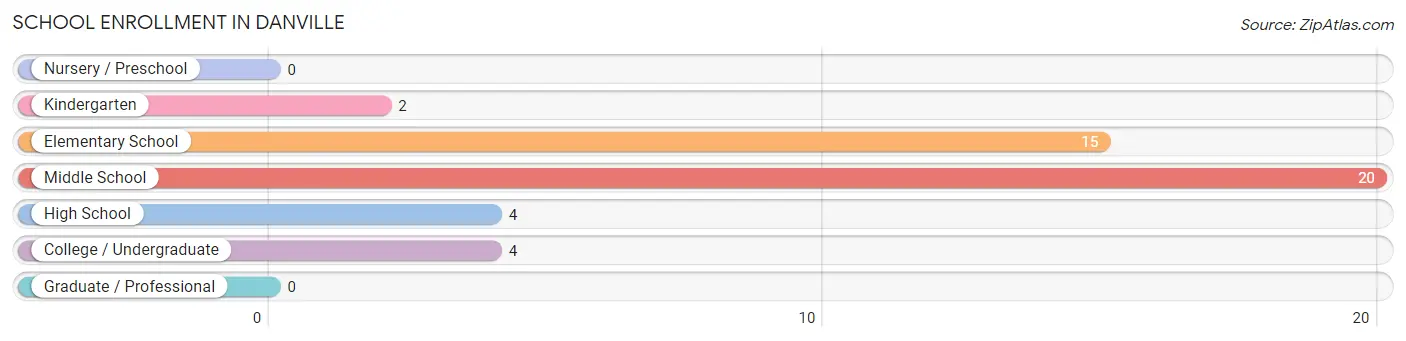
School Enrollment in Danville
The most common levels of schooling among the 45 students in Danville are middle school (20 | 44.4%), elementary school (15 | 33.3%), and high school (4 | 8.9%).
| School Level | # Students | % Students |
| Nursery / Preschool | 0 | 0.0% |
| Kindergarten | 2 | 4.4% |
| Elementary School | 15 | 33.3% |
| Middle School | 20 | 44.4% |
| High School | 4 | 8.9% |
| College / Undergraduate | 4 | 8.9% |
| Graduate / Professional | 0 | 0.0% |
| Total | 45 | 100.0% |
School Enrollment by Age by Funding Source in Danville
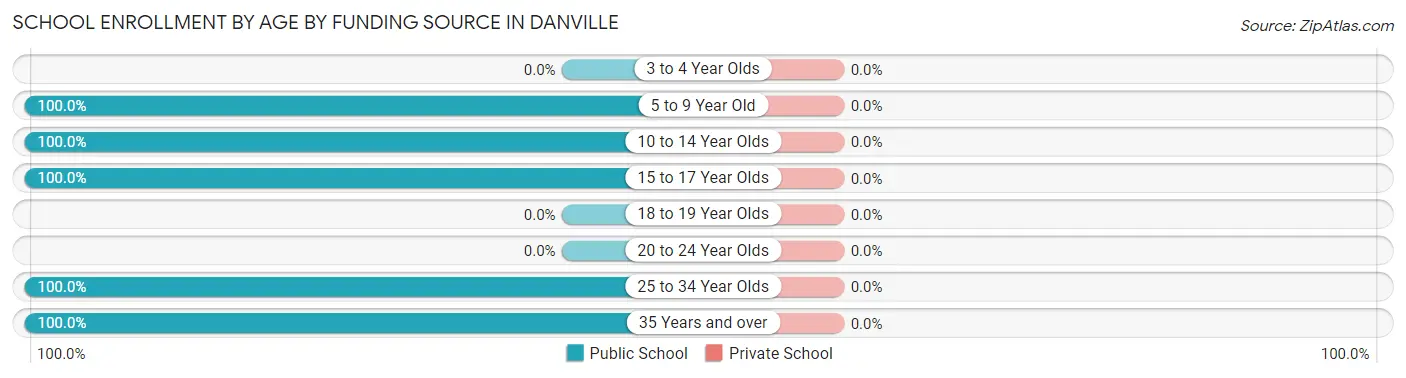
| Age Bracket | Public School | Private School |
| 3 to 4 Year Olds | 0 (0.0%) | 0 (0.0%) |
| 5 to 9 Year Old | 17 (100.0%) | 0 (0.0%) |
| 10 to 14 Year Olds | 20 (100.0%) | 0 (0.0%) |
| 15 to 17 Year Olds | 4 (100.0%) | 0 (0.0%) |
| 18 to 19 Year Olds | 0 (0.0%) | 0 (0.0%) |
| 20 to 24 Year Olds | 0 (0.0%) | 0 (0.0%) |
| 25 to 34 Year Olds | 2 (100.0%) | 0 (0.0%) |
| 35 Years and over | 2 (100.0%) | 0 (0.0%) |
| Total | 45 (100.0%) | 0 (0.0%) |
Educational Attainment by Field of Study in Danville
, and education (7 | 100.0%) are the most common fields of study among 7 individuals in Danville who have obtained a bachelor's degree or higher.
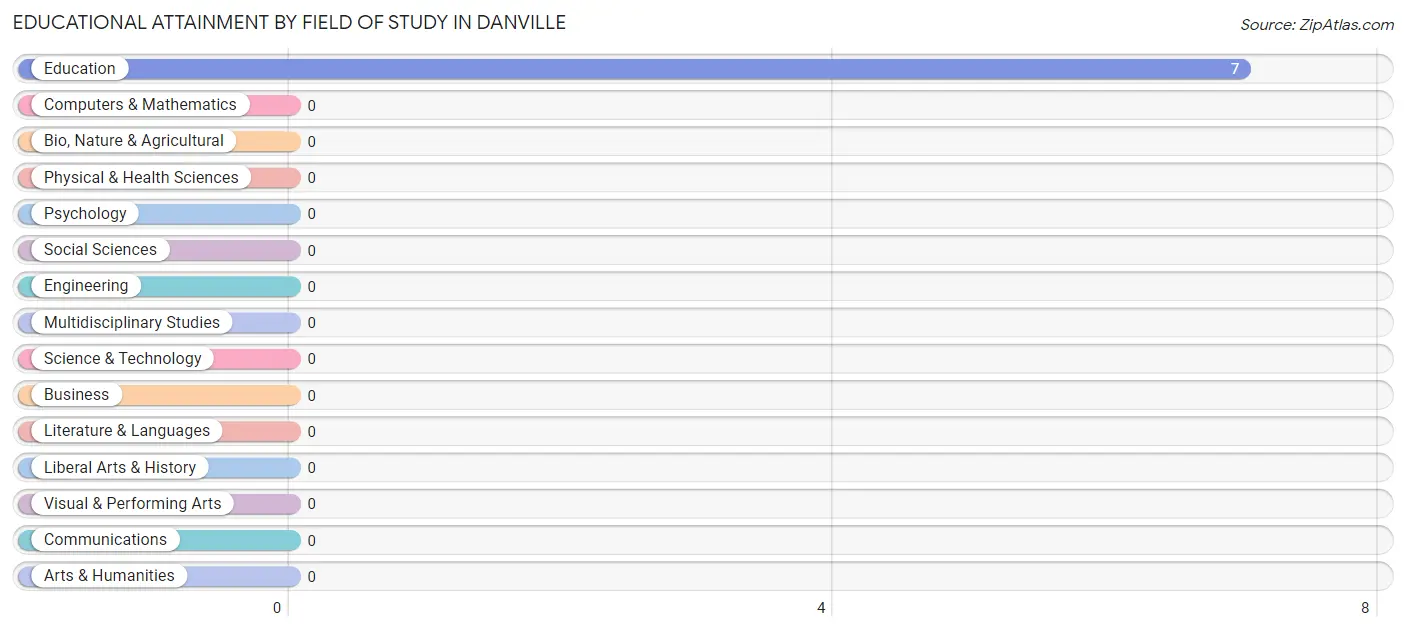
| Field of Study | # Graduates | % Graduates |
| Computers & Mathematics | 0 | 0.0% |
| Bio, Nature & Agricultural | 0 | 0.0% |
| Physical & Health Sciences | 0 | 0.0% |
| Psychology | 0 | 0.0% |
| Social Sciences | 0 | 0.0% |
| Engineering | 0 | 0.0% |
| Multidisciplinary Studies | 0 | 0.0% |
| Science & Technology | 0 | 0.0% |
| Business | 0 | 0.0% |
| Education | 7 | 100.0% |
| Literature & Languages | 0 | 0.0% |
| Liberal Arts & History | 0 | 0.0% |
| Visual & Performing Arts | 0 | 0.0% |
| Communications | 0 | 0.0% |
| Arts & Humanities | 0 | 0.0% |
| Total | 7 | 100.0% |
Transportation & Commute in Danville
Vehicle Availability by Sex in Danville
The most prevalent vehicle ownership categories in Danville are males with 1 vehicle (18, accounting for 51.4%) and females with 1 vehicle (0, making up 257.1%).
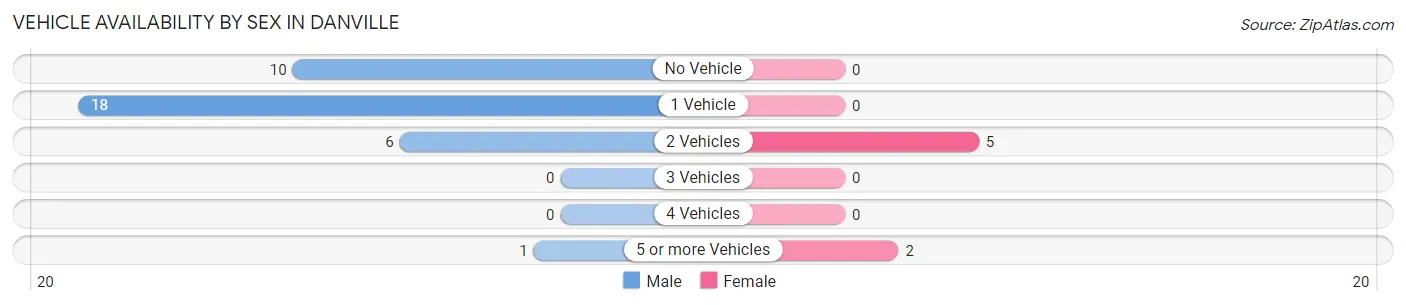
| Vehicles Available | Male | Female |
| No Vehicle | 10 (28.6%) | 0 (0.0%) |
| 1 Vehicle | 18 (51.4%) | 0 (0.0%) |
| 2 Vehicles | 6 (17.1%) | 5 (71.4%) |
| 3 Vehicles | 0 (0.0%) | 0 (0.0%) |
| 4 Vehicles | 0 (0.0%) | 0 (0.0%) |
| 5 or more Vehicles | 1 (2.9%) | 2 (28.6%) |
| Total | 35 (100.0%) | 7 (100.0%) |
Commute Time in Danville
The most frequently occuring commute durations in Danville are 35 to 39 minutes (14 commuters, 33.3%), 45 to 59 minutes (10 commuters, 23.8%), and 30 to 34 minutes (6 commuters, 14.3%).
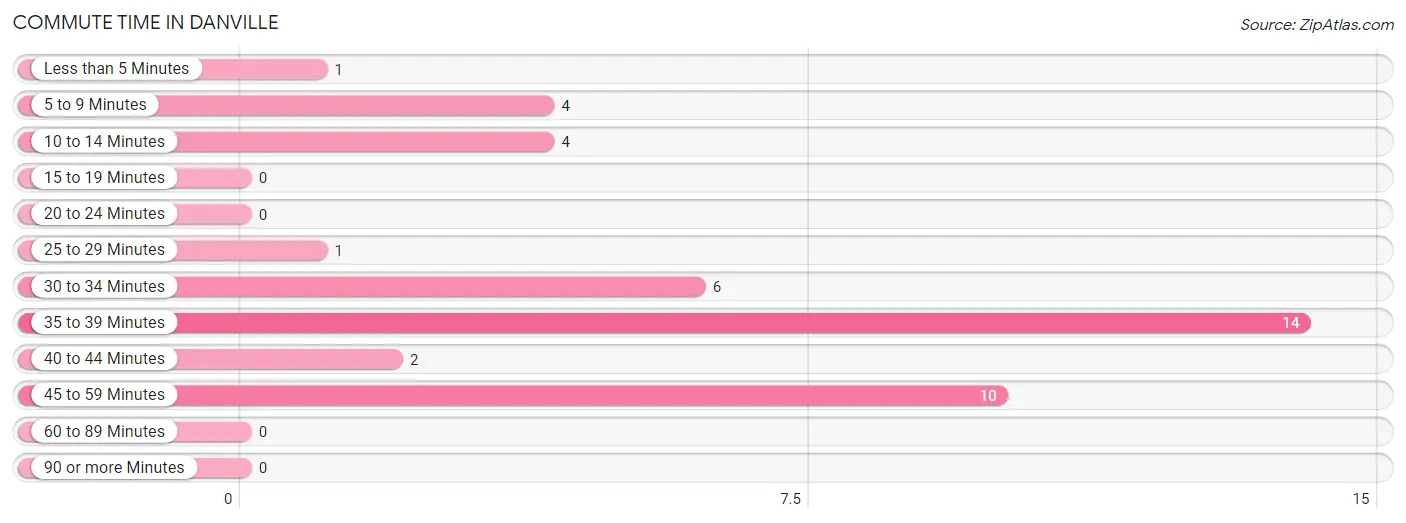
| Commute Time | # Commuters | % Commuters |
| Less than 5 Minutes | 1 | 2.4% |
| 5 to 9 Minutes | 4 | 9.5% |
| 10 to 14 Minutes | 4 | 9.5% |
| 15 to 19 Minutes | 0 | 0.0% |
| 20 to 24 Minutes | 0 | 0.0% |
| 25 to 29 Minutes | 1 | 2.4% |
| 30 to 34 Minutes | 6 | 14.3% |
| 35 to 39 Minutes | 14 | 33.3% |
| 40 to 44 Minutes | 2 | 4.8% |
| 45 to 59 Minutes | 10 | 23.8% |
| 60 to 89 Minutes | 0 | 0.0% |
| 90 or more Minutes | 0 | 0.0% |
Commute Time by Sex in Danville
The most common commute times in Danville are 35 to 39 minutes (14 commuters, 40.0%) for males and 30 to 34 minutes (3 commuters, 42.9%) for females.
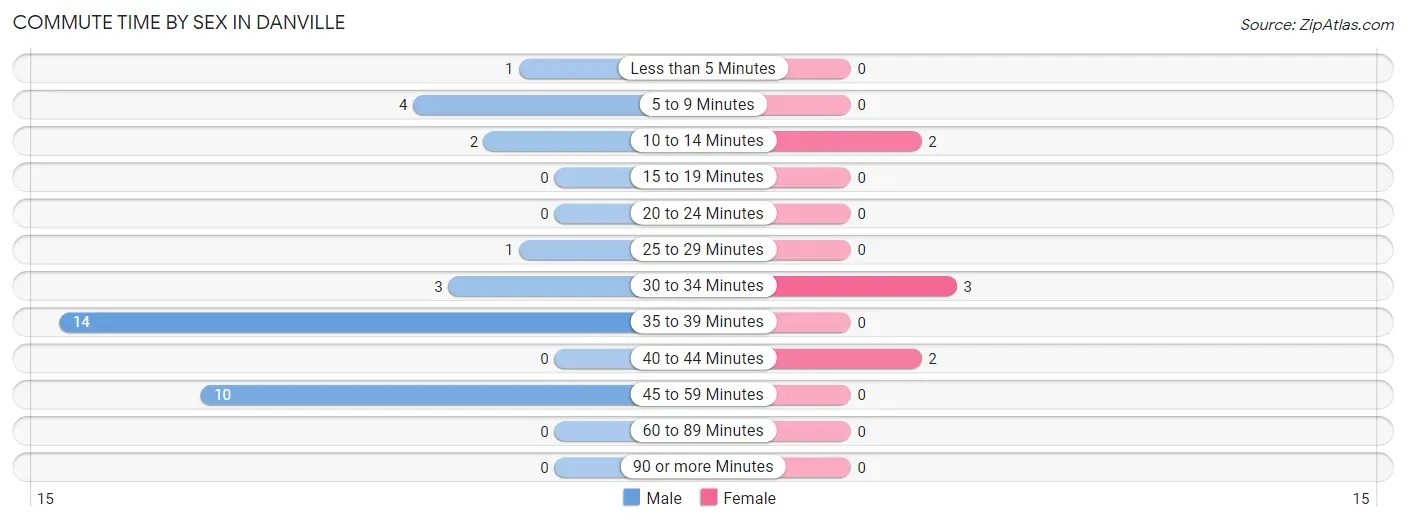
| Commute Time | Male | Female |
| Less than 5 Minutes | 1 (2.9%) | 0 (0.0%) |
| 5 to 9 Minutes | 4 (11.4%) | 0 (0.0%) |
| 10 to 14 Minutes | 2 (5.7%) | 2 (28.6%) |
| 15 to 19 Minutes | 0 (0.0%) | 0 (0.0%) |
| 20 to 24 Minutes | 0 (0.0%) | 0 (0.0%) |
| 25 to 29 Minutes | 1 (2.9%) | 0 (0.0%) |
| 30 to 34 Minutes | 3 (8.6%) | 3 (42.9%) |
| 35 to 39 Minutes | 14 (40.0%) | 0 (0.0%) |
| 40 to 44 Minutes | 0 (0.0%) | 2 (28.6%) |
| 45 to 59 Minutes | 10 (28.6%) | 0 (0.0%) |
| 60 to 89 Minutes | 0 (0.0%) | 0 (0.0%) |
| 90 or more Minutes | 0 (0.0%) | 0 (0.0%) |
Time of Departure to Work by Sex in Danville
The most frequent times of departure to work in Danville are 8:00 AM to 8:29 AM (14, 40.0%) for males and 7:30 AM to 7:59 AM (3, 42.9%) for females.
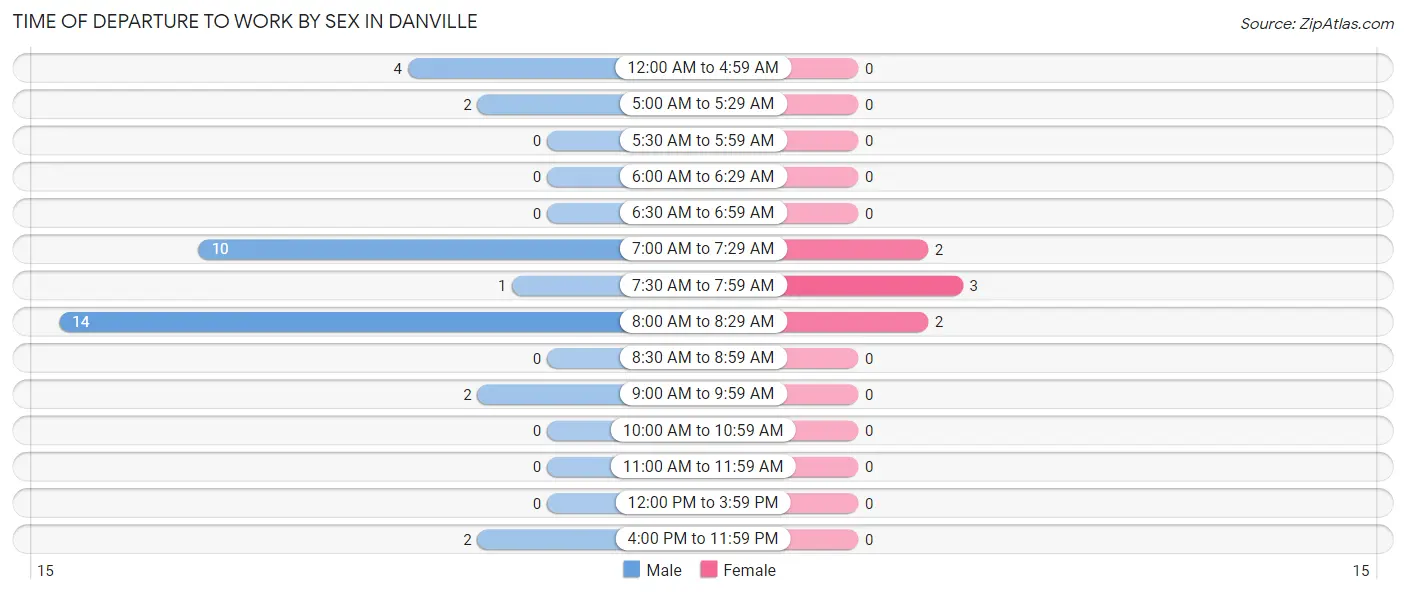
| Time of Departure | Male | Female |
| 12:00 AM to 4:59 AM | 4 (11.4%) | 0 (0.0%) |
| 5:00 AM to 5:29 AM | 2 (5.7%) | 0 (0.0%) |
| 5:30 AM to 5:59 AM | 0 (0.0%) | 0 (0.0%) |
| 6:00 AM to 6:29 AM | 0 (0.0%) | 0 (0.0%) |
| 6:30 AM to 6:59 AM | 0 (0.0%) | 0 (0.0%) |
| 7:00 AM to 7:29 AM | 10 (28.6%) | 2 (28.6%) |
| 7:30 AM to 7:59 AM | 1 (2.9%) | 3 (42.9%) |
| 8:00 AM to 8:29 AM | 14 (40.0%) | 2 (28.6%) |
| 8:30 AM to 8:59 AM | 0 (0.0%) | 0 (0.0%) |
| 9:00 AM to 9:59 AM | 2 (5.7%) | 0 (0.0%) |
| 10:00 AM to 10:59 AM | 0 (0.0%) | 0 (0.0%) |
| 11:00 AM to 11:59 AM | 0 (0.0%) | 0 (0.0%) |
| 12:00 PM to 3:59 PM | 0 (0.0%) | 0 (0.0%) |
| 4:00 PM to 11:59 PM | 2 (5.7%) | 0 (0.0%) |
| Total | 35 (100.0%) | 7 (100.0%) |
Housing Occupancy in Danville
Occupancy by Ownership in Danville
Of the total 63 dwellings in Danville, owner-occupied units account for 40 (63.5%), while renter-occupied units make up 23 (36.5%).
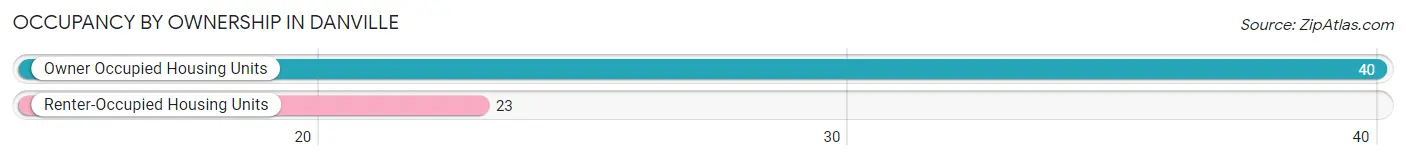
| Occupancy | # Housing Units | % Housing Units |
| Owner Occupied Housing Units | 40 | 63.5% |
| Renter-Occupied Housing Units | 23 | 36.5% |
| Total Occupied Housing Units | 63 | 100.0% |
Occupancy by Household Size in Danville
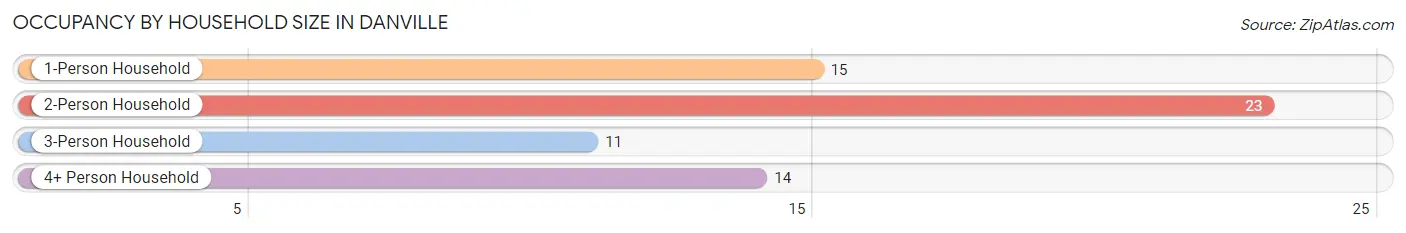
| Household Size | # Housing Units | % Housing Units |
| 1-Person Household | 15 | 23.8% |
| 2-Person Household | 23 | 36.5% |
| 3-Person Household | 11 | 17.5% |
| 4+ Person Household | 14 | 22.2% |
| Total Housing Units | 63 | 100.0% |
Occupancy by Ownership by Household Size in Danville
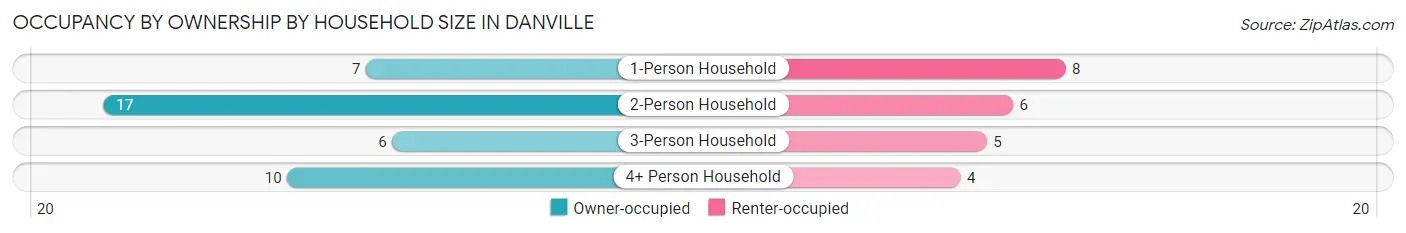
| Household Size | Owner-occupied | Renter-occupied |
| 1-Person Household | 7 (46.7%) | 8 (53.3%) |
| 2-Person Household | 17 (73.9%) | 6 (26.1%) |
| 3-Person Household | 6 (54.5%) | 5 (45.5%) |
| 4+ Person Household | 10 (71.4%) | 4 (28.6%) |
| Total Housing Units | 40 (63.5%) | 23 (36.5%) |
Occupancy by Educational Attainment in Danville
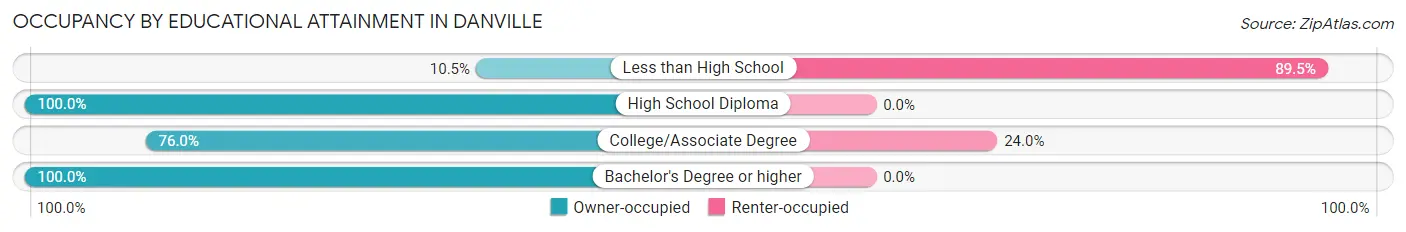
| Household Size | Owner-occupied | Renter-occupied |
| Less than High School | 2 (10.5%) | 17 (89.5%) |
| High School Diploma | 12 (100.0%) | 0 (0.0%) |
| College/Associate Degree | 19 (76.0%) | 6 (24.0%) |
| Bachelor's Degree or higher | 7 (100.0%) | 0 (0.0%) |
Occupancy by Age of Householder in Danville
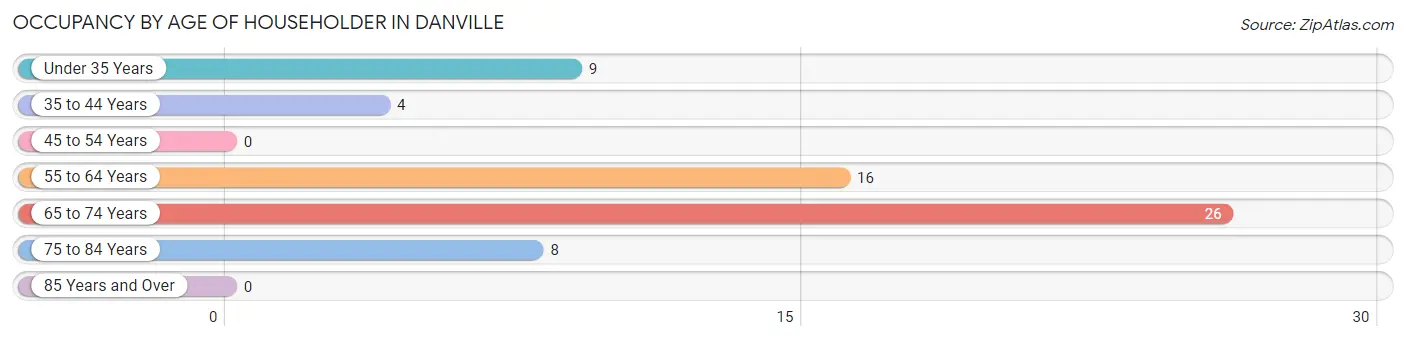
| Age Bracket | # Households | % Households |
| Under 35 Years | 9 | 14.3% |
| 35 to 44 Years | 4 | 6.4% |
| 45 to 54 Years | 0 | 0.0% |
| 55 to 64 Years | 16 | 25.4% |
| 65 to 74 Years | 26 | 41.3% |
| 75 to 84 Years | 8 | 12.7% |
| 85 Years and Over | 0 | 0.0% |
| Total | 63 | 100.0% |
Housing Finances in Danville
Median Income by Occupancy in Danville
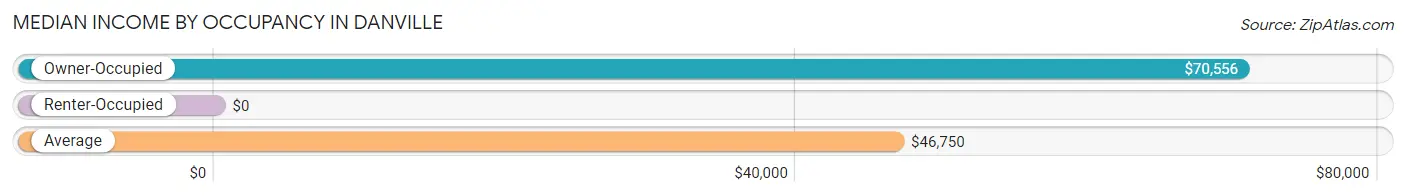
| Occupancy Type | # Households | Median Income |
| Owner-Occupied | 40 (63.5%) | $70,556 |
| Renter-Occupied | 23 (36.5%) | $0 |
| Average | 63 (100.0%) | $46,750 |
Occupancy by Householder Income Bracket in Danville
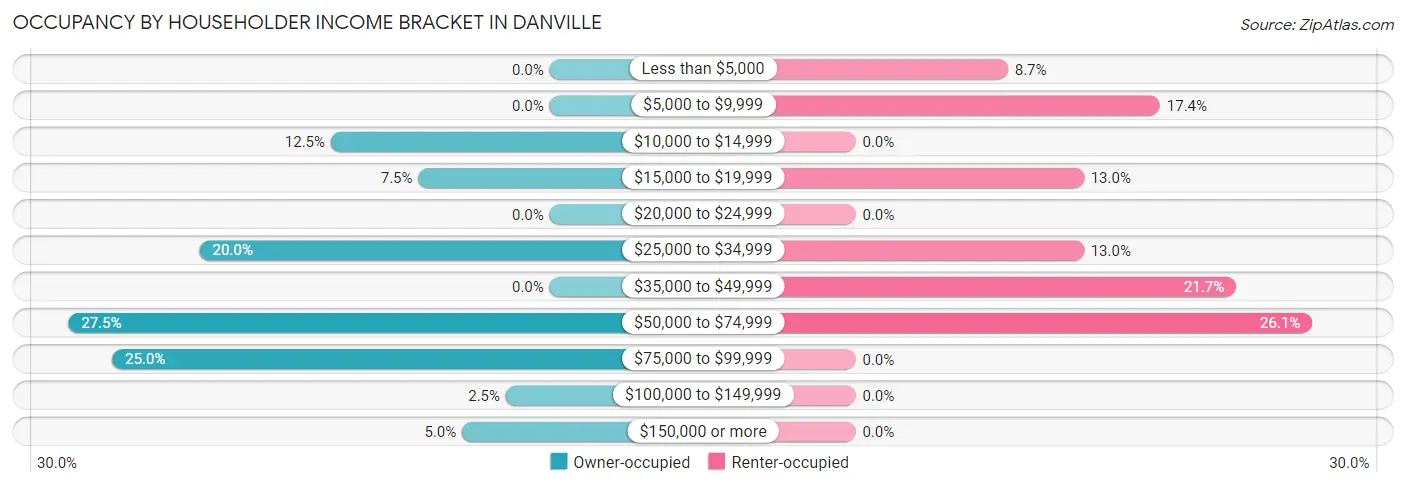
| Income Bracket | Owner-occupied | Renter-occupied |
| Less than $5,000 | 0 (0.0%) | 2 (8.7%) |
| $5,000 to $9,999 | 0 (0.0%) | 4 (17.4%) |
| $10,000 to $14,999 | 5 (12.5%) | 0 (0.0%) |
| $15,000 to $19,999 | 3 (7.5%) | 3 (13.0%) |
| $20,000 to $24,999 | 0 (0.0%) | 0 (0.0%) |
| $25,000 to $34,999 | 8 (20.0%) | 3 (13.0%) |
| $35,000 to $49,999 | 0 (0.0%) | 5 (21.7%) |
| $50,000 to $74,999 | 11 (27.5%) | 6 (26.1%) |
| $75,000 to $99,999 | 10 (25.0%) | 0 (0.0%) |
| $100,000 to $149,999 | 1 (2.5%) | 0 (0.0%) |
| $150,000 or more | 2 (5.0%) | 0 (0.0%) |
| Total | 40 (100.0%) | 23 (100.0%) |
Monthly Housing Cost Tiers in Danville
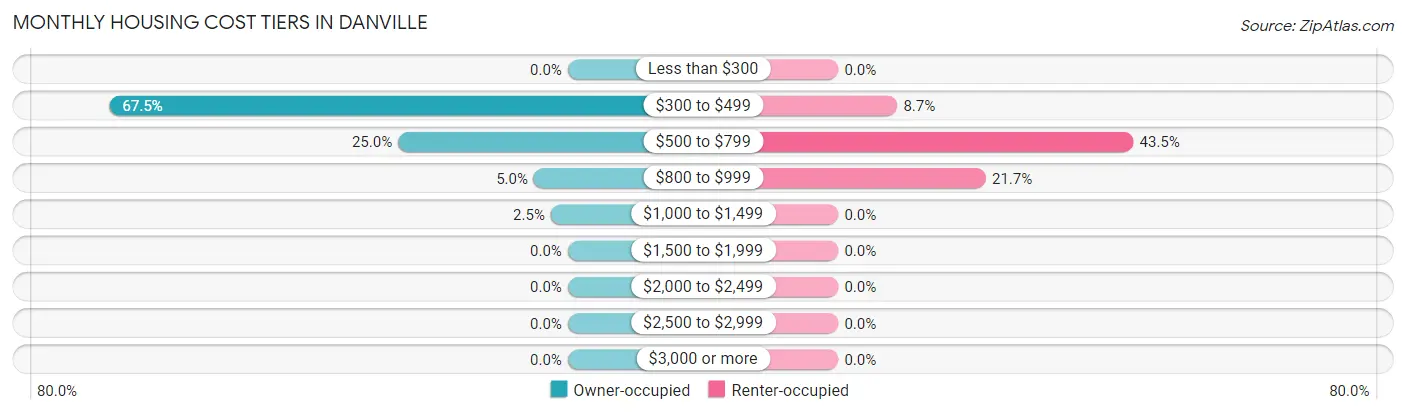
| Monthly Cost | Owner-occupied | Renter-occupied |
| Less than $300 | 0 (0.0%) | 0 (0.0%) |
| $300 to $499 | 27 (67.5%) | 2 (8.7%) |
| $500 to $799 | 10 (25.0%) | 10 (43.5%) |
| $800 to $999 | 2 (5.0%) | 5 (21.7%) |
| $1,000 to $1,499 | 1 (2.5%) | 0 (0.0%) |
| $1,500 to $1,999 | 0 (0.0%) | 0 (0.0%) |
| $2,000 to $2,499 | 0 (0.0%) | 0 (0.0%) |
| $2,500 to $2,999 | 0 (0.0%) | 0 (0.0%) |
| $3,000 or more | 0 (0.0%) | 0 (0.0%) |
| Total | 40 (100.0%) | 23 (100.0%) |
Physical Housing Characteristics in Danville
Housing Structures in Danville
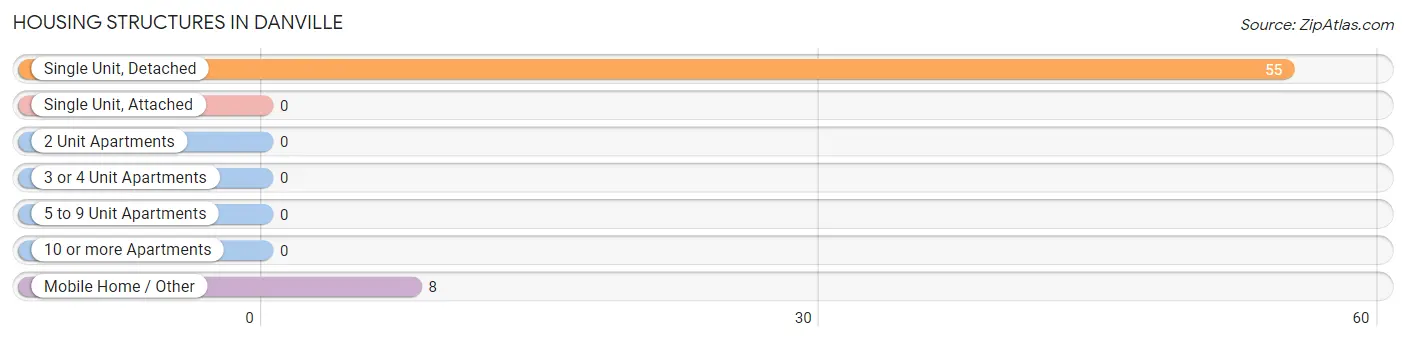
| Structure Type | # Housing Units | % Housing Units |
| Single Unit, Detached | 55 | 87.3% |
| Single Unit, Attached | 0 | 0.0% |
| 2 Unit Apartments | 0 | 0.0% |
| 3 or 4 Unit Apartments | 0 | 0.0% |
| 5 to 9 Unit Apartments | 0 | 0.0% |
| 10 or more Apartments | 0 | 0.0% |
| Mobile Home / Other | 8 | 12.7% |
| Total | 63 | 100.0% |
Housing Structures by Occupancy in Danville
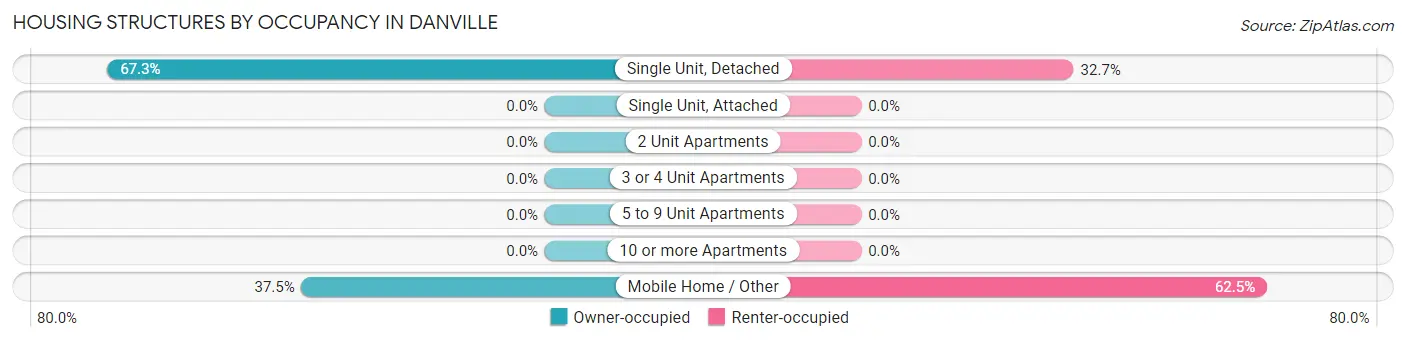
| Structure Type | Owner-occupied | Renter-occupied |
| Single Unit, Detached | 37 (67.3%) | 18 (32.7%) |
| Single Unit, Attached | 0 (0.0%) | 0 (0.0%) |
| 2 Unit Apartments | 0 (0.0%) | 0 (0.0%) |
| 3 or 4 Unit Apartments | 0 (0.0%) | 0 (0.0%) |
| 5 to 9 Unit Apartments | 0 (0.0%) | 0 (0.0%) |
| 10 or more Apartments | 0 (0.0%) | 0 (0.0%) |
| Mobile Home / Other | 3 (37.5%) | 5 (62.5%) |
| Total | 40 (63.5%) | 23 (36.5%) |
Housing Structures by Number of Rooms in Danville
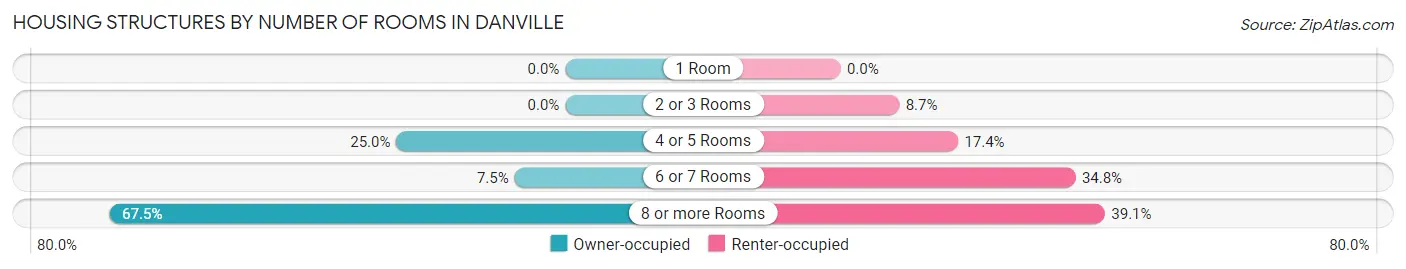
| Number of Rooms | Owner-occupied | Renter-occupied |
| 1 Room | 0 (0.0%) | 0 (0.0%) |
| 2 or 3 Rooms | 0 (0.0%) | 2 (8.7%) |
| 4 or 5 Rooms | 10 (25.0%) | 4 (17.4%) |
| 6 or 7 Rooms | 3 (7.5%) | 8 (34.8%) |
| 8 or more Rooms | 27 (67.5%) | 9 (39.1%) |
| Total | 40 (100.0%) | 23 (100.0%) |
Housing Structure by Heating Type in Danville
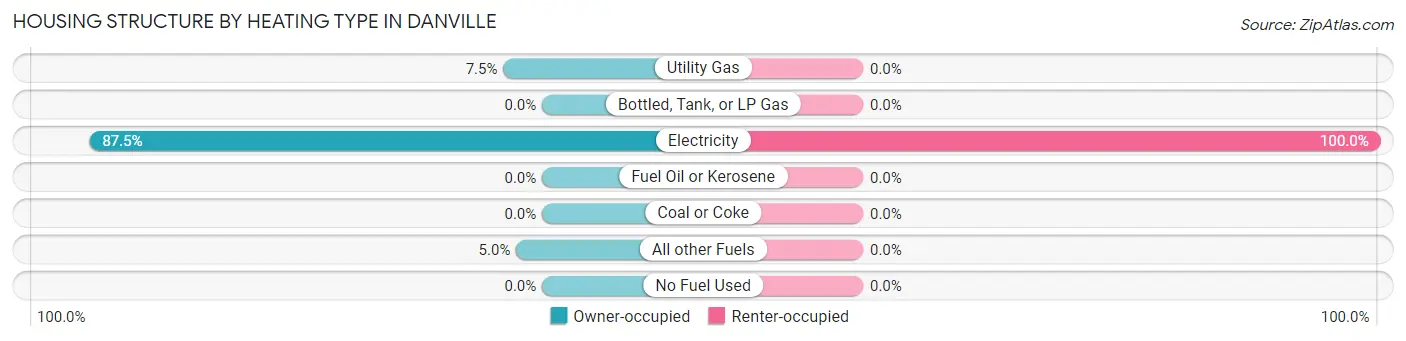
| Heating Type | Owner-occupied | Renter-occupied |
| Utility Gas | 3 (7.5%) | 0 (0.0%) |
| Bottled, Tank, or LP Gas | 0 (0.0%) | 0 (0.0%) |
| Electricity | 35 (87.5%) | 23 (100.0%) |
| Fuel Oil or Kerosene | 0 (0.0%) | 0 (0.0%) |
| Coal or Coke | 0 (0.0%) | 0 (0.0%) |
| All other Fuels | 2 (5.0%) | 0 (0.0%) |
| No Fuel Used | 0 (0.0%) | 0 (0.0%) |
| Total | 40 (100.0%) | 23 (100.0%) |
Household Vehicle Usage in Danville
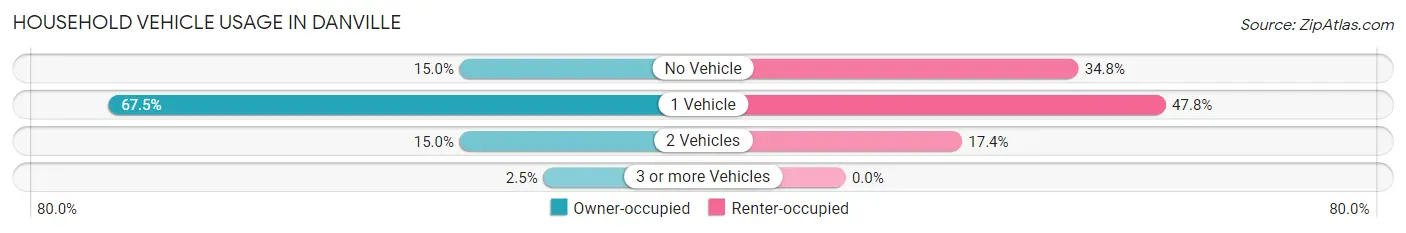
| Vehicles per Household | Owner-occupied | Renter-occupied |
| No Vehicle | 6 (15.0%) | 8 (34.8%) |
| 1 Vehicle | 27 (67.5%) | 11 (47.8%) |
| 2 Vehicles | 6 (15.0%) | 4 (17.4%) |
| 3 or more Vehicles | 1 (2.5%) | 0 (0.0%) |
| Total | 40 (100.0%) | 23 (100.0%) |
Real Estate & Mortgages in Danville
Real Estate and Mortgage Overview in Danville
| Characteristic | Without Mortgage | With Mortgage |
| Housing Units | 37 | 3 |
| Median Property Value | $76,900 | $0 |
| Median Household Income | $70,536 | $0 |
| Monthly Housing Costs | $435 | $0 |
| Real Estate Taxes | $892 | $0 |
Property Value by Mortgage Status in Danville
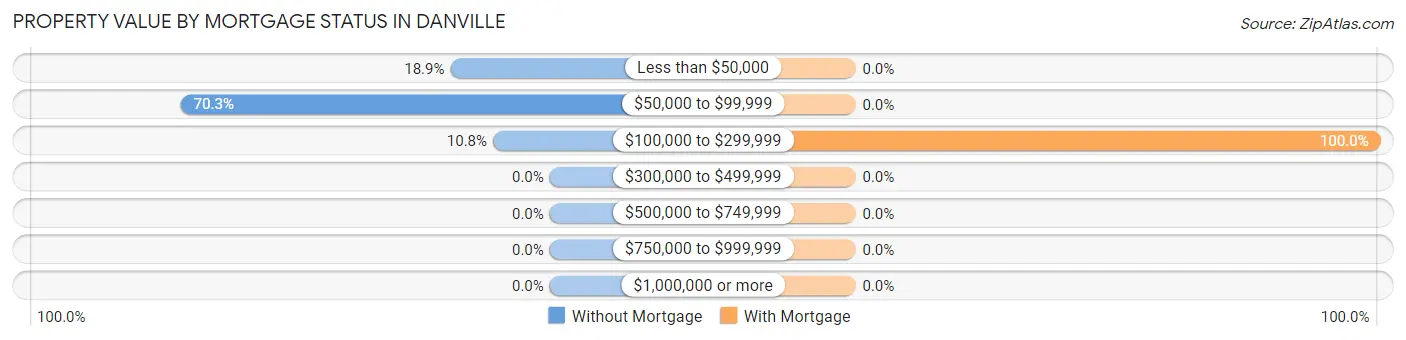
| Property Value | Without Mortgage | With Mortgage |
| Less than $50,000 | 7 (18.9%) | 0 (0.0%) |
| $50,000 to $99,999 | 26 (70.3%) | 0 (0.0%) |
| $100,000 to $299,999 | 4 (10.8%) | 3 (100.0%) |
| $300,000 to $499,999 | 0 (0.0%) | 0 (0.0%) |
| $500,000 to $749,999 | 0 (0.0%) | 0 (0.0%) |
| $750,000 to $999,999 | 0 (0.0%) | 0 (0.0%) |
| $1,000,000 or more | 0 (0.0%) | 0 (0.0%) |
| Total | 37 (100.0%) | 3 (100.0%) |
Household Income by Mortgage Status in Danville
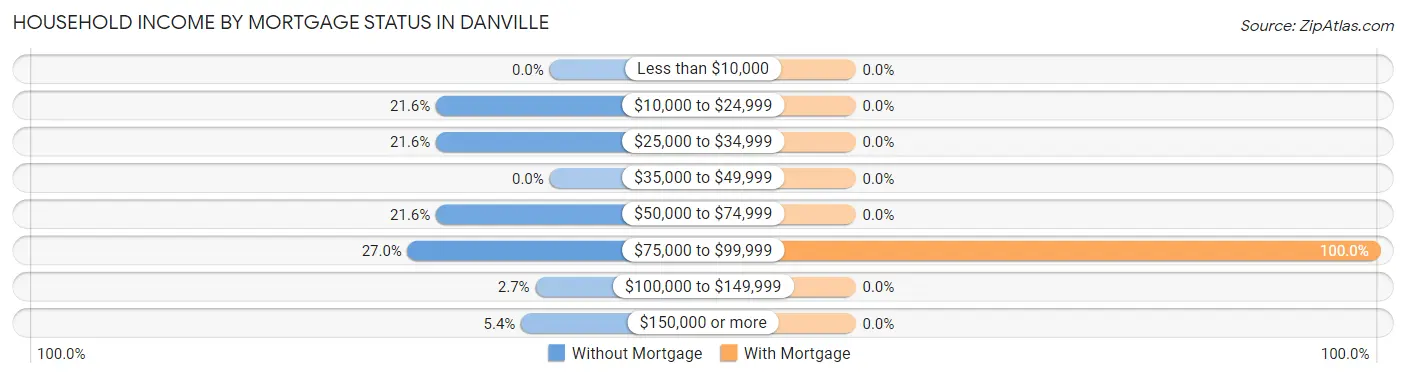
| Household Income | Without Mortgage | With Mortgage |
| Less than $10,000 | 0 (0.0%) | 0 (0.0%) |
| $10,000 to $24,999 | 8 (21.6%) | 0 (0.0%) |
| $25,000 to $34,999 | 8 (21.6%) | 0 (0.0%) |
| $35,000 to $49,999 | 0 (0.0%) | 0 (0.0%) |
| $50,000 to $74,999 | 8 (21.6%) | 0 (0.0%) |
| $75,000 to $99,999 | 10 (27.0%) | 3 (100.0%) |
| $100,000 to $149,999 | 1 (2.7%) | 0 (0.0%) |
| $150,000 or more | 2 (5.4%) | 0 (0.0%) |
| Total | 37 (100.0%) | 3 (100.0%) |
Property Value to Household Income Ratio in Danville
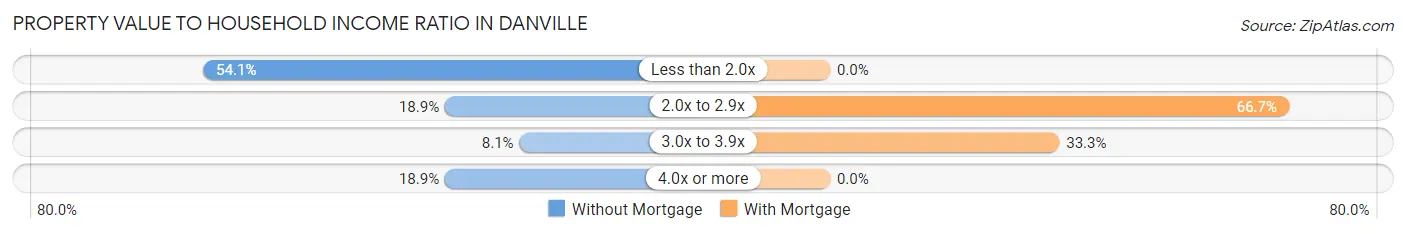
| Value-to-Income Ratio | Without Mortgage | With Mortgage |
| Less than 2.0x | 20 (54.0%) | 0 (0.0%) |
| 2.0x to 2.9x | 7 (18.9%) | 2 (66.7%) |
| 3.0x to 3.9x | 3 (8.1%) | 1 (33.3%) |
| 4.0x or more | 7 (18.9%) | 0 (0.0%) |
| Total | 37 (100.0%) | 3 (100.0%) |
Real Estate Taxes by Mortgage Status in Danville
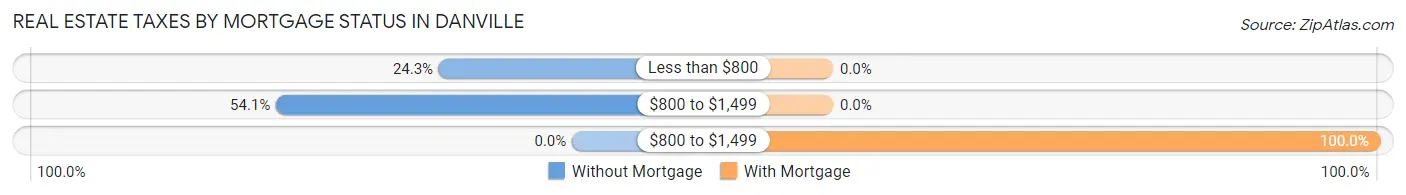
| Property Taxes | Without Mortgage | With Mortgage |
| Less than $800 | 9 (24.3%) | 0 (0.0%) |
| $800 to $1,499 | 20 (54.0%) | 0 (0.0%) |
| $800 to $1,499 | 0 (0.0%) | 3 (100.0%) |
| Total | 37 (100.0%) | 3 (100.0%) |
Health & Disability in Danville
Health Insurance Coverage by Age in Danville
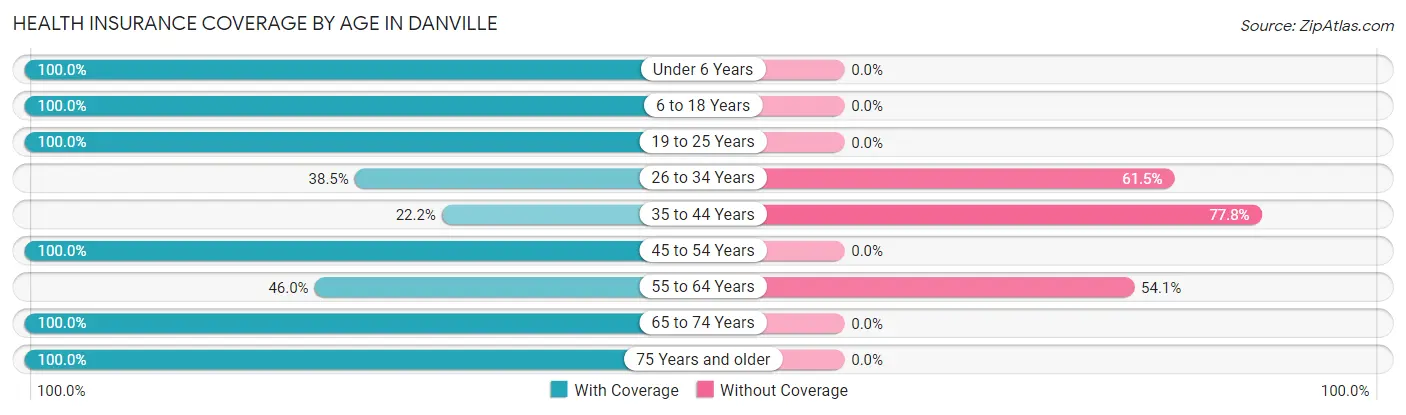
| Age Bracket | With Coverage | Without Coverage |
| Under 6 Years | 13 (100.0%) | 0 (0.0%) |
| 6 to 18 Years | 39 (100.0%) | 0 (0.0%) |
| 19 to 25 Years | 3 (100.0%) | 0 (0.0%) |
| 26 to 34 Years | 5 (38.5%) | 8 (61.5%) |
| 35 to 44 Years | 4 (22.2%) | 14 (77.8%) |
| 45 to 54 Years | 11 (100.0%) | 0 (0.0%) |
| 55 to 64 Years | 17 (46.0%) | 20 (54.0%) |
| 65 to 74 Years | 44 (100.0%) | 0 (0.0%) |
| 75 Years and older | 8 (100.0%) | 0 (0.0%) |
| Total | 144 (77.4%) | 42 (22.6%) |
Health Insurance Coverage by Citizenship Status in Danville
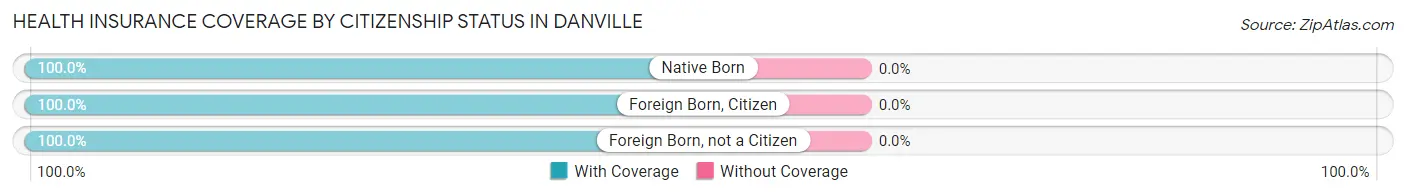
| Citizenship Status | With Coverage | Without Coverage |
| Native Born | 13 (100.0%) | 0 (0.0%) |
| Foreign Born, Citizen | 39 (100.0%) | 0 (0.0%) |
| Foreign Born, not a Citizen | 3 (100.0%) | 0 (0.0%) |
Health Insurance Coverage by Household Income in Danville
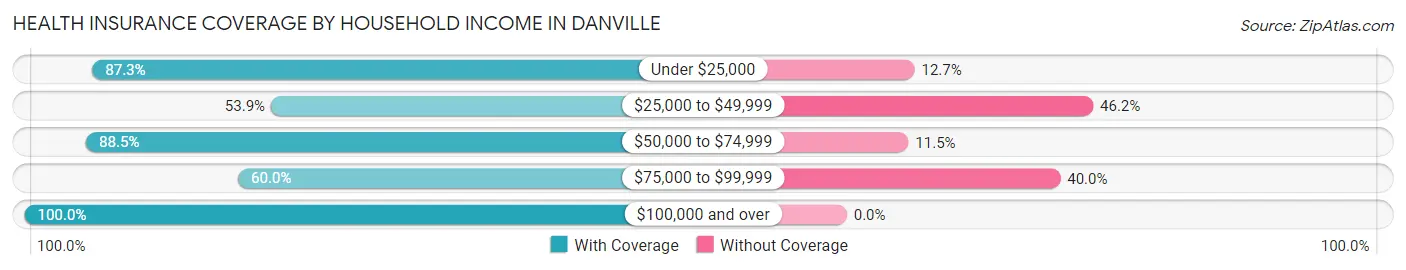
| Household Income | With Coverage | Without Coverage |
| Under $25,000 | 55 (87.3%) | 8 (12.7%) |
| $25,000 to $49,999 | 21 (53.8%) | 18 (46.2%) |
| $50,000 to $74,999 | 46 (88.5%) | 6 (11.5%) |
| $75,000 to $99,999 | 15 (60.0%) | 10 (40.0%) |
| $100,000 and over | 7 (100.0%) | 0 (0.0%) |
Public vs Private Health Insurance Coverage by Age in Danville
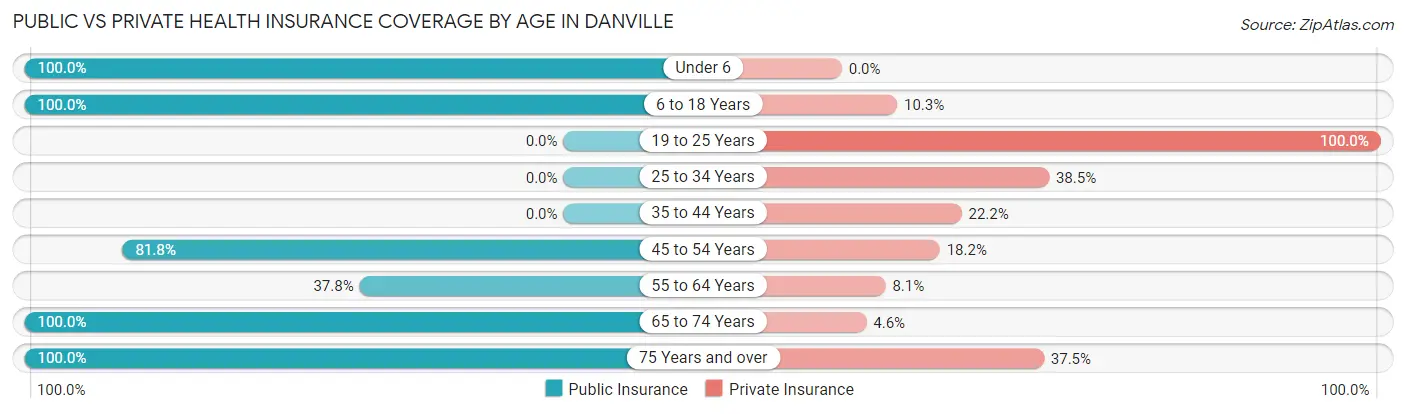
| Age Bracket | Public Insurance | Private Insurance |
| Under 6 | 13 (100.0%) | 0 (0.0%) |
| 6 to 18 Years | 39 (100.0%) | 4 (10.3%) |
| 19 to 25 Years | 0 (0.0%) | 3 (100.0%) |
| 25 to 34 Years | 0 (0.0%) | 5 (38.5%) |
| 35 to 44 Years | 0 (0.0%) | 4 (22.2%) |
| 45 to 54 Years | 9 (81.8%) | 2 (18.2%) |
| 55 to 64 Years | 14 (37.8%) | 3 (8.1%) |
| 65 to 74 Years | 44 (100.0%) | 2 (4.5%) |
| 75 Years and over | 8 (100.0%) | 3 (37.5%) |
| Total | 127 (68.3%) | 26 (14.0%) |
Disability Status by Sex by Age in Danville
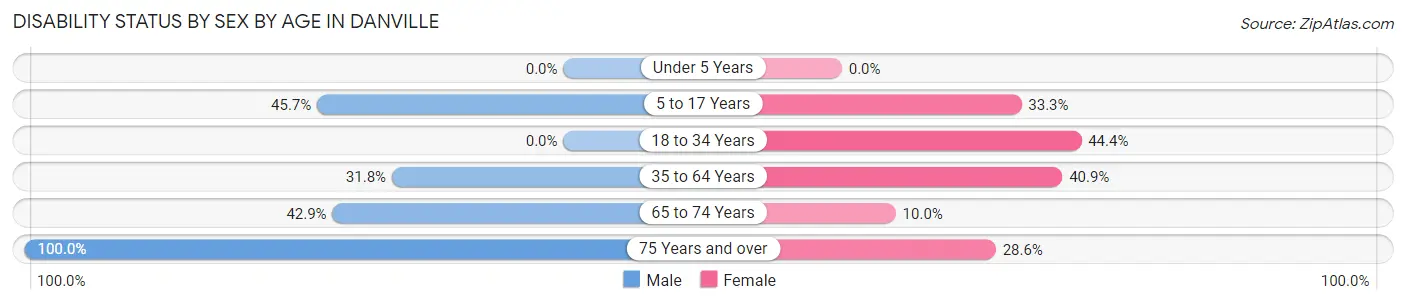
| Age Bracket | Male | Female |
| Under 5 Years | 0 (0.0%) | 0 (0.0%) |
| 5 to 17 Years | 16 (45.7%) | 2 (33.3%) |
| 18 to 34 Years | 0 (0.0%) | 4 (44.4%) |
| 35 to 64 Years | 14 (31.8%) | 9 (40.9%) |
| 65 to 74 Years | 6 (42.9%) | 3 (10.0%) |
| 75 Years and over | 1 (100.0%) | 2 (28.6%) |
Disability Class by Sex by Age in Danville
Disability Class: Hearing Difficulty
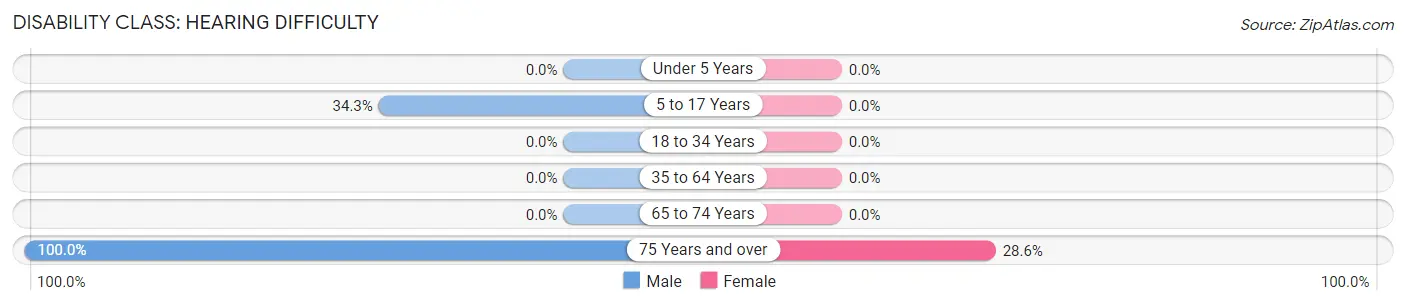
| Age Bracket | Male | Female |
| Under 5 Years | 0 (0.0%) | 0 (0.0%) |
| 5 to 17 Years | 12 (34.3%) | 0 (0.0%) |
| 18 to 34 Years | 0 (0.0%) | 0 (0.0%) |
| 35 to 64 Years | 0 (0.0%) | 0 (0.0%) |
| 65 to 74 Years | 0 (0.0%) | 0 (0.0%) |
| 75 Years and over | 1 (100.0%) | 2 (28.6%) |
Disability Class: Vision Difficulty
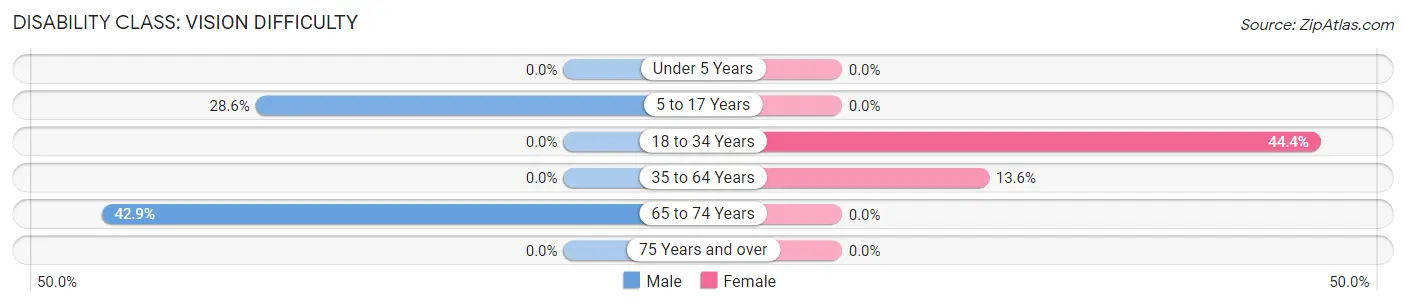
| Age Bracket | Male | Female |
| Under 5 Years | 0 (0.0%) | 0 (0.0%) |
| 5 to 17 Years | 10 (28.6%) | 0 (0.0%) |
| 18 to 34 Years | 0 (0.0%) | 4 (44.4%) |
| 35 to 64 Years | 0 (0.0%) | 3 (13.6%) |
| 65 to 74 Years | 6 (42.9%) | 0 (0.0%) |
| 75 Years and over | 0 (0.0%) | 0 (0.0%) |
Disability Class: Cognitive Difficulty
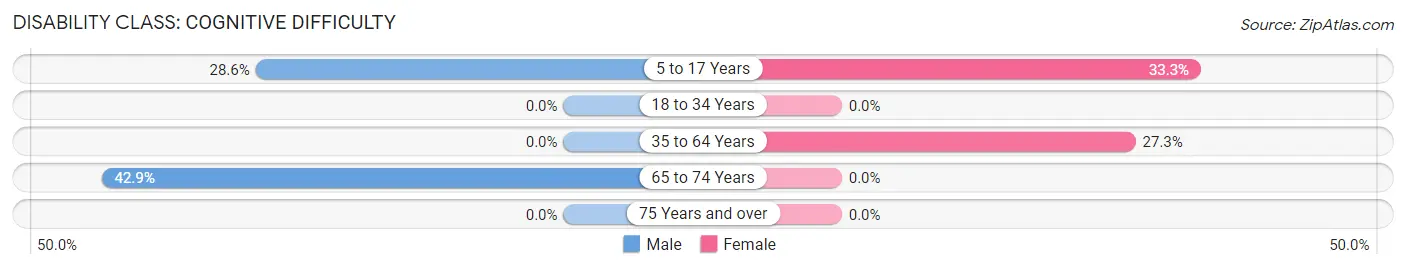
| Age Bracket | Male | Female |
| 5 to 17 Years | 10 (28.6%) | 2 (33.3%) |
| 18 to 34 Years | 0 (0.0%) | 0 (0.0%) |
| 35 to 64 Years | 0 (0.0%) | 6 (27.3%) |
| 65 to 74 Years | 6 (42.9%) | 0 (0.0%) |
| 75 Years and over | 0 (0.0%) | 0 (0.0%) |
Disability Class: Ambulatory Difficulty
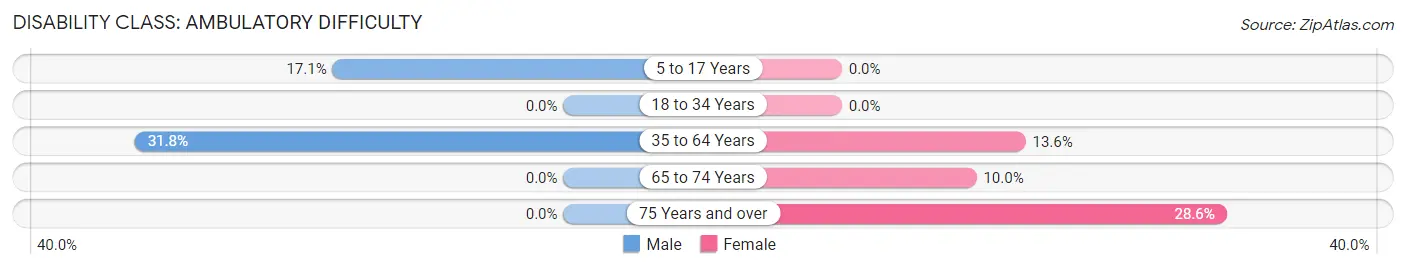
| Age Bracket | Male | Female |
| 5 to 17 Years | 6 (17.1%) | 0 (0.0%) |
| 18 to 34 Years | 0 (0.0%) | 0 (0.0%) |
| 35 to 64 Years | 14 (31.8%) | 3 (13.6%) |
| 65 to 74 Years | 0 (0.0%) | 3 (10.0%) |
| 75 Years and over | 0 (0.0%) | 2 (28.6%) |
Disability Class: Self-Care Difficulty
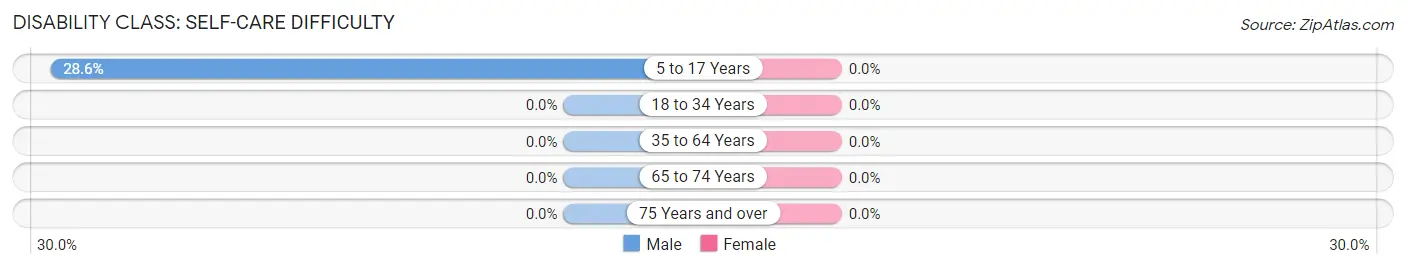
| Age Bracket | Male | Female |
| 5 to 17 Years | 10 (28.6%) | 0 (0.0%) |
| 18 to 34 Years | 0 (0.0%) | 0 (0.0%) |
| 35 to 64 Years | 0 (0.0%) | 0 (0.0%) |
| 65 to 74 Years | 0 (0.0%) | 0 (0.0%) |
| 75 Years and over | 0 (0.0%) | 0 (0.0%) |
Technology Access in Danville
Computing Device Access in Danville
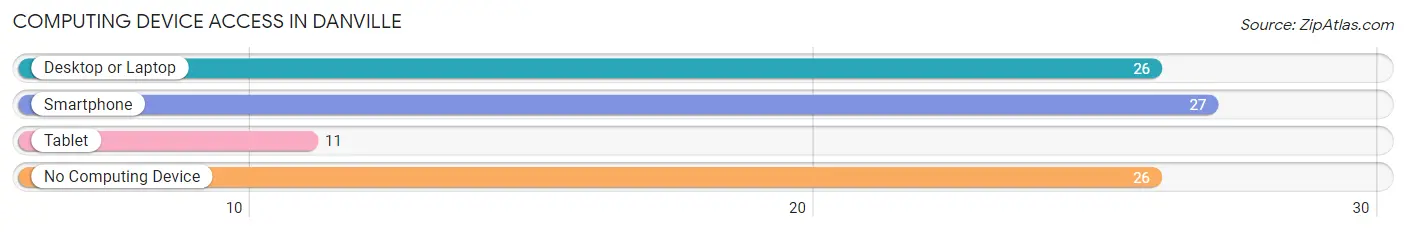
| Device Type | # Households | % Households |
| Desktop or Laptop | 26 | 41.3% |
| Smartphone | 27 | 42.9% |
| Tablet | 11 | 17.5% |
| No Computing Device | 26 | 41.3% |
| Total | 63 | 100.0% |
Internet Access in Danville
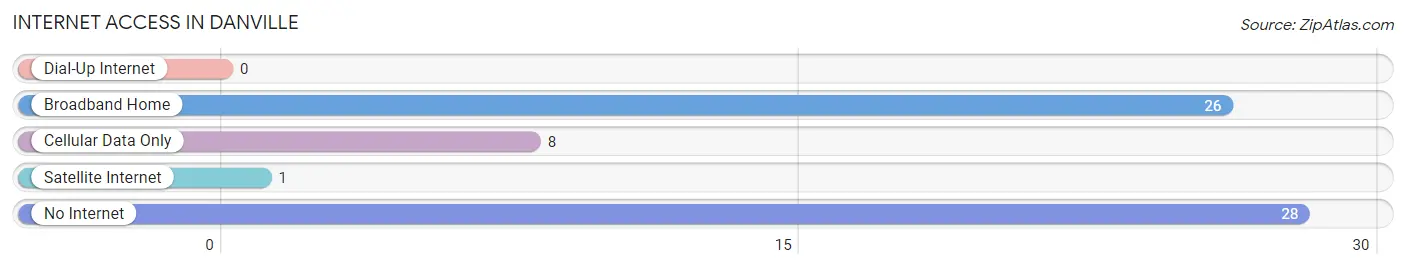
| Internet Type | # Households | % Households |
| Dial-Up Internet | 0 | 0.0% |
| Broadband Home | 26 | 41.3% |
| Cellular Data Only | 8 | 12.7% |
| Satellite Internet | 1 | 1.6% |
| No Internet | 28 | 44.4% |
| Total | 63 | 100.0% |
Danville Summary
Danville, Georgia is a small town located in the northwest corner of Georgia, in the foothills of the Appalachian Mountains. It is situated in the Chattahoochee National Forest, and is part of the larger metropolitan area of Atlanta. The town has a population of just over 1,000 people, and is known for its rural charm and small-town atmosphere.
History
Danville was founded in 1820 by a group of settlers from North Carolina. The town was named after Daniel Smith, a Revolutionary War veteran who had settled in the area. The town was originally a farming community, and the main crops grown were cotton, corn, and tobacco. The town was also known for its iron ore deposits, which were mined and used to make tools and weapons.
In the late 19th century, the town began to grow and develop. The railroad was extended to Danville in 1887, and the town became a popular stop for travelers. The town also became a center for the timber industry, and several sawmills were built in the area.
In the early 20th century, the town began to decline. The timber industry had moved away, and the railroad had stopped running. The town was also hit hard by the Great Depression, and many of the businesses in the area closed.
Geography
Danville is located in the northwest corner of Georgia, in the foothills of the Appalachian Mountains. The town is situated in the Chattahoochee National Forest, and is part of the larger metropolitan area of Atlanta. The town is located at the intersection of two major highways, US Route 41 and Georgia State Route 5.
The town is surrounded by rolling hills and forests, and is known for its rural charm and small-town atmosphere. The town is located near several lakes, including Lake Lanier, Lake Allatoona, and Lake Nottely.
Economy
The economy of Danville is largely based on agriculture and tourism. The town is home to several farms, which produce a variety of crops, including corn, cotton, and tobacco. The town is also home to several wineries, which produce a variety of wines.
The town is also a popular tourist destination, and is known for its rural charm and small-town atmosphere. The town is home to several historic sites, including the Danville Historic District, which is listed on the National Register of Historic Places. The town is also home to several parks and recreational areas, including the Chattahoochee National Forest.
Demographics
As of the 2010 census, the population of Danville was 1,039. The town is predominantly white, with a population that is 97.3% white and 2.7% African American. The median household income in the town is $37,500, and the median age is 44. The town has a low unemployment rate of 4.2%.
Conclusion
Danville, Georgia is a small town located in the northwest corner of Georgia, in the foothills of the Appalachian Mountains. The town has a population of just over 1,000 people, and is known for its rural charm and small-town atmosphere. The economy of the town is largely based on agriculture and tourism, and the town is home to several farms, wineries, and historic sites. The town is predominantly white, with a population that is 97.3% white and 2.7% African American. The median household income in the town is $37,500, and the median age is 44. Danville is a charming and peaceful town, and is a great place to visit or live.
Common Questions
What is Per Capita Income in Danville?
Per Capita income in Danville is $20,619.
What is the Median Family Income in Danville?
Median Family Income in Danville is $70,139.
What is the Median Household income in Danville?
Median Household Income in Danville is $46,750.
What is Inequality or Gini Index in Danville?
Inequality or Gini Index in Danville is 0.38.
What is the Total Population of Danville?
Total Population of Danville is 186.
What is the Total Male Population of Danville?
Total Male Population of Danville is 106.
What is the Total Female Population of Danville?
Total Female Population of Danville is 80.
What is the Ratio of Males per 100 Females in Danville?
There are 132.50 Males per 100 Females in Danville.
What is the Ratio of Females per 100 Males in Danville?
There are 75.47 Females per 100 Males in Danville.
What is the Median Population Age in Danville?
Median Population Age in Danville is 46.8 Years.
What is the Average Family Size in Danville
Average Family Size in Danville is 3.9 People.
What is the Average Household Size in Danville
Average Household Size in Danville is 3.0 People.
How Large is the Labor Force in Danville?
There are 46 People in the Labor Forcein in Danville.
What is the Percentage of People in the Labor Force in Danville?
33.3% of People are in the Labor Force in Danville.