Cochran, GA Map & Demographics
Cochran Map
Cochran Overview
$21,683
PER CAPITA INCOME
$48,826
AVG FAMILY INCOME
$31,326
AVG HOUSEHOLD INCOME
29.0%
WAGE / INCOME GAP [ % ]
71.0¢/ $1
WAGE / INCOME GAP [ $ ]
0.58
INEQUALITY / GINI INDEX
4,867
TOTAL POPULATION
2,386
MALE POPULATION
2,481
FEMALE POPULATION
96.17
MALES / 100 FEMALES
103.98
FEMALES / 100 MALES
28.9
MEDIAN AGE
3.3
AVG FAMILY SIZE
2.7
AVG HOUSEHOLD SIZE
1,832
LABOR FORCE [ PEOPLE ]
47.6%
PERCENT IN LABOR FORCE
10.5%
UNEMPLOYMENT RATE
Cochran Zip Codes
Cochran Area Codes
Income in Cochran
Income Overview in Cochran
Per Capita Income in Cochran is $21,683, while median incomes of families and households are $48,826 and $31,326 respectively.
| Characteristic | Number | Measure |
| Per Capita Income | 4,867 | $21,683 |
| Median Family Income | 1,023 | $48,826 |
| Mean Family Income | 1,023 | $72,226 |
| Median Household Income | 1,442 | $31,326 |
| Mean Household Income | 1,442 | $60,606 |
| Income Deficit | 1,023 | $0 |
| Wage / Income Gap (%) | 4,867 | 28.96% |
| Wage / Income Gap ($) | 4,867 | 71.04¢ per $1 |
| Gini / Inequality Index | 4,867 | 0.58 |
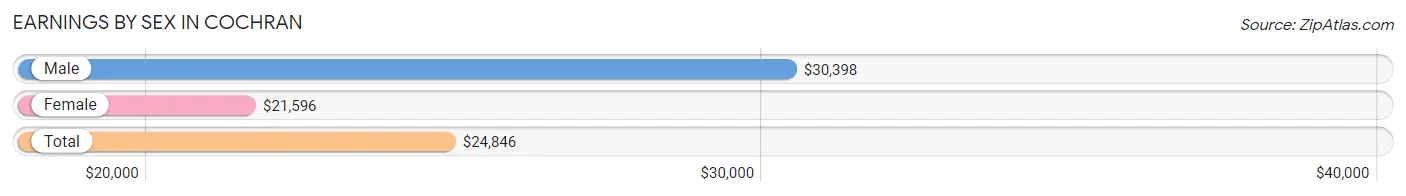
Earnings by Sex in Cochran
Average Earnings in Cochran are $24,846, $30,398 for men and $21,596 for women, a difference of 29.0%.
| Sex | Number | Average Earnings |
| Male | 913 (50.5%) | $30,398 |
| Female | 894 (49.5%) | $21,596 |
| Total | 1,807 (100.0%) | $24,846 |
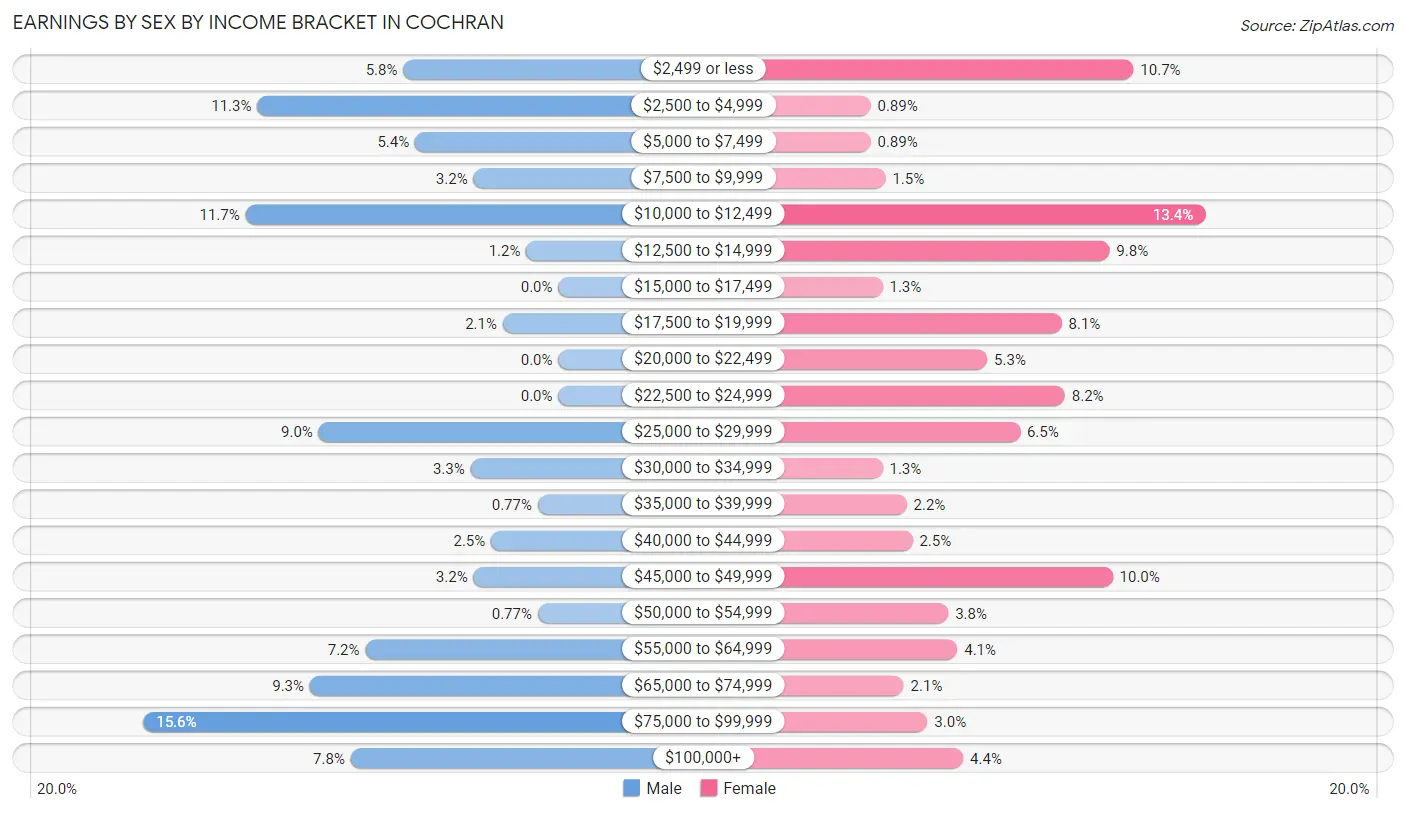
Earnings by Sex by Income Bracket in Cochran
The most common earnings brackets in Cochran are $75,000 to $99,999 for men (142 | 15.5%) and $10,000 to $12,499 for women (120 | 13.4%).
| Income | Male | Female |
| $2,499 or less | 53 (5.8%) | 96 (10.7%) |
| $2,500 to $4,999 | 103 (11.3%) | 8 (0.9%) |
| $5,000 to $7,499 | 49 (5.4%) | 8 (0.9%) |
| $7,500 to $9,999 | 29 (3.2%) | 13 (1.5%) |
| $10,000 to $12,499 | 107 (11.7%) | 120 (13.4%) |
| $12,500 to $14,999 | 11 (1.2%) | 88 (9.8%) |
| $15,000 to $17,499 | 0 (0.0%) | 12 (1.3%) |
| $17,500 to $19,999 | 19 (2.1%) | 72 (8.1%) |
| $20,000 to $22,499 | 0 (0.0%) | 47 (5.3%) |
| $22,500 to $24,999 | 0 (0.0%) | 73 (8.2%) |
| $25,000 to $29,999 | 82 (9.0%) | 58 (6.5%) |
| $30,000 to $34,999 | 30 (3.3%) | 12 (1.3%) |
| $35,000 to $39,999 | 7 (0.8%) | 20 (2.2%) |
| $40,000 to $44,999 | 23 (2.5%) | 22 (2.5%) |
| $45,000 to $49,999 | 29 (3.2%) | 89 (10.0%) |
| $50,000 to $54,999 | 7 (0.8%) | 34 (3.8%) |
| $55,000 to $64,999 | 66 (7.2%) | 37 (4.1%) |
| $65,000 to $74,999 | 85 (9.3%) | 19 (2.1%) |
| $75,000 to $99,999 | 142 (15.5%) | 27 (3.0%) |
| $100,000+ | 71 (7.8%) | 39 (4.4%) |
| Total | 913 (100.0%) | 894 (100.0%) |
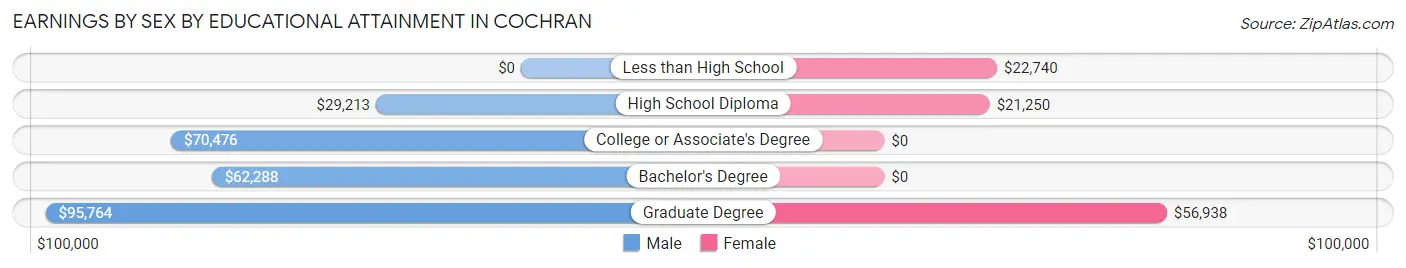
Earnings by Sex by Educational Attainment in Cochran
Average earnings in Cochran are $61,309 for men and $23,326 for women, a difference of 62.0%. Men with an educational attainment of graduate degree enjoy the highest average annual earnings of $95,764, while those with high school diploma education earn the least with $29,213. Women with an educational attainment of graduate degree earn the most with the average annual earnings of $56,938, while those with high school diploma education have the smallest earnings of $21,250.
| Educational Attainment | Male Income | Female Income |
| Less than High School | - | - |
| High School Diploma | $29,213 | $21,250 |
| College or Associate's Degree | $70,476 | $0 |
| Bachelor's Degree | $62,288 | $0 |
| Graduate Degree | $95,764 | $56,938 |
| Total | $61,309 | $23,326 |
Family Income in Cochran
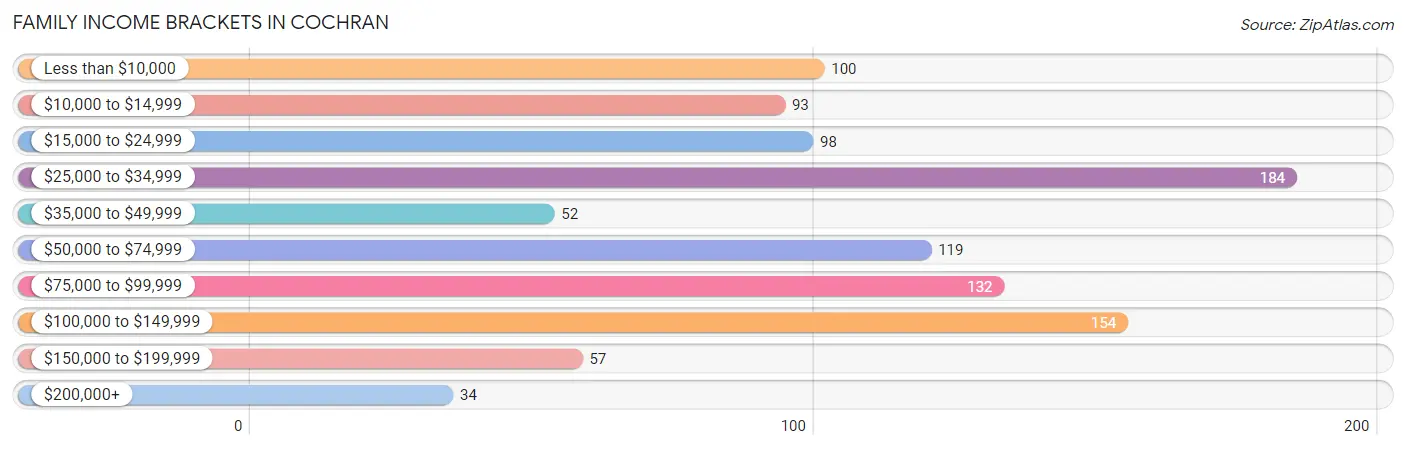
Family Income Brackets in Cochran
According to the Cochran family income data, there are 184 families falling into the $25,000 to $34,999 income range, which is the most common income bracket and makes up 18.0% of all families. Conversely, the $200,000+ income bracket is the least frequent group with only 34 families (3.3%) belonging to this category.
| Income Bracket | # Families | % Families |
| Less than $10,000 | 100 | 9.8% |
| $10,000 to $14,999 | 93 | 9.1% |
| $15,000 to $24,999 | 98 | 9.6% |
| $25,000 to $34,999 | 184 | 18.0% |
| $35,000 to $49,999 | 52 | 5.1% |
| $50,000 to $74,999 | 119 | 11.6% |
| $75,000 to $99,999 | 132 | 12.9% |
| $100,000 to $149,999 | 154 | 15.1% |
| $150,000 to $199,999 | 57 | 5.6% |
| $200,000+ | 34 | 3.3% |
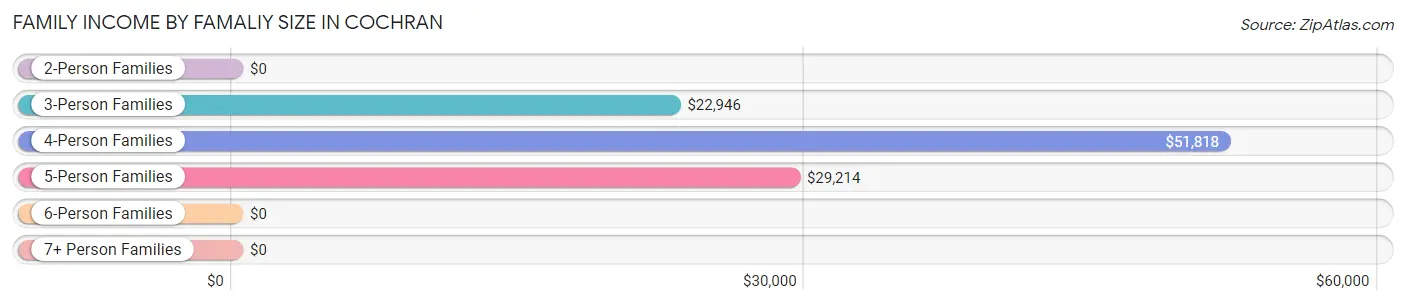
Family Income by Famaliy Size in Cochran
4-person families (302 | 29.5%) account for the highest median family income in Cochran with $51,818 per family, while 4-person families (302 | 29.5%) have the highest median income of $12,954 per family member.
| Income Bracket | # Families | Median Income |
| 2-Person Families | 426 (41.6%) | $0 |
| 3-Person Families | 183 (17.9%) | $22,946 |
| 4-Person Families | 302 (29.5%) | $51,818 |
| 5-Person Families | 80 (7.8%) | $29,214 |
| 6-Person Families | 0 (0.0%) | $0 |
| 7+ Person Families | 32 (3.1%) | $0 |
| Total | 1,023 (100.0%) | $48,826 |
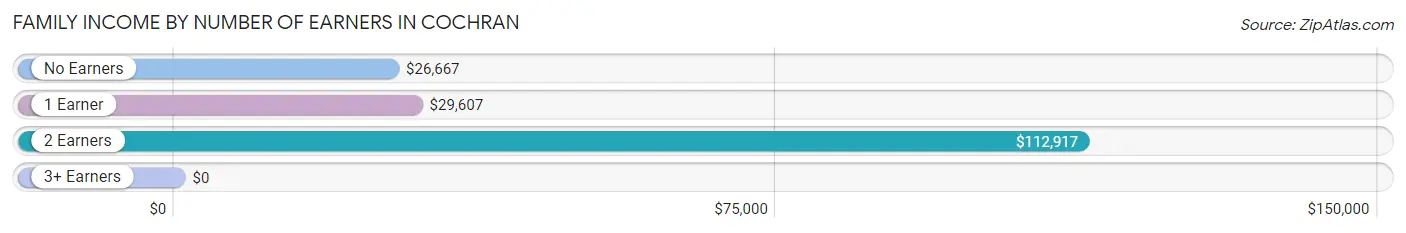
Family Income by Number of Earners in Cochran
| Number of Earners | # Families | Median Income |
| No Earners | 250 (24.4%) | $26,667 |
| 1 Earner | 447 (43.7%) | $29,607 |
| 2 Earners | 295 (28.8%) | $112,917 |
| 3+ Earners | 31 (3.0%) | $0 |
| Total | 1,023 (100.0%) | $48,826 |
Household Income in Cochran
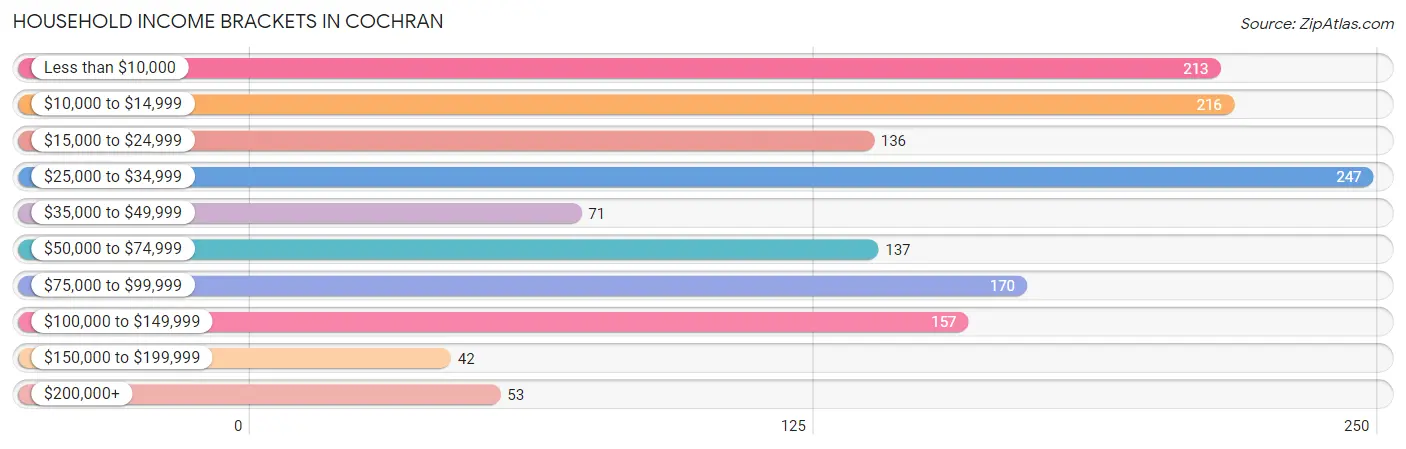
Household Income Brackets in Cochran
With 247 households falling in the category, the $25,000 to $34,999 income range is the most frequent in Cochran, accounting for 17.1% of all households. In contrast, only 42 households (2.9%) fall into the $150,000 to $199,999 income bracket, making it the least populous group.
| Income Bracket | # Households | % Households |
| Less than $10,000 | 213 | 14.8% |
| $10,000 to $14,999 | 216 | 15.0% |
| $15,000 to $24,999 | 136 | 9.4% |
| $25,000 to $34,999 | 247 | 17.1% |
| $35,000 to $49,999 | 71 | 4.9% |
| $50,000 to $74,999 | 137 | 9.5% |
| $75,000 to $99,999 | 170 | 11.8% |
| $100,000 to $149,999 | 157 | 10.9% |
| $150,000 to $199,999 | 42 | 2.9% |
| $200,000+ | 53 | 3.7% |
Household Income by Householder Age in Cochran
The median household income in Cochran is $31,326, with the highest median household income of $43,021 found in the 25 to 44 years age bracket for the primary householder. A total of 595 households (41.3%) fall into this category. Meanwhile, the 45 to 64 years age bracket for the primary householder has the lowest median household income of $0, with 325 households (22.5%) in this group.
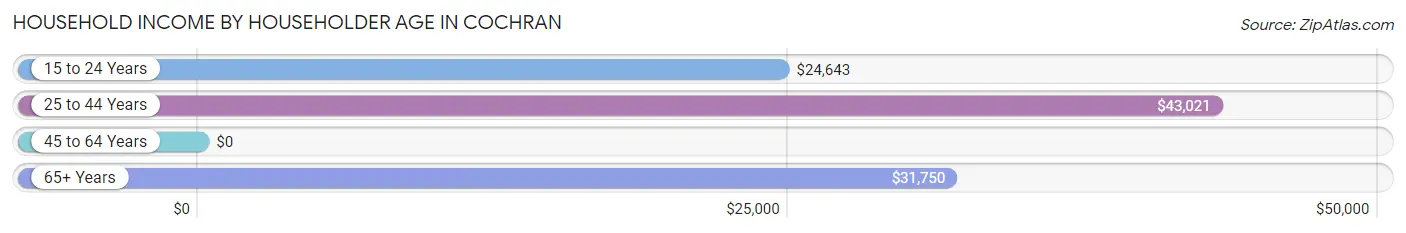
| Income Bracket | # Households | Median Income |
| 15 to 24 Years | 56 (3.9%) | $24,643 |
| 25 to 44 Years | 595 (41.3%) | $43,021 |
| 45 to 64 Years | 325 (22.5%) | $0 |
| 65+ Years | 466 (32.3%) | $31,750 |
| Total | 1,442 (100.0%) | $31,326 |
Poverty in Cochran
Income Below Poverty by Sex and Age in Cochran
With 24.3% poverty level for males and 31.6% for females among the residents of Cochran, 15 year old males and 12 to 14 year old females are the most vulnerable to poverty, with 31 males (100.0%) and 79 females (56.4%) in their respective age groups living below the poverty level.
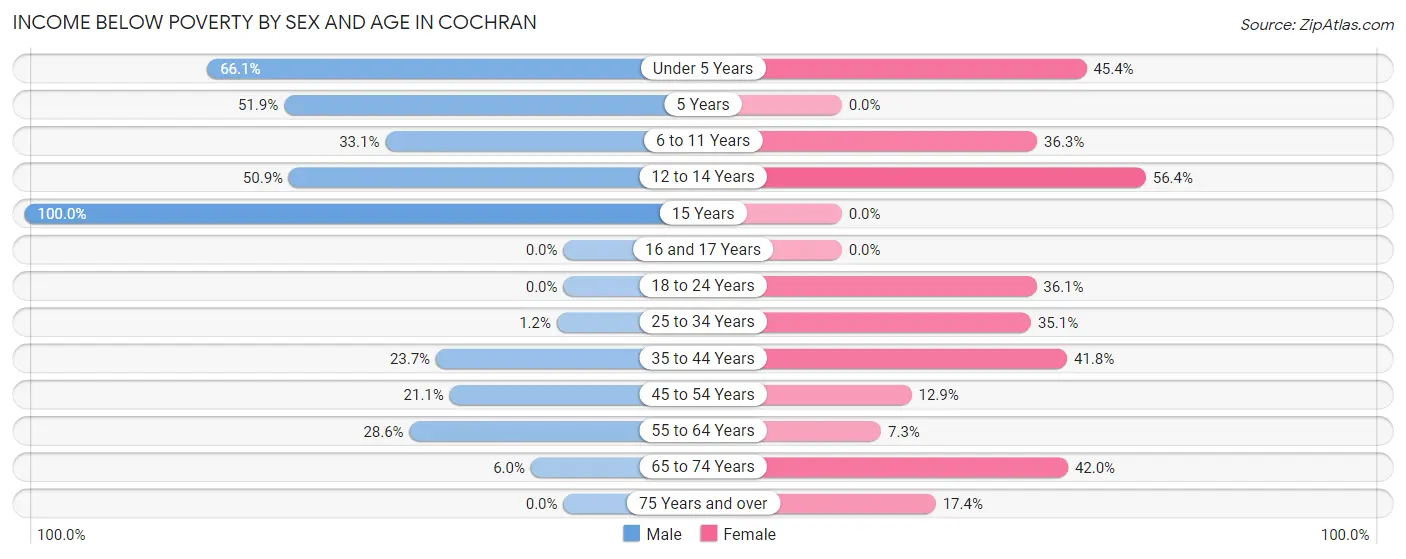
| Age Bracket | Male | Female |
| Under 5 Years | 78 (66.1%) | 84 (45.4%) |
| 5 Years | 28 (51.8%) | 0 (0.0%) |
| 6 to 11 Years | 82 (33.1%) | 58 (36.2%) |
| 12 to 14 Years | 27 (50.9%) | 79 (56.4%) |
| 15 Years | 31 (100.0%) | 0 (0.0%) |
| 16 and 17 Years | 0 (0.0%) | 0 (0.0%) |
| 18 to 24 Years | 0 (0.0%) | 65 (36.1%) |
| 25 to 34 Years | 1 (1.2%) | 118 (35.1%) |
| 35 to 44 Years | 83 (23.6%) | 120 (41.8%) |
| 45 to 54 Years | 61 (21.1%) | 22 (12.9%) |
| 55 to 64 Years | 46 (28.6%) | 20 (7.3%) |
| 65 to 74 Years | 9 (6.0%) | 89 (42.0%) |
| 75 Years and over | 0 (0.0%) | 15 (17.4%) |
| Total | 446 (24.3%) | 670 (31.6%) |
Income Above Poverty by Sex and Age in Cochran
According to the poverty statistics in Cochran, males aged 16 and 17 years and females aged 5 years are the age groups that are most secure financially, with 100.0% of males and 100.0% of females in these age groups living above the poverty line.
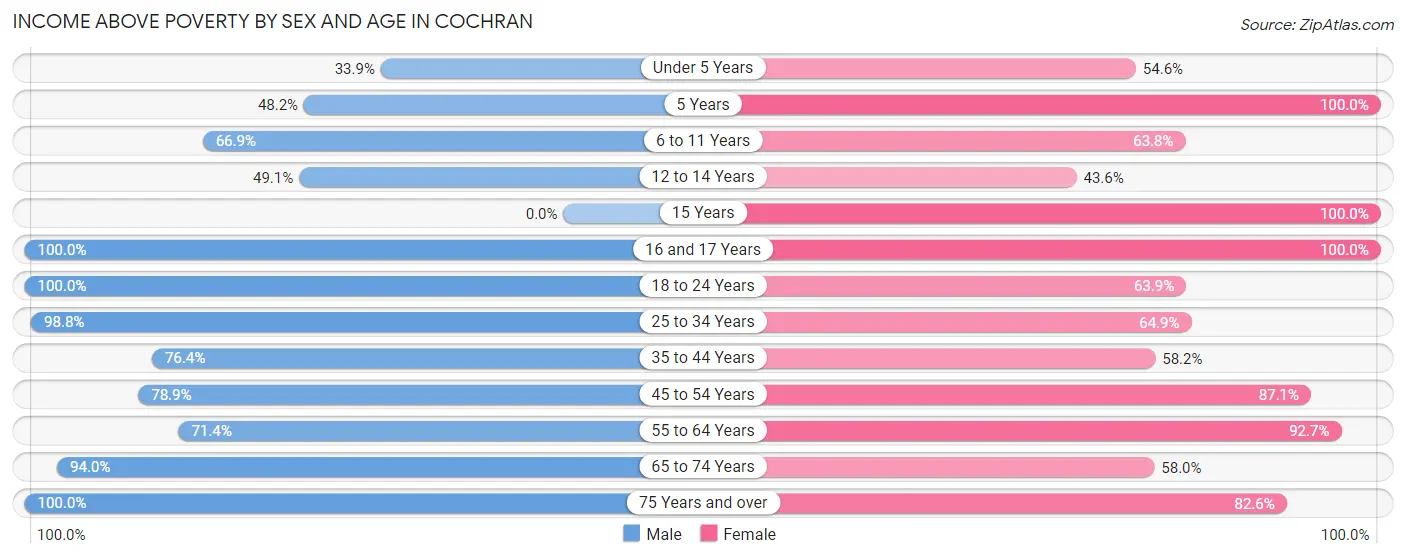
| Age Bracket | Male | Female |
| Under 5 Years | 40 (33.9%) | 101 (54.6%) |
| 5 Years | 26 (48.1%) | 19 (100.0%) |
| 6 to 11 Years | 166 (66.9%) | 102 (63.7%) |
| 12 to 14 Years | 26 (49.1%) | 61 (43.6%) |
| 15 Years | 0 (0.0%) | 10 (100.0%) |
| 16 and 17 Years | 30 (100.0%) | 61 (100.0%) |
| 18 to 24 Years | 133 (100.0%) | 115 (63.9%) |
| 25 to 34 Years | 81 (98.8%) | 218 (64.9%) |
| 35 to 44 Years | 268 (76.3%) | 167 (58.2%) |
| 45 to 54 Years | 228 (78.9%) | 148 (87.1%) |
| 55 to 64 Years | 115 (71.4%) | 254 (92.7%) |
| 65 to 74 Years | 140 (94.0%) | 123 (58.0%) |
| 75 Years and over | 134 (100.0%) | 71 (82.6%) |
| Total | 1,387 (75.7%) | 1,450 (68.4%) |
Income Below Poverty Among Married-Couple Families in Cochran
The poverty statistics for married-couple families in Cochran show that 12.8% or 68 of the total 530 families live below the poverty line. Families with 1 or 2 children have the highest poverty rate of 21.7%, comprising of 59 families. On the other hand, families with 3 or 4 children have the lowest poverty rate of 0.0%, which includes 0 families.
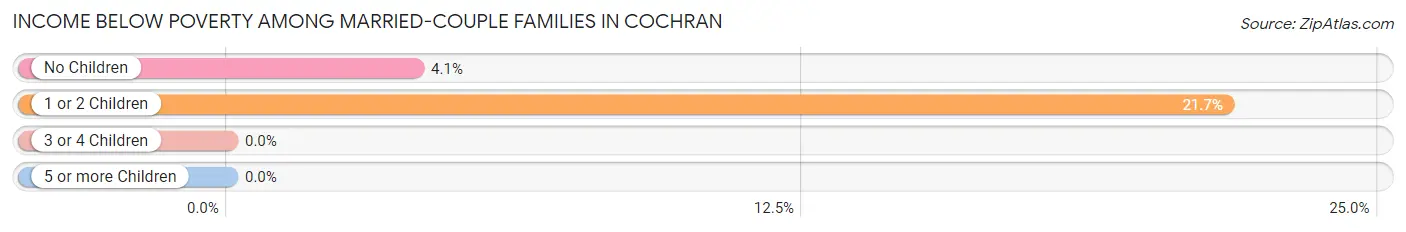
| Children | Above Poverty | Below Poverty |
| No Children | 213 (96.0%) | 9 (4.1%) |
| 1 or 2 Children | 213 (78.3%) | 59 (21.7%) |
| 3 or 4 Children | 4 (100.0%) | 0 (0.0%) |
| 5 or more Children | 32 (100.0%) | 0 (0.0%) |
| Total | 462 (87.2%) | 68 (12.8%) |
Income Below Poverty Among Single-Parent Households in Cochran
According to the poverty data in Cochran, 32.5% or 61 single-father households and 50.2% or 153 single-mother households are living below the poverty line. Among single-father households, those with 3 or 4 children have the highest poverty rate, with 61 households (100.0%) experiencing poverty. Likewise, among single-mother households, those with no children have the highest poverty rate, with 10 households (100.0%) falling below the poverty line.
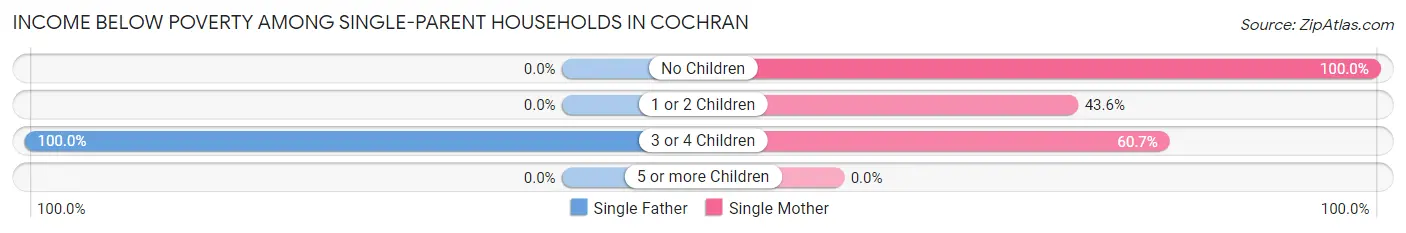
| Children | Single Father | Single Mother |
| No Children | 0 (0.0%) | 10 (100.0%) |
| 1 or 2 Children | 0 (0.0%) | 92 (43.6%) |
| 3 or 4 Children | 61 (100.0%) | 51 (60.7%) |
| 5 or more Children | 0 (0.0%) | 0 (0.0%) |
| Total | 61 (32.5%) | 153 (50.2%) |
Income Below Poverty Among Married-Couple vs Single-Parent Households in Cochran
The poverty data for Cochran shows that 68 of the married-couple family households (12.8%) and 214 of the single-parent households (43.4%) are living below the poverty level. Within the married-couple family households, those with 1 or 2 children have the highest poverty rate, with 59 households (21.7%) falling below the poverty line. Among the single-parent households, those with 3 or 4 children have the highest poverty rate, with 112 household (77.2%) living below poverty.
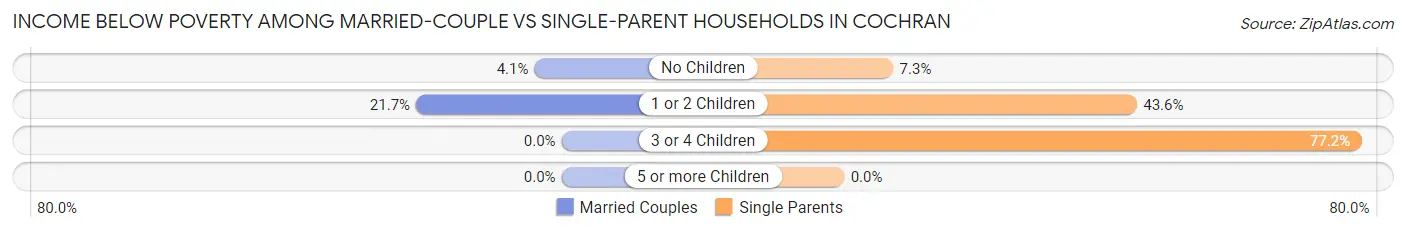
| Children | Married-Couple Families | Single-Parent Households |
| No Children | 9 (4.1%) | 10 (7.3%) |
| 1 or 2 Children | 59 (21.7%) | 92 (43.6%) |
| 3 or 4 Children | 0 (0.0%) | 112 (77.2%) |
| 5 or more Children | 0 (0.0%) | 0 (0.0%) |
| Total | 68 (12.8%) | 214 (43.4%) |
Race in Cochran
The most populous races in Cochran are Black / African American (2,450 | 50.3%), White / Caucasian (2,169 | 44.6%), and Two or more Races (128 | 2.6%).
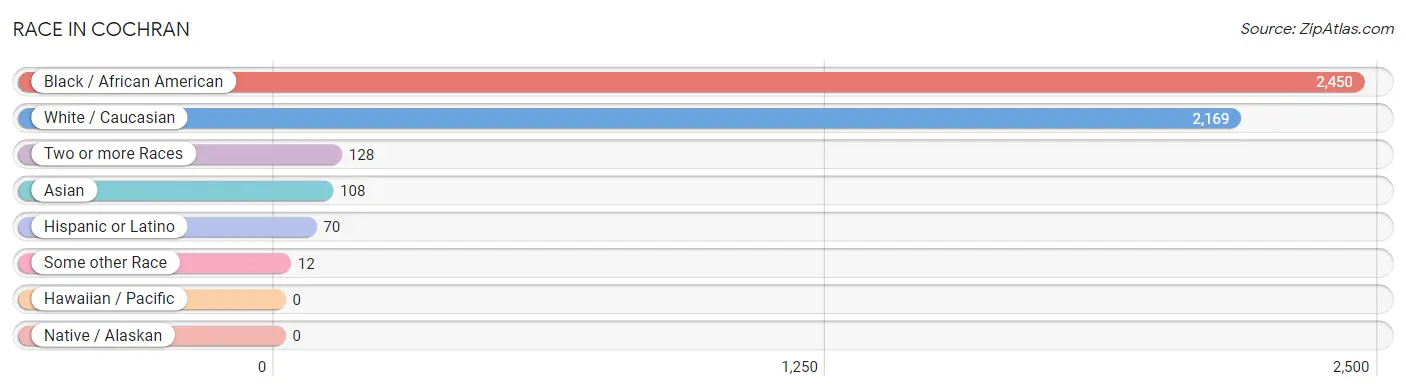
| Race | # Population | % Population |
| Asian | 108 | 2.2% |
| Black / African American | 2,450 | 50.3% |
| Hawaiian / Pacific | 0 | 0.0% |
| Hispanic or Latino | 70 | 1.4% |
| Native / Alaskan | 0 | 0.0% |
| White / Caucasian | 2,169 | 44.6% |
| Two or more Races | 128 | 2.6% |
| Some other Race | 12 | 0.3% |
| Total | 4,867 | 100.0% |
Ancestry in Cochran
The most populous ancestries reported in Cochran are American (425 | 8.7%), English (340 | 7.0%), Irish (115 | 2.4%), Indian (Asian) (81 | 1.7%), and Korean (62 | 1.3%), together accounting for 21.0% of all Cochran residents.
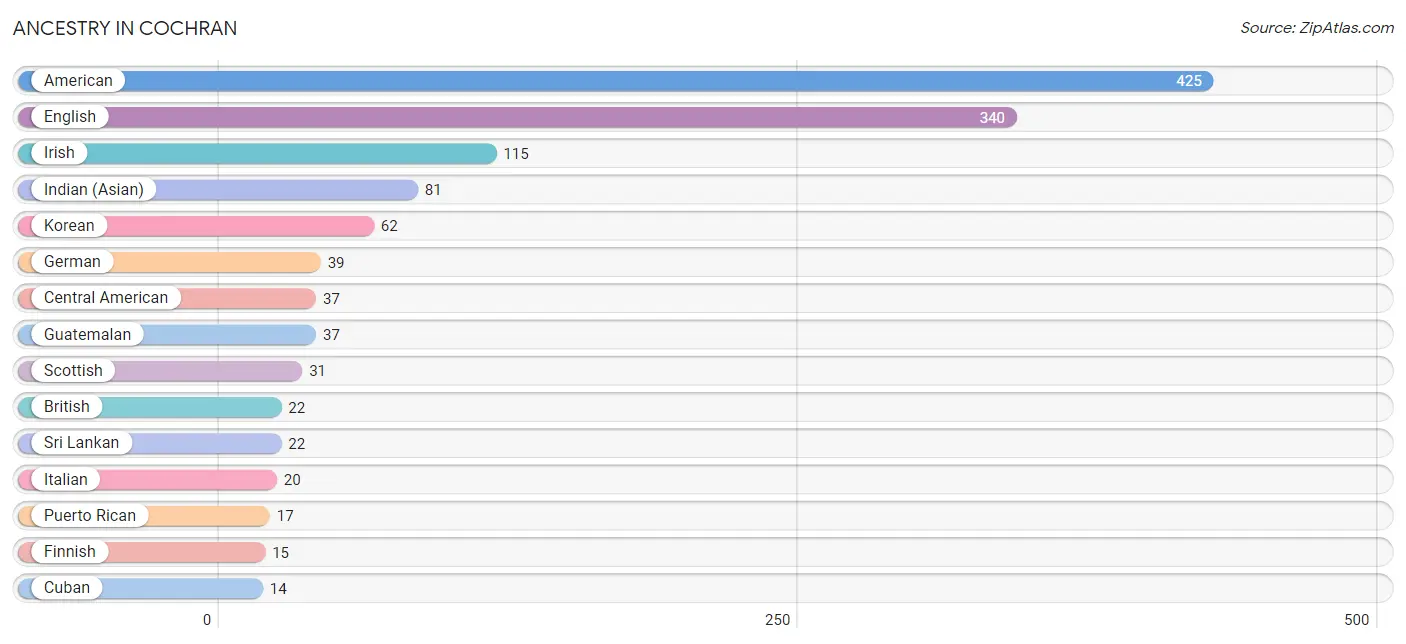
| Ancestry | # Population | % Population |
| African | 5 | 0.1% |
| American | 425 | 8.7% |
| British | 22 | 0.4% |
| British West Indian | 5 | 0.1% |
| Central American | 37 | 0.8% |
| Cuban | 14 | 0.3% |
| Czech | 5 | 0.1% |
| Dutch | 7 | 0.1% |
| English | 340 | 7.0% |
| Finnish | 15 | 0.3% |
| French | 8 | 0.2% |
| German | 39 | 0.8% |
| Guatemalan | 37 | 0.8% |
| Haitian | 6 | 0.1% |
| Indian (Asian) | 81 | 1.7% |
| Iranian | 6 | 0.1% |
| Irish | 115 | 2.4% |
| Italian | 20 | 0.4% |
| Korean | 62 | 1.3% |
| Northern European | 6 | 0.1% |
| Polish | 11 | 0.2% |
| Portuguese | 3 | 0.1% |
| Puerto Rican | 17 | 0.4% |
| Scandinavian | 5 | 0.1% |
| Scotch-Irish | 4 | 0.1% |
| Scottish | 31 | 0.6% |
| Sri Lankan | 22 | 0.4% |
| Subsaharan African | 5 | 0.1% |
| Welsh | 11 | 0.2% | View All 29 Rows |
Immigrants in Cochran
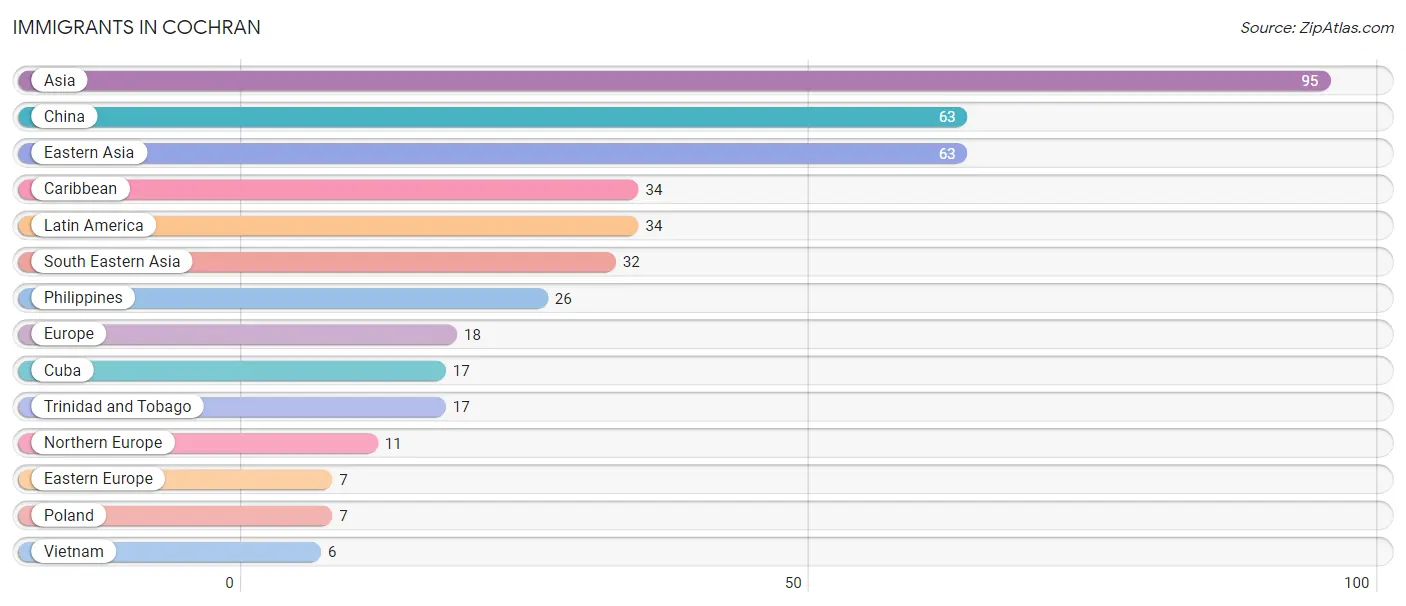
The most numerous immigrant groups reported in Cochran came from Asia (95 | 1.9%), China (63 | 1.3%), Eastern Asia (63 | 1.3%), Caribbean (34 | 0.7%), and Latin America (34 | 0.7%), together accounting for 5.9% of all Cochran residents.
| Immigration Origin | # Population | % Population |
| Asia | 95 | 1.9% |
| Caribbean | 34 | 0.7% |
| China | 63 | 1.3% |
| Cuba | 17 | 0.4% |
| Eastern Asia | 63 | 1.3% |
| Eastern Europe | 7 | 0.1% |
| Europe | 18 | 0.4% |
| Latin America | 34 | 0.7% |
| Northern Europe | 11 | 0.2% |
| Philippines | 26 | 0.5% |
| Poland | 7 | 0.1% |
| South Eastern Asia | 32 | 0.7% |
| Trinidad and Tobago | 17 | 0.4% |
| Vietnam | 6 | 0.1% | View All 14 Rows |
Sex and Age in Cochran
Sex and Age in Cochran
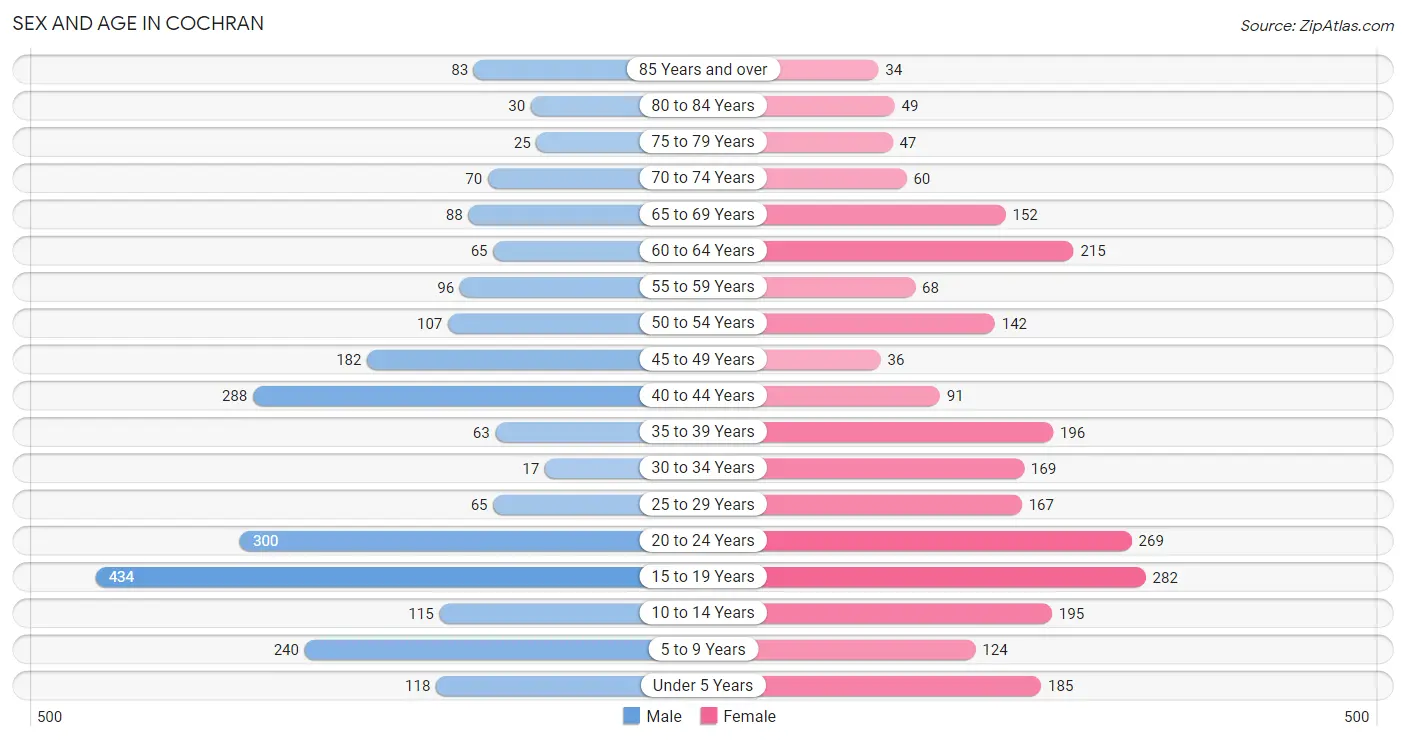
The most populous age groups in Cochran are 15 to 19 Years (434 | 18.2%) for men and 15 to 19 Years (282 | 11.4%) for women.
| Age Bracket | Male | Female |
| Under 5 Years | 118 (5.0%) | 185 (7.5%) |
| 5 to 9 Years | 240 (10.1%) | 124 (5.0%) |
| 10 to 14 Years | 115 (4.8%) | 195 (7.9%) |
| 15 to 19 Years | 434 (18.2%) | 282 (11.4%) |
| 20 to 24 Years | 300 (12.6%) | 269 (10.8%) |
| 25 to 29 Years | 65 (2.7%) | 167 (6.7%) |
| 30 to 34 Years | 17 (0.7%) | 169 (6.8%) |
| 35 to 39 Years | 63 (2.6%) | 196 (7.9%) |
| 40 to 44 Years | 288 (12.1%) | 91 (3.7%) |
| 45 to 49 Years | 182 (7.6%) | 36 (1.5%) |
| 50 to 54 Years | 107 (4.5%) | 142 (5.7%) |
| 55 to 59 Years | 96 (4.0%) | 68 (2.7%) |
| 60 to 64 Years | 65 (2.7%) | 215 (8.7%) |
| 65 to 69 Years | 88 (3.7%) | 152 (6.1%) |
| 70 to 74 Years | 70 (2.9%) | 60 (2.4%) |
| 75 to 79 Years | 25 (1.1%) | 47 (1.9%) |
| 80 to 84 Years | 30 (1.3%) | 49 (2.0%) |
| 85 Years and over | 83 (3.5%) | 34 (1.4%) |
| Total | 2,386 (100.0%) | 2,481 (100.0%) |
Families and Households in Cochran
Median Family Size in Cochran
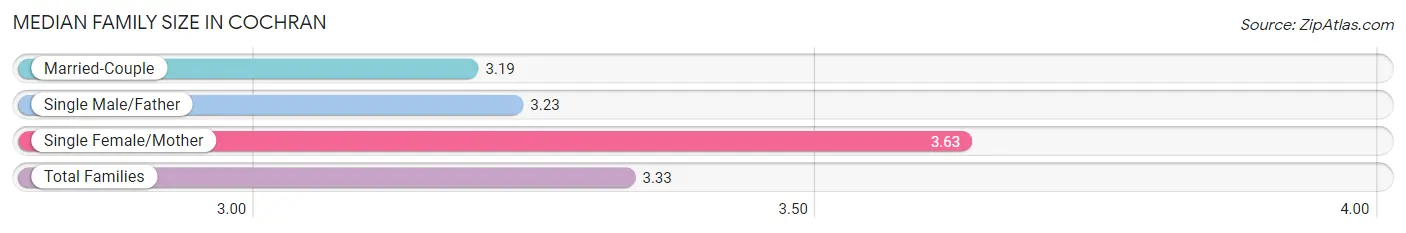
The median family size in Cochran is 3.33 persons per family, with single female/mother families (305 | 29.8%) accounting for the largest median family size of 3.63 persons per family. On the other hand, married-couple families (530 | 51.8%) represent the smallest median family size with 3.19 persons per family.
| Family Type | # Families | Family Size |
| Married-Couple | 530 (51.8%) | 3.19 |
| Single Male/Father | 188 (18.4%) | 3.23 |
| Single Female/Mother | 305 (29.8%) | 3.63 |
| Total Families | 1,023 (100.0%) | 3.33 |
Median Household Size in Cochran
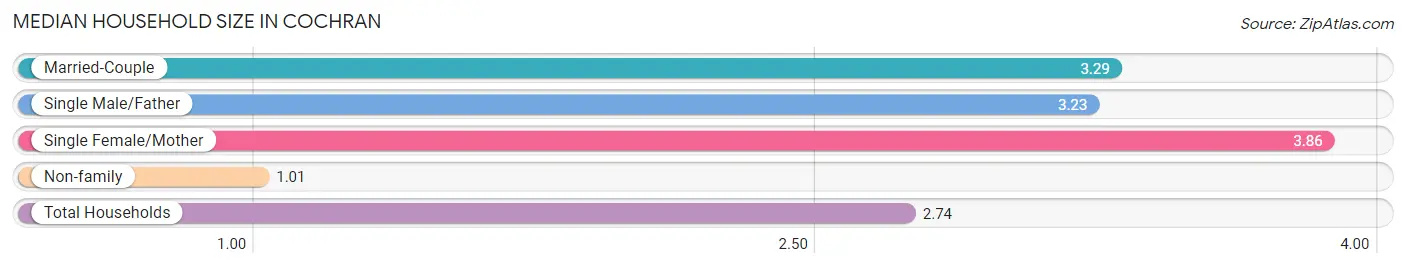
The median household size in Cochran is 2.74 persons per household, with single female/mother households (305 | 21.1%) accounting for the largest median household size of 3.86 persons per household. non-family households (419 | 29.1%) represent the smallest median household size with 1.01 persons per household.
| Household Type | # Households | Household Size |
| Married-Couple | 530 (36.7%) | 3.29 |
| Single Male/Father | 188 (13.0%) | 3.23 |
| Single Female/Mother | 305 (21.1%) | 3.86 |
| Non-family | 419 (29.1%) | 1.01 |
| Total Households | 1,442 (100.0%) | 2.74 |
Household Size by Marriage Status in Cochran
Out of a total of 1,442 households in Cochran, 1,023 (70.9%) are family households, while 419 (29.1%) are nonfamily households. The most numerous type of family households are 2-person households, comprising 426, and the most common type of nonfamily households are 1-person households, comprising 414.
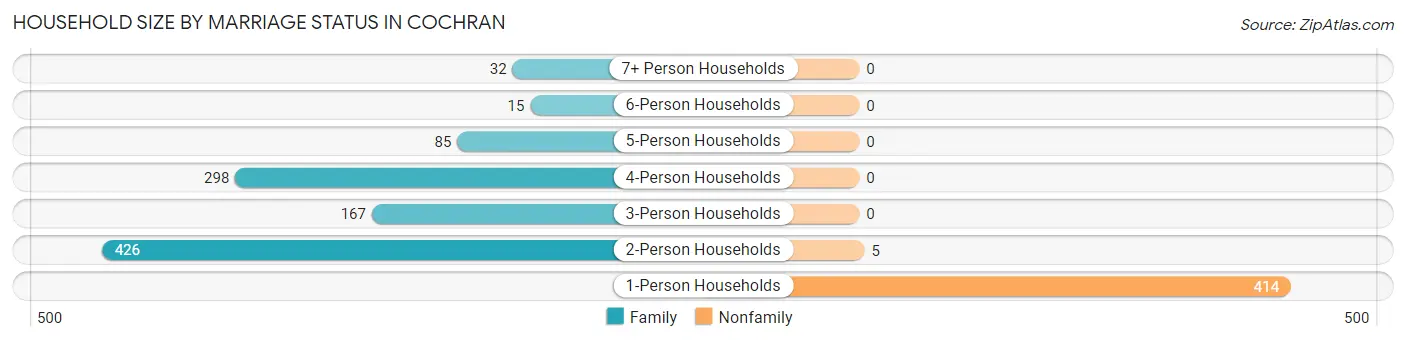
| Household Size | Family Households | Nonfamily Households |
| 1-Person Households | - | 414 (28.7%) |
| 2-Person Households | 426 (29.5%) | 5 (0.4%) |
| 3-Person Households | 167 (11.6%) | 0 (0.0%) |
| 4-Person Households | 298 (20.7%) | 0 (0.0%) |
| 5-Person Households | 85 (5.9%) | 0 (0.0%) |
| 6-Person Households | 15 (1.0%) | 0 (0.0%) |
| 7+ Person Households | 32 (2.2%) | 0 (0.0%) |
| Total | 1,023 (70.9%) | 419 (29.1%) |
Female Fertility in Cochran
Fertility by Age in Cochran
Average fertility rate in Cochran is 142.0 births per 1,000 women. Women in the age bracket of 35 to 50 years have the highest fertility rate with 280.0 births per 1,000 women. Women in the age bracket of 35 to 50 years acount for 54.6% of all women with births.
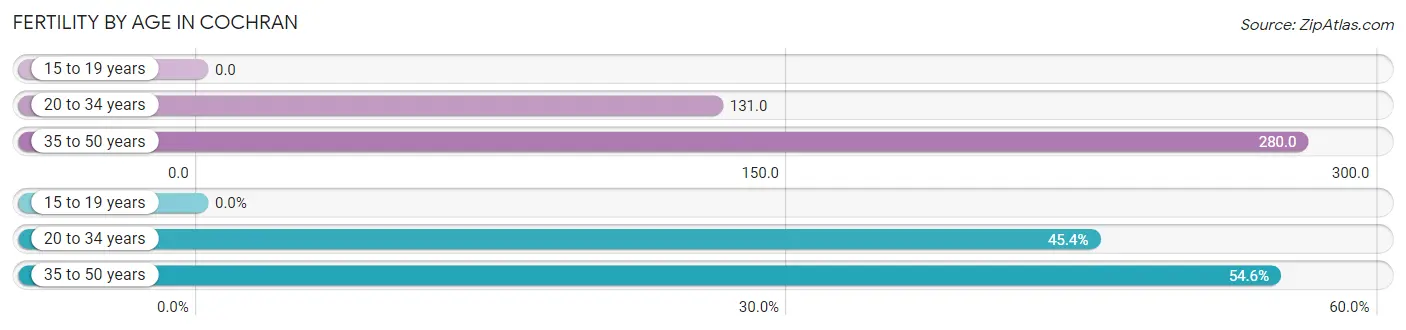
| Age Bracket | Women with Births | Births / 1,000 Women |
| 15 to 19 years | 0 (0.0%) | 0.0 |
| 20 to 34 years | 79 (45.4%) | 131.0 |
| 35 to 50 years | 95 (54.6%) | 280.0 |
| Total | 174 (100.0%) | 142.0 |
Fertility by Age by Marriage Status in Cochran
54.6% of women with births (174) in Cochran are married. The highest percentage of unmarried women with births falls into 20 to 34 years age bracket with 100.0% of them unmarried at the time of birth, while the lowest percentage of unmarried women with births belong to 35 to 50 years age bracket with 0.0% of them unmarried.
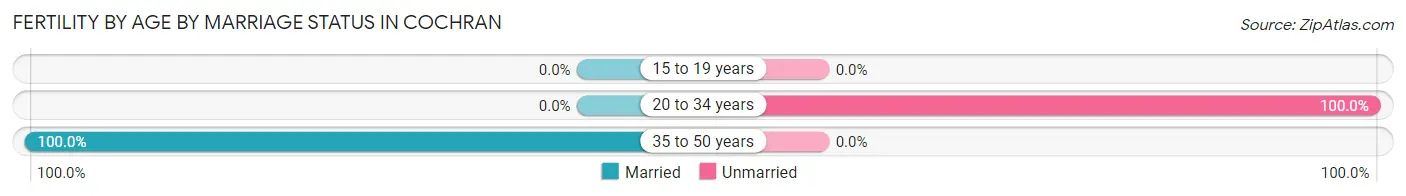
| Age Bracket | Married | Unmarried |
| 15 to 19 years | 0 (0.0%) | 0 (0.0%) |
| 20 to 34 years | 0 (0.0%) | 79 (100.0%) |
| 35 to 50 years | 95 (100.0%) | 0 (0.0%) |
| Total | 95 (54.6%) | 79 (45.4%) |
Fertility by Education in Cochran
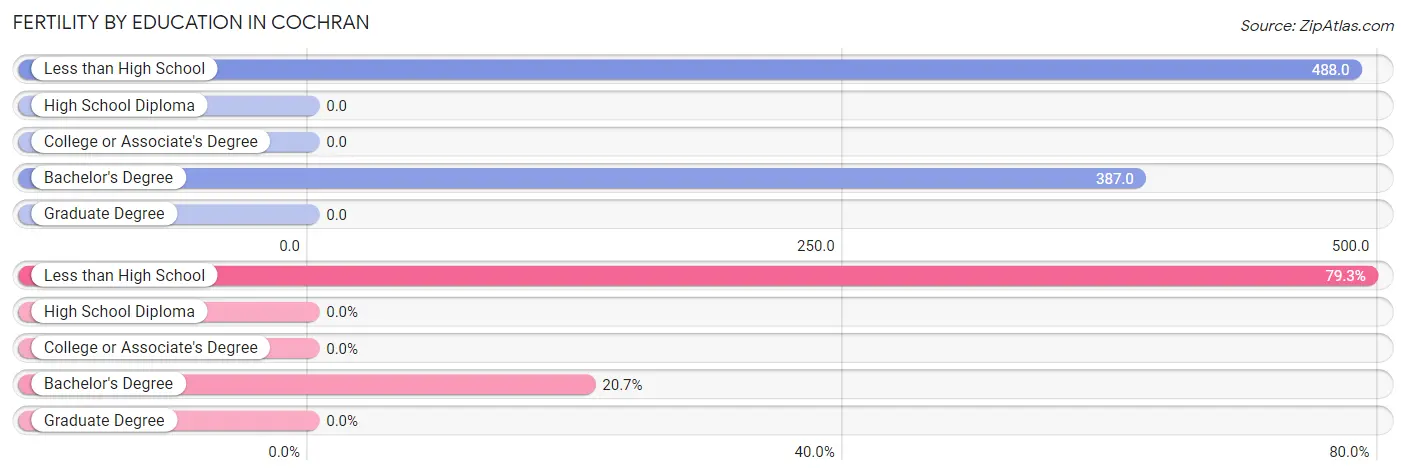
| Educational Attainment | Women with Births | Births / 1,000 Women |
| Less than High School | 138 (79.3%) | 488.0 |
| High School Diploma | 0 (0.0%) | 0.0 |
| College or Associate's Degree | 0 (0.0%) | 0.0 |
| Bachelor's Degree | 36 (20.7%) | 387.0 |
| Graduate Degree | 0 (0.0%) | 0.0 |
| Total | 174 (100.0%) | 142.0 |
Fertility by Education by Marriage Status in Cochran
45.4% of women with births in Cochran are unmarried. Women with the educational attainment of bachelor's degree are most likely to be married with 100.0% of them married at childbirth, while women with the educational attainment of less than high school are least likely to be married with 57.3% of them unmarried at childbirth.
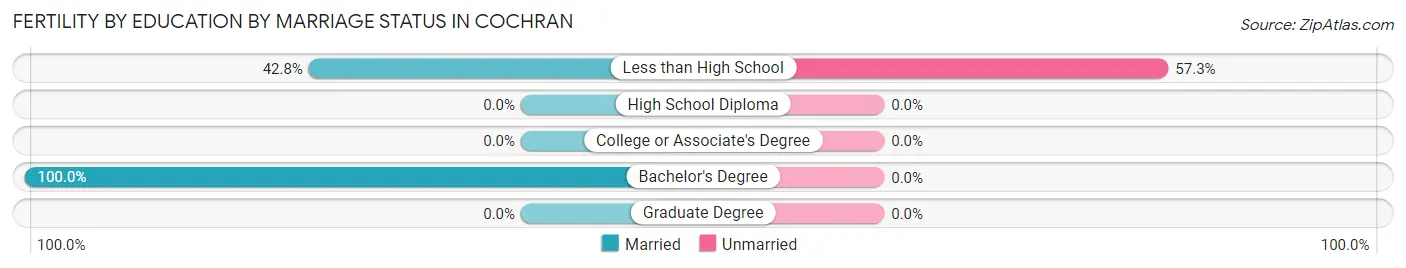
| Educational Attainment | Married | Unmarried |
| Less than High School | 59 (42.7%) | 79 (57.3%) |
| High School Diploma | 0 (0.0%) | 0 (0.0%) |
| College or Associate's Degree | 0 (0.0%) | 0 (0.0%) |
| Bachelor's Degree | 36 (100.0%) | 0 (0.0%) |
| Graduate Degree | 0 (0.0%) | 0 (0.0%) |
| Total | 95 (54.6%) | 79 (45.4%) |
Employment Characteristics in Cochran
Employment by Class of Employer in Cochran
Among the 1,590 employed individuals in Cochran, private company employees (909 | 57.2%), state government employees (222 | 14.0%), and federal government employees (190 | 11.9%) make up the most common classes of employment.
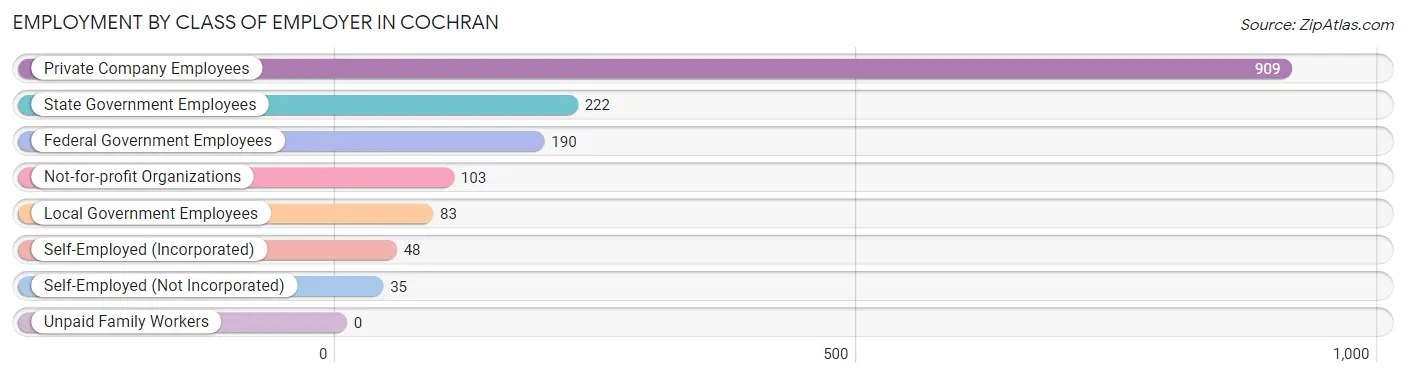
| Employer Class | # Employees | % Employees |
| Private Company Employees | 909 | 57.2% |
| Self-Employed (Incorporated) | 48 | 3.0% |
| Self-Employed (Not Incorporated) | 35 | 2.2% |
| Not-for-profit Organizations | 103 | 6.5% |
| Local Government Employees | 83 | 5.2% |
| State Government Employees | 222 | 14.0% |
| Federal Government Employees | 190 | 11.9% |
| Unpaid Family Workers | 0 | 0.0% |
| Total | 1,590 | 100.0% |
Employment Status by Age in Cochran
According to the labor force statistics for Cochran, out of the total population over 16 years of age (3,849), 47.6% or 1,832 individuals are in the labor force, with 10.5% or 192 of them unemployed. The age group with the highest labor force participation rate is 30 to 34 years, with 95.7% or 178 individuals in the labor force. Within the labor force, the 16 to 19 years age range has the highest percentage of unemployed individuals, with 22.9% or 22 of them being unemployed.
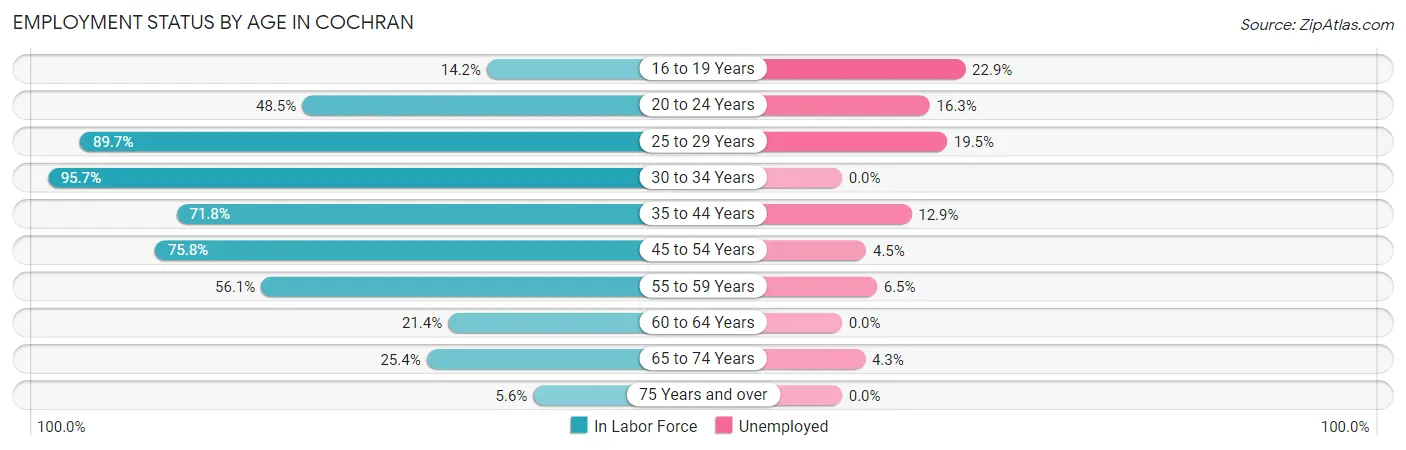
| Age Bracket | In Labor Force | Unemployed |
| 16 to 19 Years | 96 (14.2%) | 22 (22.9%) |
| 20 to 24 Years | 276 (48.5%) | 45 (16.3%) |
| 25 to 29 Years | 208 (89.7%) | 41 (19.5%) |
| 30 to 34 Years | 178 (95.7%) | 0 (0.0%) |
| 35 to 44 Years | 458 (71.8%) | 59 (12.9%) |
| 45 to 54 Years | 354 (75.8%) | 16 (4.5%) |
| 55 to 59 Years | 92 (56.1%) | 6 (6.5%) |
| 60 to 64 Years | 60 (21.4%) | 0 (0.0%) |
| 65 to 74 Years | 94 (25.4%) | 4 (4.3%) |
| 75 Years and over | 15 (5.6%) | 0 (0.0%) |
| Total | 1,832 (47.6%) | 192 (10.5%) |
Employment Status by Educational Attainment in Cochran
According to labor force statistics for Cochran, 68.6% of individuals (1,349) out of the total population between 25 and 64 years of age (1,967) are in the labor force, with 8.9% or 120 of them being unemployed. The group with the highest labor force participation rate are those with the educational attainment of bachelor's degree or higher, with 87.9% or 369 individuals in the labor force. Within the labor force, individuals with less than high school education have the highest percentage of unemployment, with 51.7% or 75 of them being unemployed.
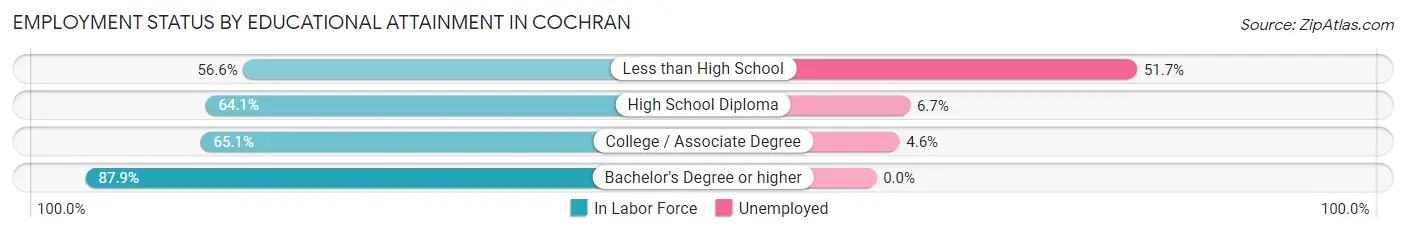
| Educational Attainment | In Labor Force | Unemployed |
| Less than High School | 145 (56.6%) | 132 (51.7%) |
| High School Diploma | 297 (64.1%) | 31 (6.7%) |
| College / Associate Degree | 539 (65.1%) | 38 (4.6%) |
| Bachelor's Degree or higher | 369 (87.9%) | 0 (0.0%) |
| Total | 1,349 (68.6%) | 175 (8.9%) |
Employment Occupations by Sex in Cochran
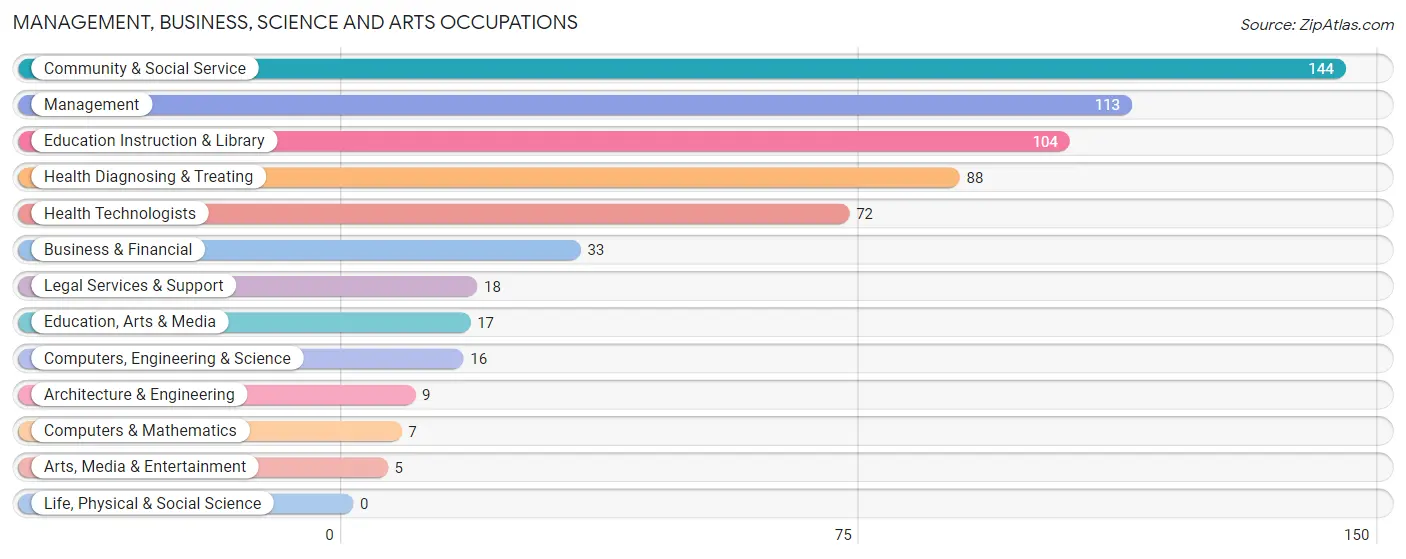
Management, Business, Science and Arts Occupations
The most common Management, Business, Science and Arts occupations in Cochran are Community & Social Service (144 | 8.8%), Management (113 | 6.9%), Education Instruction & Library (104 | 6.4%), Health Diagnosing & Treating (88 | 5.4%), and Health Technologists (72 | 4.4%).
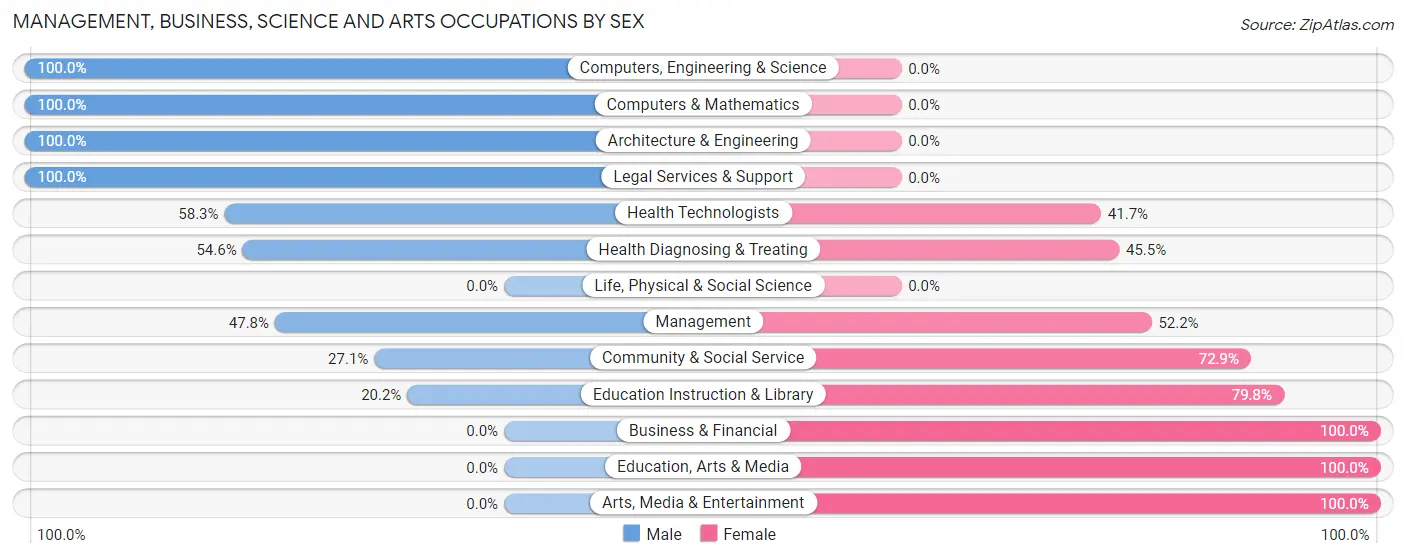
Management, Business, Science and Arts Occupations by Sex
Within the Management, Business, Science and Arts occupations in Cochran, the most male-oriented occupations are Computers, Engineering & Science (100.0%), Computers & Mathematics (100.0%), and Architecture & Engineering (100.0%), while the most female-oriented occupations are Business & Financial (100.0%), Education, Arts & Media (100.0%), and Arts, Media & Entertainment (100.0%).
| Occupation | Male | Female |
| Management | 54 (47.8%) | 59 (52.2%) |
| Business & Financial | 0 (0.0%) | 33 (100.0%) |
| Computers, Engineering & Science | 16 (100.0%) | 0 (0.0%) |
| Computers & Mathematics | 7 (100.0%) | 0 (0.0%) |
| Architecture & Engineering | 9 (100.0%) | 0 (0.0%) |
| Life, Physical & Social Science | 0 (0.0%) | 0 (0.0%) |
| Community & Social Service | 39 (27.1%) | 105 (72.9%) |
| Education, Arts & Media | 0 (0.0%) | 17 (100.0%) |
| Legal Services & Support | 18 (100.0%) | 0 (0.0%) |
| Education Instruction & Library | 21 (20.2%) | 83 (79.8%) |
| Arts, Media & Entertainment | 0 (0.0%) | 5 (100.0%) |
| Health Diagnosing & Treating | 48 (54.5%) | 40 (45.5%) |
| Health Technologists | 42 (58.3%) | 30 (41.7%) |
| Total (Category) | 157 (39.9%) | 237 (60.2%) |
| Total (Overall) | 813 (49.8%) | 819 (50.2%) |
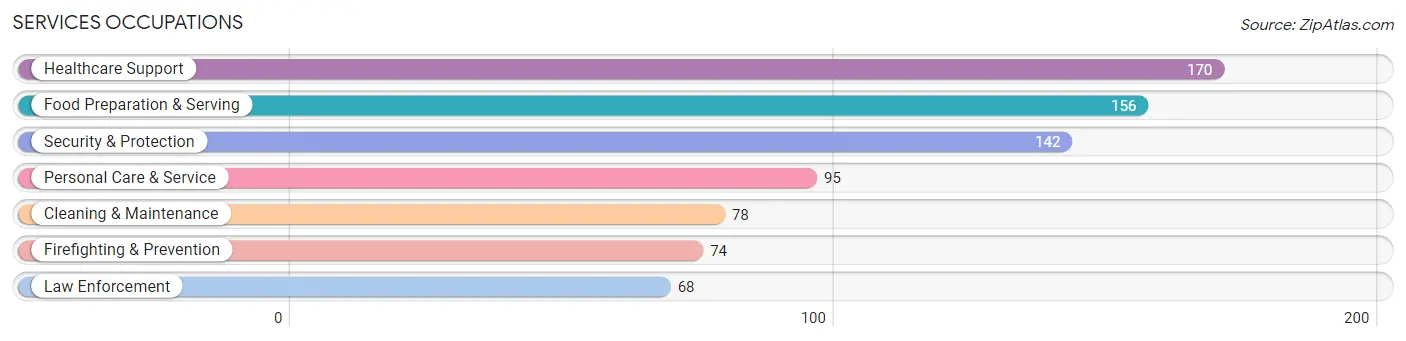
Services Occupations
The most common Services occupations in Cochran are Healthcare Support (170 | 10.4%), Food Preparation & Serving (156 | 9.6%), Security & Protection (142 | 8.7%), Personal Care & Service (95 | 5.8%), and Cleaning & Maintenance (78 | 4.8%).
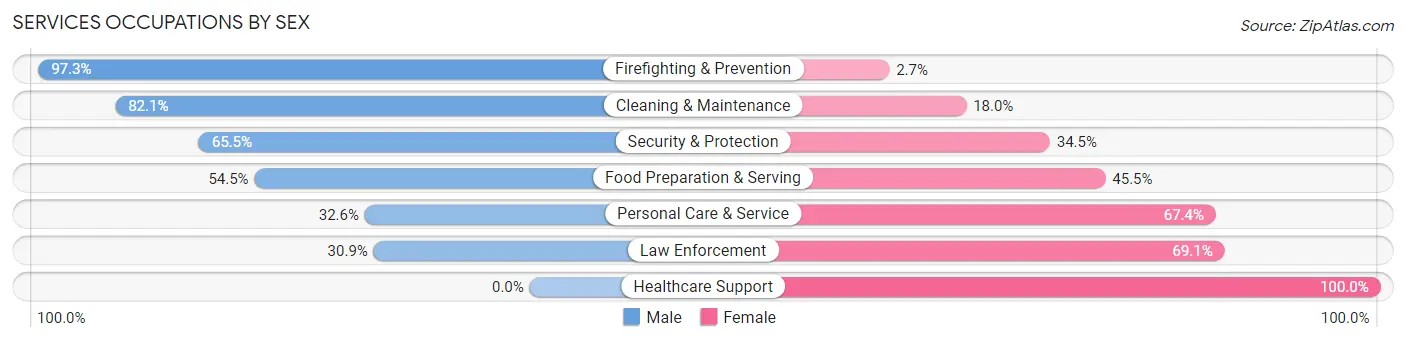
Services Occupations by Sex
Within the Services occupations in Cochran, the most male-oriented occupations are Firefighting & Prevention (97.3%), Cleaning & Maintenance (82.1%), and Security & Protection (65.5%), while the most female-oriented occupations are Healthcare Support (100.0%), Law Enforcement (69.1%), and Personal Care & Service (67.4%).
| Occupation | Male | Female |
| Healthcare Support | 0 (0.0%) | 170 (100.0%) |
| Security & Protection | 93 (65.5%) | 49 (34.5%) |
| Firefighting & Prevention | 72 (97.3%) | 2 (2.7%) |
| Law Enforcement | 21 (30.9%) | 47 (69.1%) |
| Food Preparation & Serving | 85 (54.5%) | 71 (45.5%) |
| Cleaning & Maintenance | 64 (82.1%) | 14 (17.9%) |
| Personal Care & Service | 31 (32.6%) | 64 (67.4%) |
| Total (Category) | 273 (42.6%) | 368 (57.4%) |
| Total (Overall) | 813 (49.8%) | 819 (50.2%) |
Sales and Office Occupations
The most common Sales and Office occupations in Cochran are Sales & Related (161 | 9.9%), and Office & Administration (117 | 7.2%).
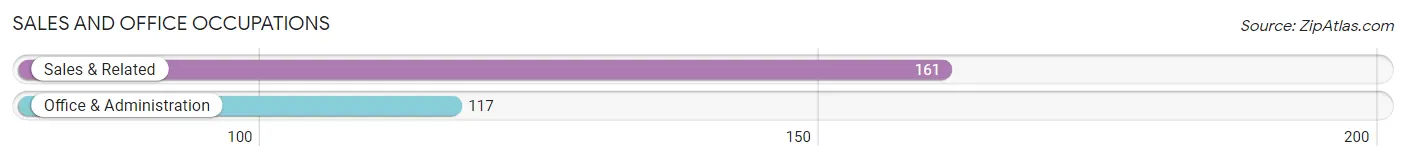
Sales and Office Occupations by Sex
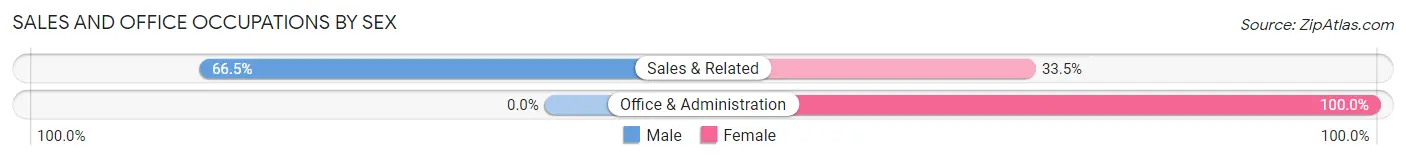
| Occupation | Male | Female |
| Sales & Related | 107 (66.5%) | 54 (33.5%) |
| Office & Administration | 0 (0.0%) | 117 (100.0%) |
| Total (Category) | 107 (38.5%) | 171 (61.5%) |
| Total (Overall) | 813 (49.8%) | 819 (50.2%) |
Natural Resources, Construction and Maintenance Occupations
The most common Natural Resources, Construction and Maintenance occupations in Cochran are Installation, Maintenance & Repair (84 | 5.1%), and Construction & Extraction (53 | 3.3%).
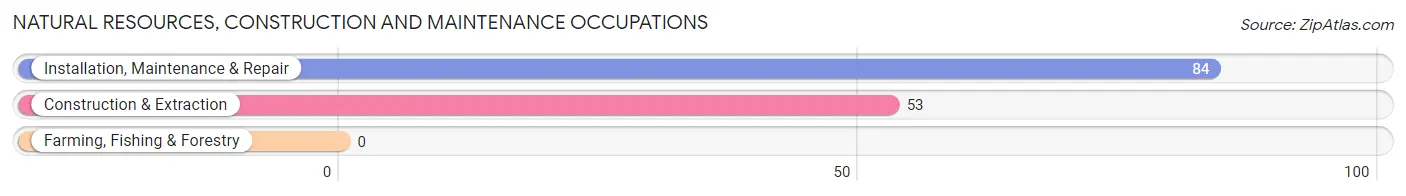
Natural Resources, Construction and Maintenance Occupations by Sex
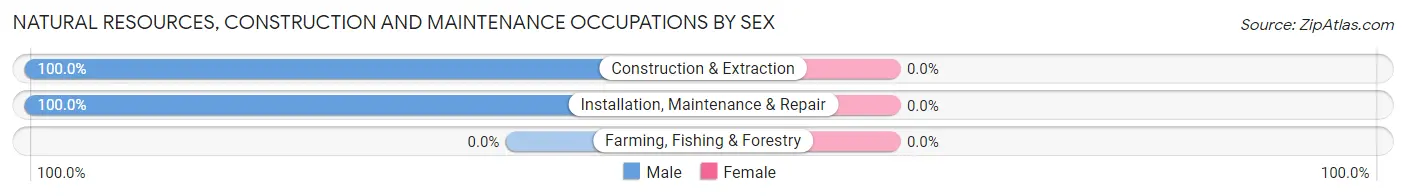
| Occupation | Male | Female |
| Farming, Fishing & Forestry | 0 (0.0%) | 0 (0.0%) |
| Construction & Extraction | 53 (100.0%) | 0 (0.0%) |
| Installation, Maintenance & Repair | 84 (100.0%) | 0 (0.0%) |
| Total (Category) | 137 (100.0%) | 0 (0.0%) |
| Total (Overall) | 813 (49.8%) | 819 (50.2%) |
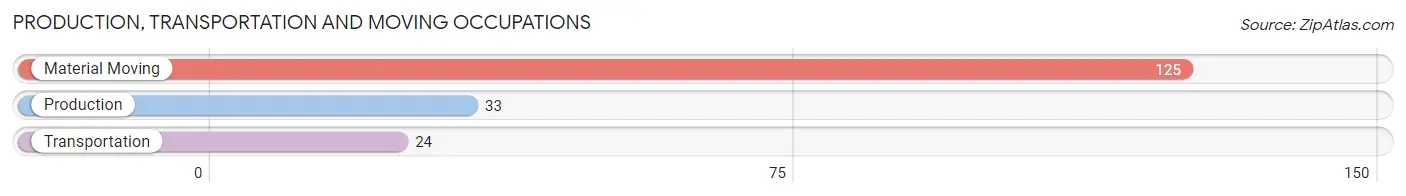
Production, Transportation and Moving Occupations
The most common Production, Transportation and Moving occupations in Cochran are Material Moving (125 | 7.7%), Production (33 | 2.0%), and Transportation (24 | 1.5%).
Production, Transportation and Moving Occupations by Sex
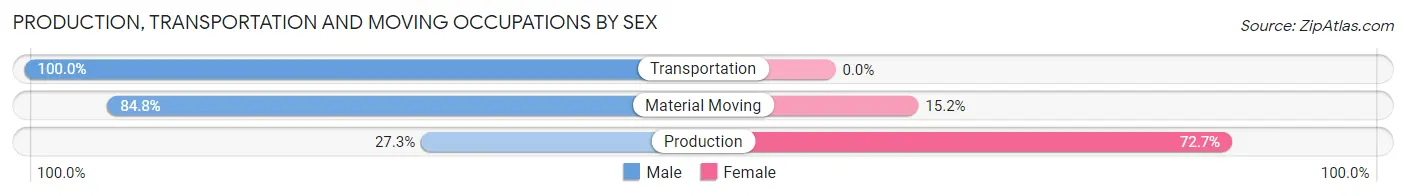
| Occupation | Male | Female |
| Production | 9 (27.3%) | 24 (72.7%) |
| Transportation | 24 (100.0%) | 0 (0.0%) |
| Material Moving | 106 (84.8%) | 19 (15.2%) |
| Total (Category) | 139 (76.4%) | 43 (23.6%) |
| Total (Overall) | 813 (49.8%) | 819 (50.2%) |
Employment Industries by Sex in Cochran
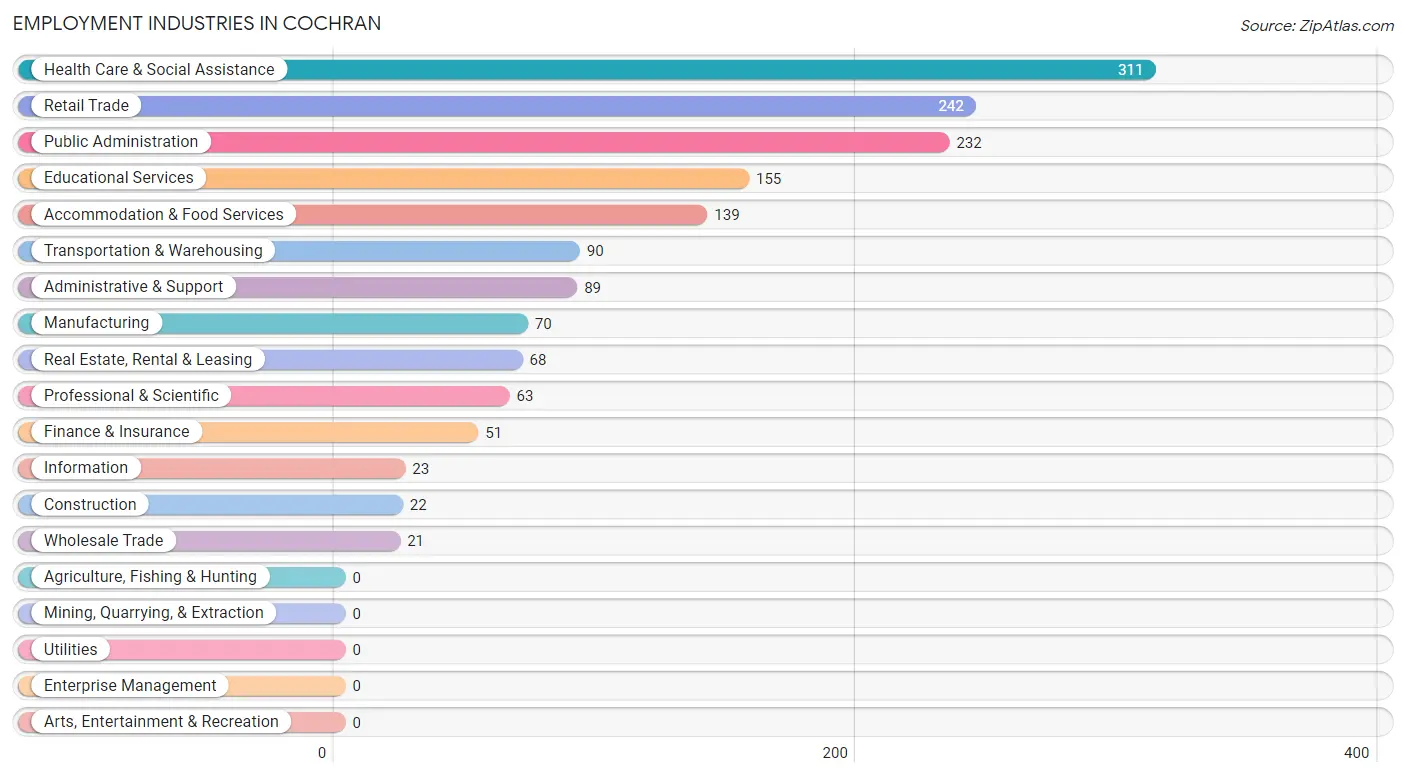
Employment Industries in Cochran
The major employment industries in Cochran include Health Care & Social Assistance (311 | 19.1%), Retail Trade (242 | 14.8%), Public Administration (232 | 14.2%), Educational Services (155 | 9.5%), and Accommodation & Food Services (139 | 8.5%).
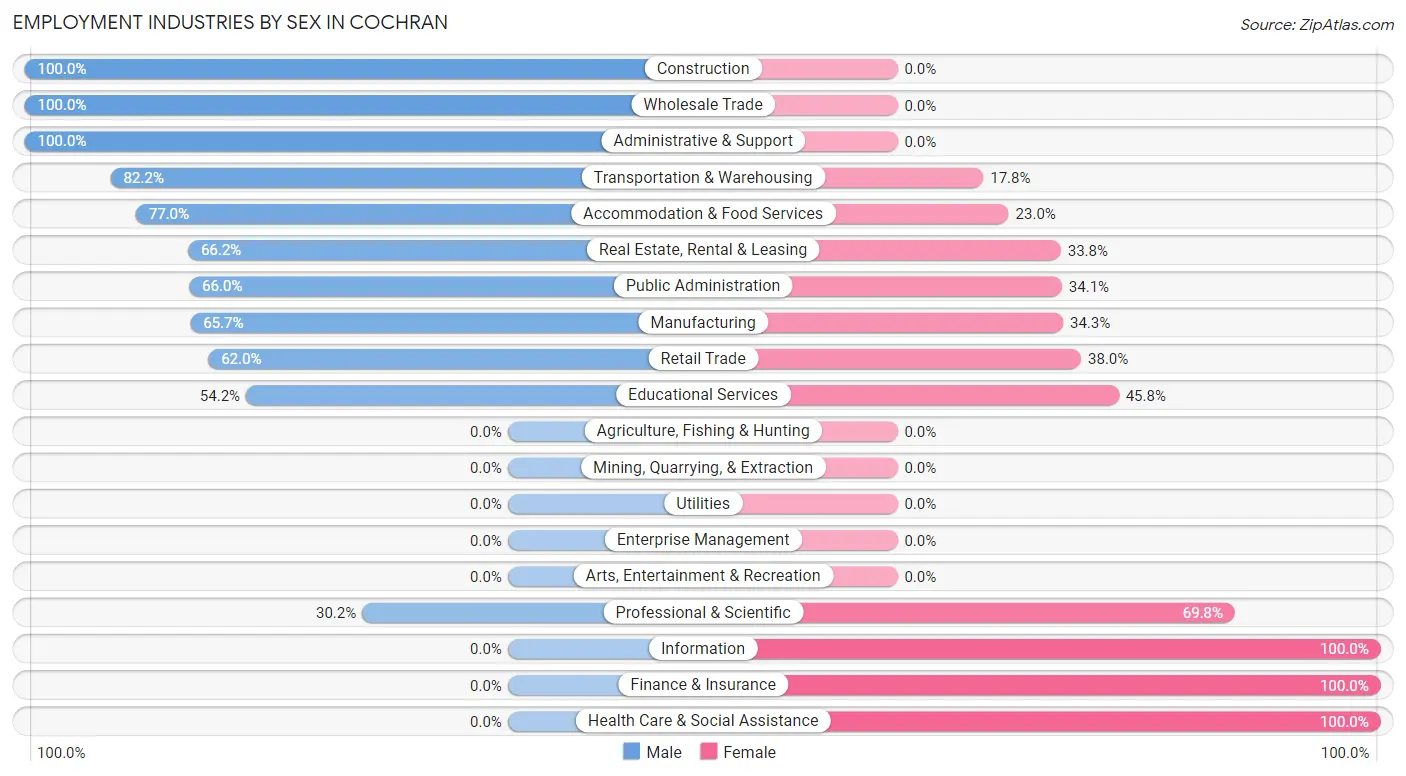
Employment Industries by Sex in Cochran
The Cochran industries that see more men than women are Construction (100.0%), Wholesale Trade (100.0%), and Administrative & Support (100.0%), whereas the industries that tend to have a higher number of women are Information (100.0%), Finance & Insurance (100.0%), and Health Care & Social Assistance (100.0%).
| Industry | Male | Female |
| Agriculture, Fishing & Hunting | 0 (0.0%) | 0 (0.0%) |
| Mining, Quarrying, & Extraction | 0 (0.0%) | 0 (0.0%) |
| Construction | 22 (100.0%) | 0 (0.0%) |
| Manufacturing | 46 (65.7%) | 24 (34.3%) |
| Wholesale Trade | 21 (100.0%) | 0 (0.0%) |
| Retail Trade | 150 (62.0%) | 92 (38.0%) |
| Transportation & Warehousing | 74 (82.2%) | 16 (17.8%) |
| Utilities | 0 (0.0%) | 0 (0.0%) |
| Information | 0 (0.0%) | 23 (100.0%) |
| Finance & Insurance | 0 (0.0%) | 51 (100.0%) |
| Real Estate, Rental & Leasing | 45 (66.2%) | 23 (33.8%) |
| Professional & Scientific | 19 (30.2%) | 44 (69.8%) |
| Enterprise Management | 0 (0.0%) | 0 (0.0%) |
| Administrative & Support | 89 (100.0%) | 0 (0.0%) |
| Educational Services | 84 (54.2%) | 71 (45.8%) |
| Health Care & Social Assistance | 0 (0.0%) | 311 (100.0%) |
| Arts, Entertainment & Recreation | 0 (0.0%) | 0 (0.0%) |
| Accommodation & Food Services | 107 (77.0%) | 32 (23.0%) |
| Public Administration | 153 (65.9%) | 79 (34.1%) |
| Total | 813 (49.8%) | 819 (50.2%) |
Education in Cochran
School Enrollment in Cochran
The most common levels of schooling among the 1,978 students in Cochran are college / undergraduate (982 | 49.6%), elementary school (288 | 14.6%), and middle school (251 | 12.7%).
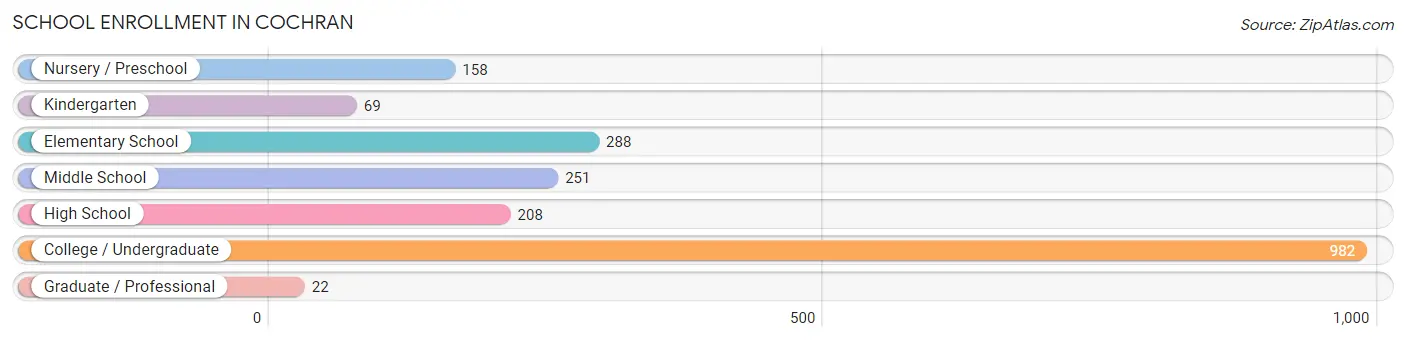
| School Level | # Students | % Students |
| Nursery / Preschool | 158 | 8.0% |
| Kindergarten | 69 | 3.5% |
| Elementary School | 288 | 14.6% |
| Middle School | 251 | 12.7% |
| High School | 208 | 10.5% |
| College / Undergraduate | 982 | 49.6% |
| Graduate / Professional | 22 | 1.1% |
| Total | 1,978 | 100.0% |
School Enrollment by Age by Funding Source in Cochran
Out of a total of 1,978 students who are enrolled in schools in Cochran, 57 (2.9%) attend a private institution, while the remaining 1,921 (97.1%) are enrolled in public schools. The age group of 3 to 4 year olds has the highest likelihood of being enrolled in private schools, with 19 (11.7% in the age bracket) enrolled. Conversely, the age group of 5 to 9 year old has the lowest likelihood of being enrolled in a private school, with 299 (100.0% in the age bracket) attending a public institution.
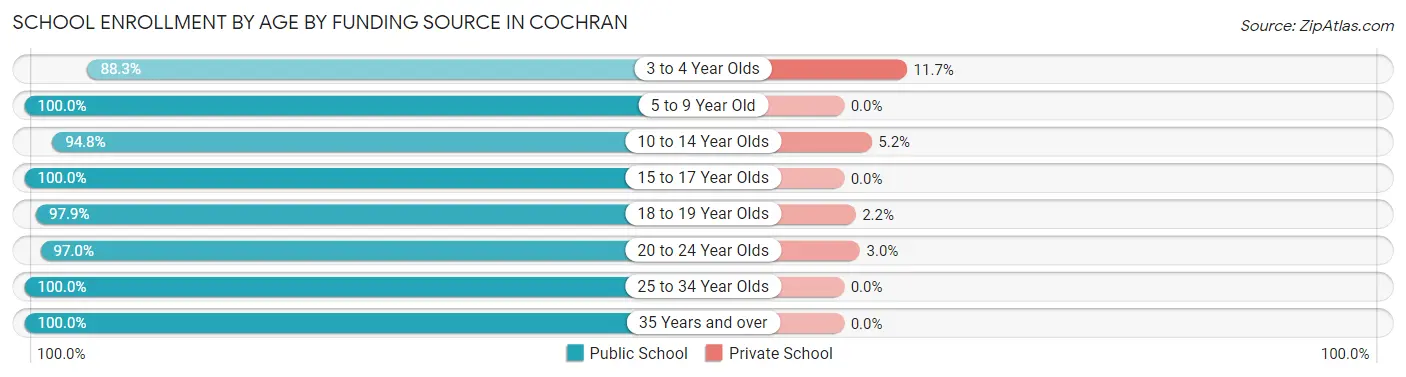
| Age Bracket | Public School | Private School |
| 3 to 4 Year Olds | 143 (88.3%) | 19 (11.7%) |
| 5 to 9 Year Old | 299 (100.0%) | 0 (0.0%) |
| 10 to 14 Year Olds | 294 (94.8%) | 16 (5.2%) |
| 15 to 17 Year Olds | 158 (100.0%) | 0 (0.0%) |
| 18 to 19 Year Olds | 546 (97.9%) | 12 (2.1%) |
| 20 to 24 Year Olds | 359 (97.0%) | 11 (3.0%) |
| 25 to 34 Year Olds | 59 (100.0%) | 0 (0.0%) |
| 35 Years and over | 62 (100.0%) | 0 (0.0%) |
| Total | 1,921 (97.1%) | 57 (2.9%) |
Educational Attainment by Field of Study in Cochran
Science & technology (154 | 23.8%), business (116 | 17.9%), education (82 | 12.7%), arts & humanities (76 | 11.7%), and liberal arts & history (60 | 9.3%) are the most common fields of study among 647 individuals in Cochran who have obtained a bachelor's degree or higher.
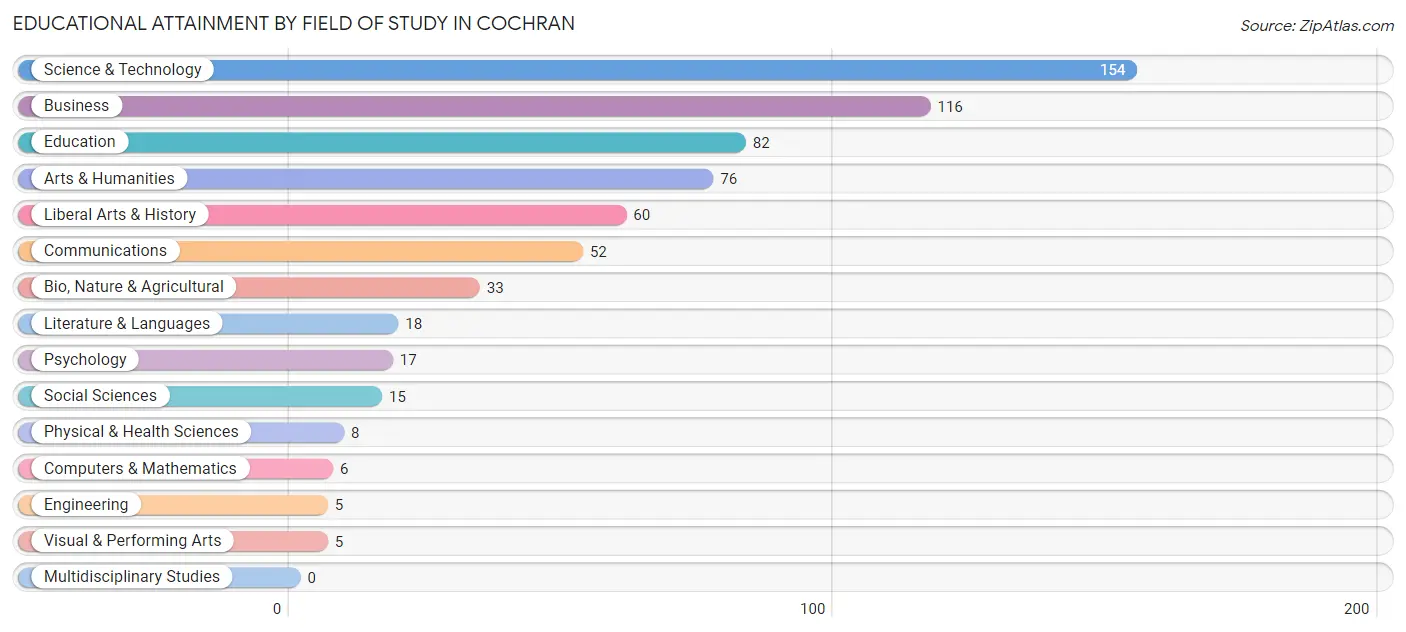
| Field of Study | # Graduates | % Graduates |
| Computers & Mathematics | 6 | 0.9% |
| Bio, Nature & Agricultural | 33 | 5.1% |
| Physical & Health Sciences | 8 | 1.2% |
| Psychology | 17 | 2.6% |
| Social Sciences | 15 | 2.3% |
| Engineering | 5 | 0.8% |
| Multidisciplinary Studies | 0 | 0.0% |
| Science & Technology | 154 | 23.8% |
| Business | 116 | 17.9% |
| Education | 82 | 12.7% |
| Literature & Languages | 18 | 2.8% |
| Liberal Arts & History | 60 | 9.3% |
| Visual & Performing Arts | 5 | 0.8% |
| Communications | 52 | 8.0% |
| Arts & Humanities | 76 | 11.7% |
| Total | 647 | 100.0% |
Transportation & Commute in Cochran
Vehicle Availability by Sex in Cochran
The most prevalent vehicle ownership categories in Cochran are males with 2 vehicles (332, accounting for 46.6%) and females with 2 vehicles (217, making up 43.0%).
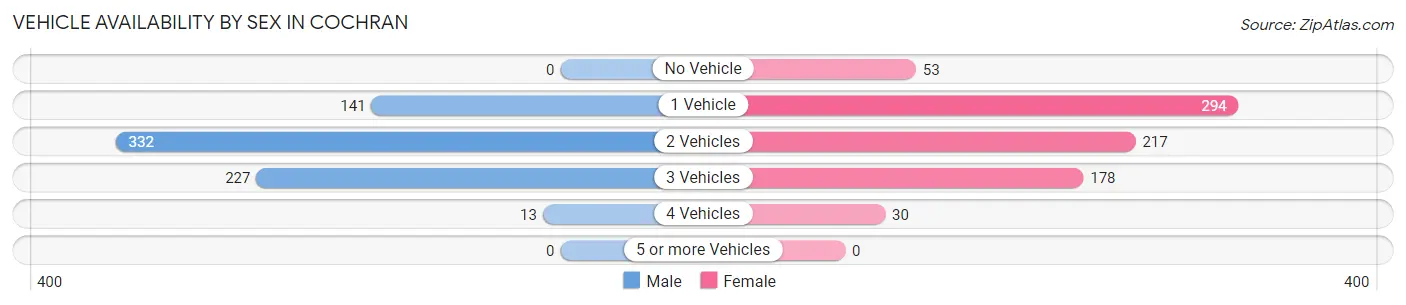
| Vehicles Available | Male | Female |
| No Vehicle | 0 (0.0%) | 53 (6.9%) |
| 1 Vehicle | 141 (19.8%) | 294 (38.1%) |
| 2 Vehicles | 332 (46.6%) | 217 (28.1%) |
| 3 Vehicles | 227 (31.8%) | 178 (23.1%) |
| 4 Vehicles | 13 (1.8%) | 30 (3.9%) |
| 5 or more Vehicles | 0 (0.0%) | 0 (0.0%) |
| Total | 713 (100.0%) | 772 (100.0%) |
Commute Time in Cochran
The most frequently occuring commute durations in Cochran are 5 to 9 minutes (370 commuters, 24.2%), 30 to 34 minutes (213 commuters, 13.9%), and 10 to 14 minutes (208 commuters, 13.6%).
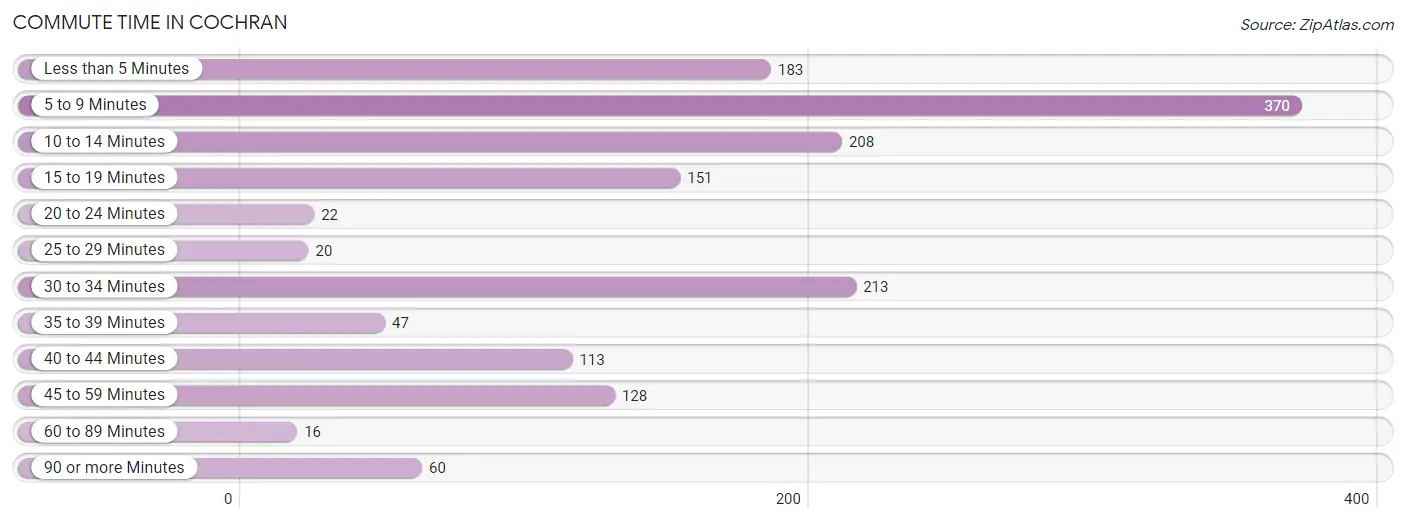
| Commute Time | # Commuters | % Commuters |
| Less than 5 Minutes | 183 | 11.9% |
| 5 to 9 Minutes | 370 | 24.2% |
| 10 to 14 Minutes | 208 | 13.6% |
| 15 to 19 Minutes | 151 | 9.9% |
| 20 to 24 Minutes | 22 | 1.4% |
| 25 to 29 Minutes | 20 | 1.3% |
| 30 to 34 Minutes | 213 | 13.9% |
| 35 to 39 Minutes | 47 | 3.1% |
| 40 to 44 Minutes | 113 | 7.4% |
| 45 to 59 Minutes | 128 | 8.4% |
| 60 to 89 Minutes | 16 | 1.1% |
| 90 or more Minutes | 60 | 3.9% |
Commute Time by Sex in Cochran
The most common commute times in Cochran are 30 to 34 minutes (175 commuters, 22.8%) for males and 5 to 9 minutes (290 commuters, 38.1%) for females.
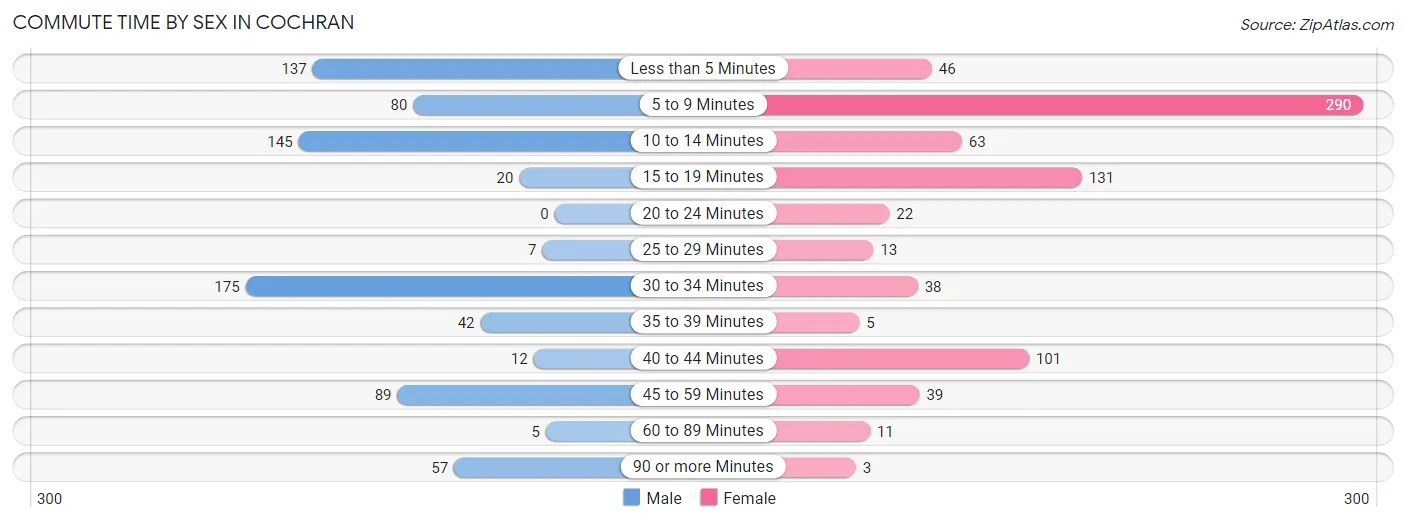
| Commute Time | Male | Female |
| Less than 5 Minutes | 137 (17.8%) | 46 (6.0%) |
| 5 to 9 Minutes | 80 (10.4%) | 290 (38.1%) |
| 10 to 14 Minutes | 145 (18.9%) | 63 (8.3%) |
| 15 to 19 Minutes | 20 (2.6%) | 131 (17.2%) |
| 20 to 24 Minutes | 0 (0.0%) | 22 (2.9%) |
| 25 to 29 Minutes | 7 (0.9%) | 13 (1.7%) |
| 30 to 34 Minutes | 175 (22.8%) | 38 (5.0%) |
| 35 to 39 Minutes | 42 (5.5%) | 5 (0.7%) |
| 40 to 44 Minutes | 12 (1.6%) | 101 (13.3%) |
| 45 to 59 Minutes | 89 (11.6%) | 39 (5.1%) |
| 60 to 89 Minutes | 5 (0.6%) | 11 (1.4%) |
| 90 or more Minutes | 57 (7.4%) | 3 (0.4%) |
Time of Departure to Work by Sex in Cochran
The most frequent times of departure to work in Cochran are 5:00 AM to 5:29 AM (145, 18.9%) for males and 8:00 AM to 8:29 AM (152, 20.0%) for females.
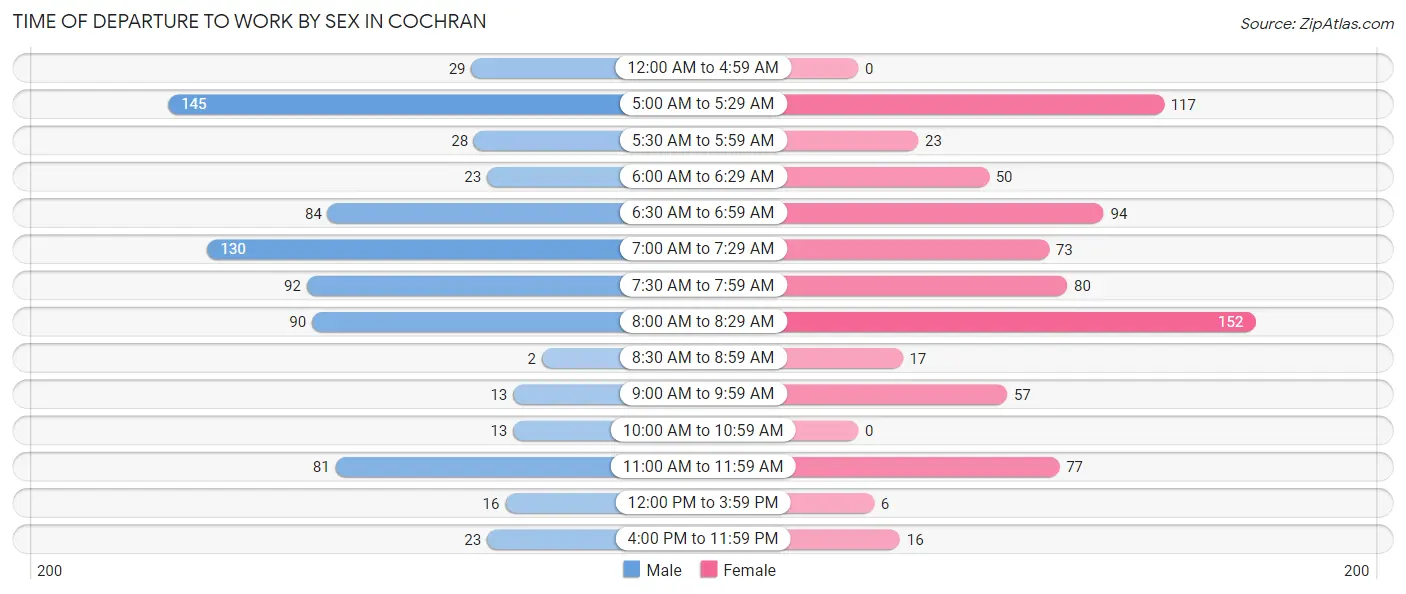
| Time of Departure | Male | Female |
| 12:00 AM to 4:59 AM | 29 (3.8%) | 0 (0.0%) |
| 5:00 AM to 5:29 AM | 145 (18.9%) | 117 (15.3%) |
| 5:30 AM to 5:59 AM | 28 (3.6%) | 23 (3.0%) |
| 6:00 AM to 6:29 AM | 23 (3.0%) | 50 (6.6%) |
| 6:30 AM to 6:59 AM | 84 (10.9%) | 94 (12.3%) |
| 7:00 AM to 7:29 AM | 130 (16.9%) | 73 (9.6%) |
| 7:30 AM to 7:59 AM | 92 (12.0%) | 80 (10.5%) |
| 8:00 AM to 8:29 AM | 90 (11.7%) | 152 (20.0%) |
| 8:30 AM to 8:59 AM | 2 (0.3%) | 17 (2.2%) |
| 9:00 AM to 9:59 AM | 13 (1.7%) | 57 (7.5%) |
| 10:00 AM to 10:59 AM | 13 (1.7%) | 0 (0.0%) |
| 11:00 AM to 11:59 AM | 81 (10.5%) | 77 (10.1%) |
| 12:00 PM to 3:59 PM | 16 (2.1%) | 6 (0.8%) |
| 4:00 PM to 11:59 PM | 23 (3.0%) | 16 (2.1%) |
| Total | 769 (100.0%) | 762 (100.0%) |
Housing Occupancy in Cochran
Occupancy by Ownership in Cochran
Of the total 1,442 dwellings in Cochran, owner-occupied units account for 943 (65.4%), while renter-occupied units make up 499 (34.6%).
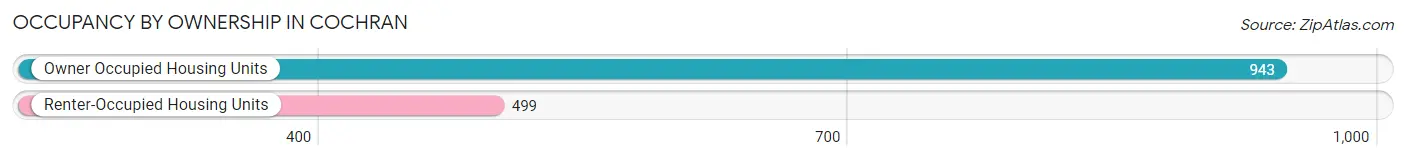
| Occupancy | # Housing Units | % Housing Units |
| Owner Occupied Housing Units | 943 | 65.4% |
| Renter-Occupied Housing Units | 499 | 34.6% |
| Total Occupied Housing Units | 1,442 | 100.0% |
Occupancy by Household Size in Cochran
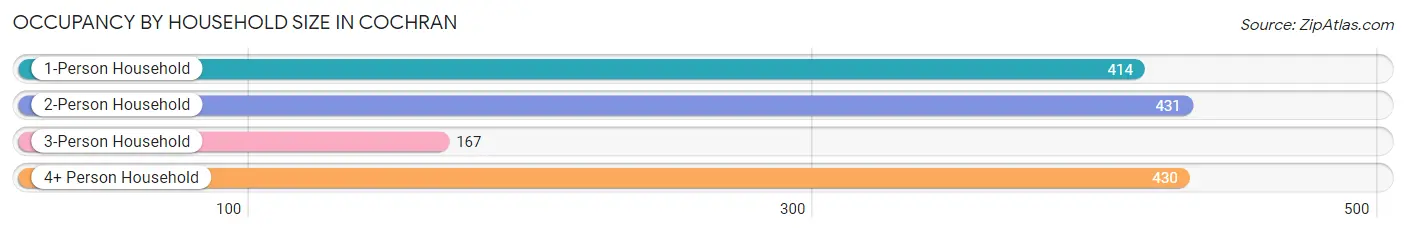
| Household Size | # Housing Units | % Housing Units |
| 1-Person Household | 414 | 28.7% |
| 2-Person Household | 431 | 29.9% |
| 3-Person Household | 167 | 11.6% |
| 4+ Person Household | 430 | 29.8% |
| Total Housing Units | 1,442 | 100.0% |
Occupancy by Ownership by Household Size in Cochran
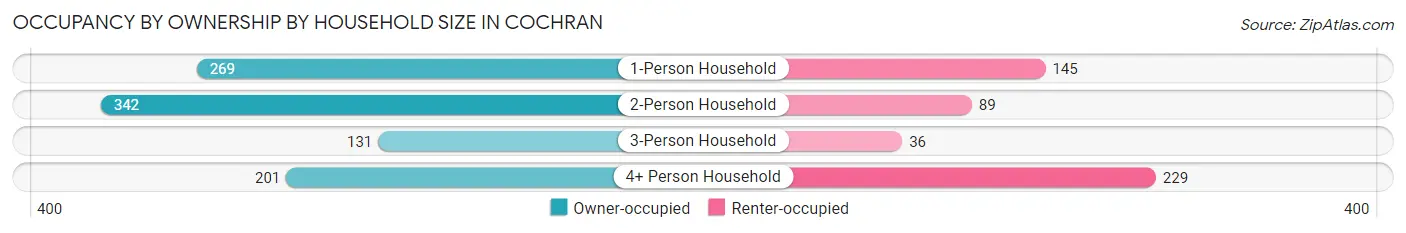
| Household Size | Owner-occupied | Renter-occupied |
| 1-Person Household | 269 (65.0%) | 145 (35.0%) |
| 2-Person Household | 342 (79.3%) | 89 (20.6%) |
| 3-Person Household | 131 (78.4%) | 36 (21.6%) |
| 4+ Person Household | 201 (46.7%) | 229 (53.3%) |
| Total Housing Units | 943 (65.4%) | 499 (34.6%) |
Occupancy by Educational Attainment in Cochran
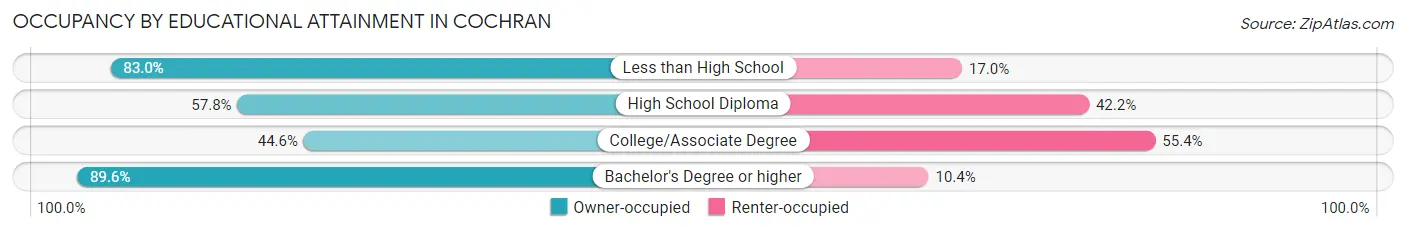
| Household Size | Owner-occupied | Renter-occupied |
| Less than High School | 234 (83.0%) | 48 (17.0%) |
| High School Diploma | 174 (57.8%) | 127 (42.2%) |
| College/Associate Degree | 233 (44.6%) | 289 (55.4%) |
| Bachelor's Degree or higher | 302 (89.6%) | 35 (10.4%) |
Occupancy by Age of Householder in Cochran
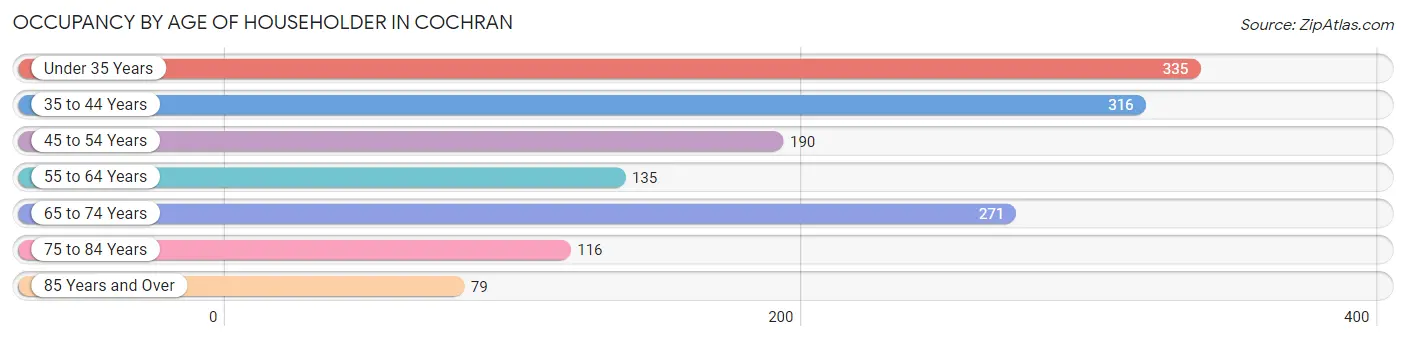
| Age Bracket | # Households | % Households |
| Under 35 Years | 335 | 23.2% |
| 35 to 44 Years | 316 | 21.9% |
| 45 to 54 Years | 190 | 13.2% |
| 55 to 64 Years | 135 | 9.4% |
| 65 to 74 Years | 271 | 18.8% |
| 75 to 84 Years | 116 | 8.0% |
| 85 Years and Over | 79 | 5.5% |
| Total | 1,442 | 100.0% |
Housing Finances in Cochran
Median Income by Occupancy in Cochran
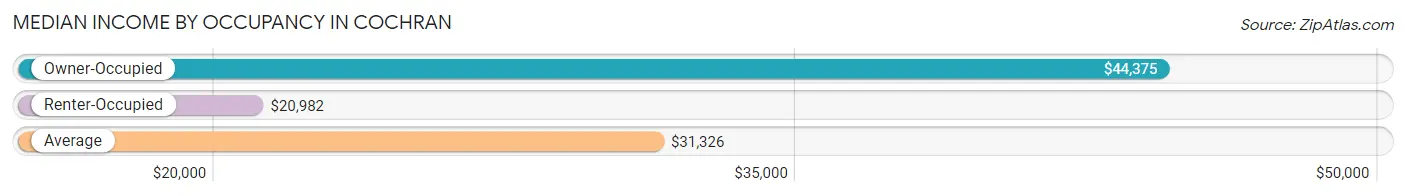
| Occupancy Type | # Households | Median Income |
| Owner-Occupied | 943 (65.4%) | $44,375 |
| Renter-Occupied | 499 (34.6%) | $20,982 |
| Average | 1,442 (100.0%) | $31,326 |
Occupancy by Householder Income Bracket in Cochran
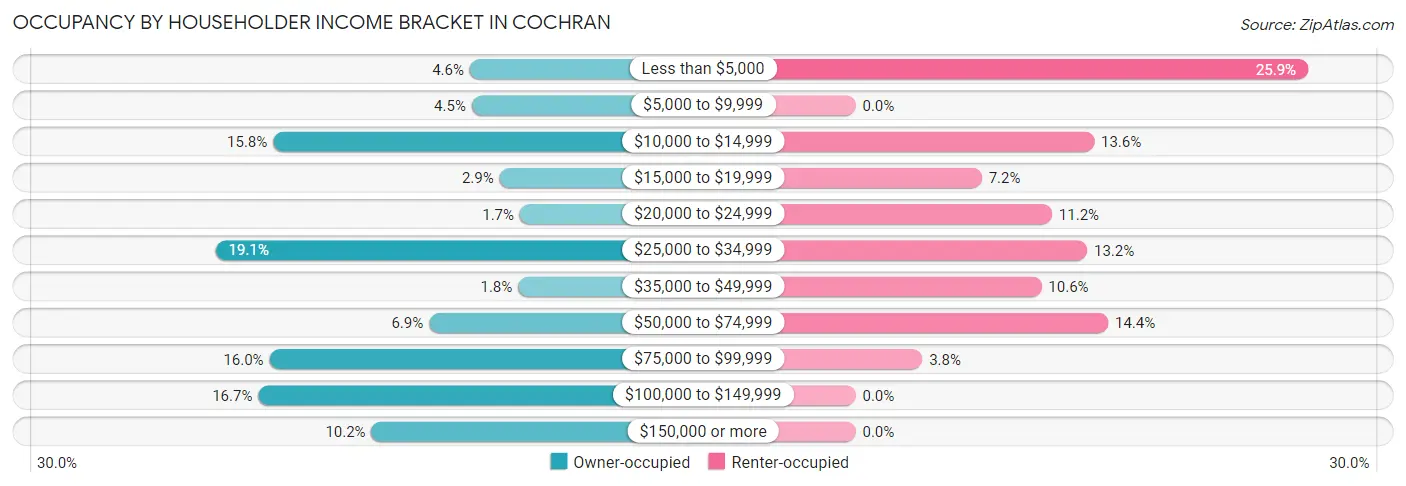
| Income Bracket | Owner-occupied | Renter-occupied |
| Less than $5,000 | 43 (4.6%) | 129 (25.9%) |
| $5,000 to $9,999 | 42 (4.4%) | 0 (0.0%) |
| $10,000 to $14,999 | 149 (15.8%) | 68 (13.6%) |
| $15,000 to $19,999 | 27 (2.9%) | 36 (7.2%) |
| $20,000 to $24,999 | 16 (1.7%) | 56 (11.2%) |
| $25,000 to $34,999 | 180 (19.1%) | 66 (13.2%) |
| $35,000 to $49,999 | 17 (1.8%) | 53 (10.6%) |
| $50,000 to $74,999 | 65 (6.9%) | 72 (14.4%) |
| $75,000 to $99,999 | 151 (16.0%) | 19 (3.8%) |
| $100,000 to $149,999 | 157 (16.7%) | 0 (0.0%) |
| $150,000 or more | 96 (10.2%) | 0 (0.0%) |
| Total | 943 (100.0%) | 499 (100.0%) |
Monthly Housing Cost Tiers in Cochran
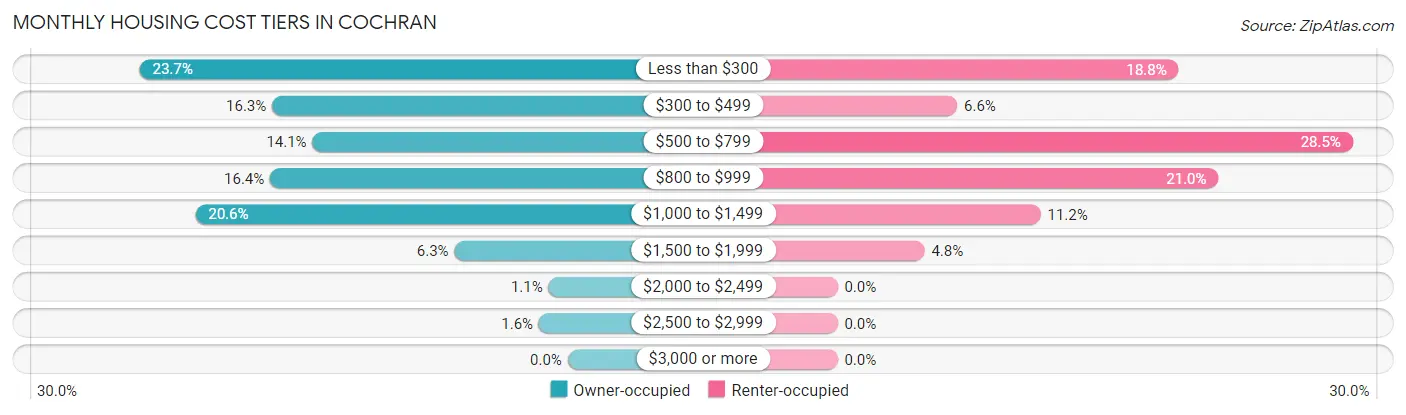
| Monthly Cost | Owner-occupied | Renter-occupied |
| Less than $300 | 223 (23.6%) | 94 (18.8%) |
| $300 to $499 | 154 (16.3%) | 33 (6.6%) |
| $500 to $799 | 133 (14.1%) | 142 (28.5%) |
| $800 to $999 | 155 (16.4%) | 105 (21.0%) |
| $1,000 to $1,499 | 194 (20.6%) | 56 (11.2%) |
| $1,500 to $1,999 | 59 (6.3%) | 24 (4.8%) |
| $2,000 to $2,499 | 10 (1.1%) | 0 (0.0%) |
| $2,500 to $2,999 | 15 (1.6%) | 0 (0.0%) |
| $3,000 or more | 0 (0.0%) | 0 (0.0%) |
| Total | 943 (100.0%) | 499 (100.0%) |
Physical Housing Characteristics in Cochran
Housing Structures in Cochran
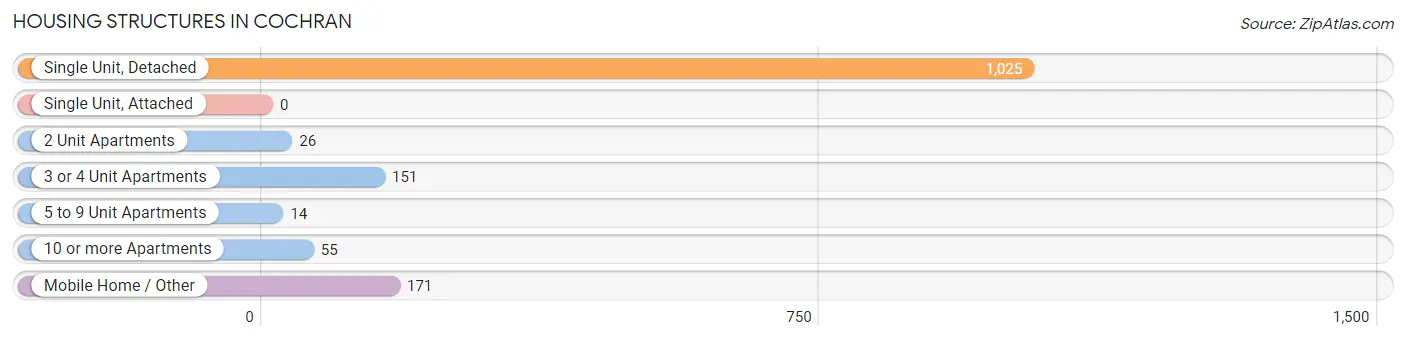
| Structure Type | # Housing Units | % Housing Units |
| Single Unit, Detached | 1,025 | 71.1% |
| Single Unit, Attached | 0 | 0.0% |
| 2 Unit Apartments | 26 | 1.8% |
| 3 or 4 Unit Apartments | 151 | 10.5% |
| 5 to 9 Unit Apartments | 14 | 1.0% |
| 10 or more Apartments | 55 | 3.8% |
| Mobile Home / Other | 171 | 11.9% |
| Total | 1,442 | 100.0% |
Housing Structures by Occupancy in Cochran
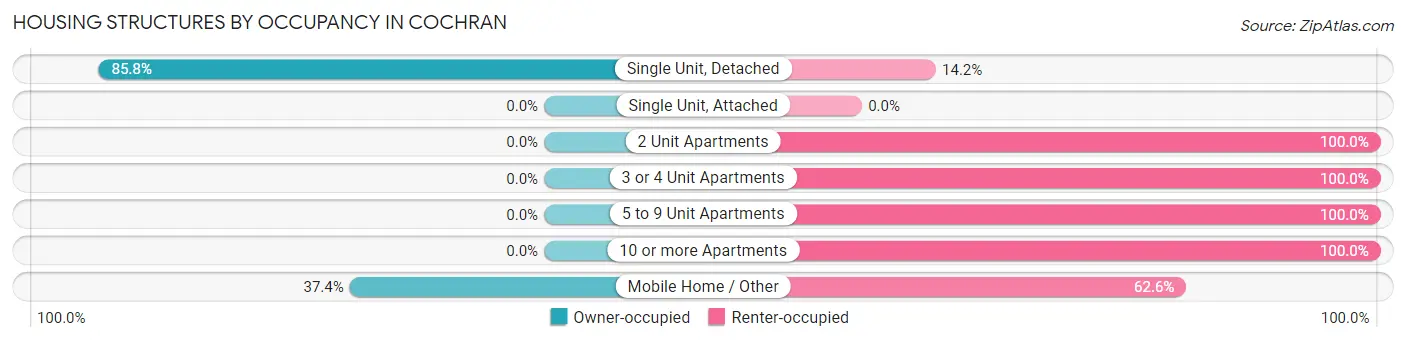
| Structure Type | Owner-occupied | Renter-occupied |
| Single Unit, Detached | 879 (85.8%) | 146 (14.2%) |
| Single Unit, Attached | 0 (0.0%) | 0 (0.0%) |
| 2 Unit Apartments | 0 (0.0%) | 26 (100.0%) |
| 3 or 4 Unit Apartments | 0 (0.0%) | 151 (100.0%) |
| 5 to 9 Unit Apartments | 0 (0.0%) | 14 (100.0%) |
| 10 or more Apartments | 0 (0.0%) | 55 (100.0%) |
| Mobile Home / Other | 64 (37.4%) | 107 (62.6%) |
| Total | 943 (65.4%) | 499 (34.6%) |
Housing Structures by Number of Rooms in Cochran
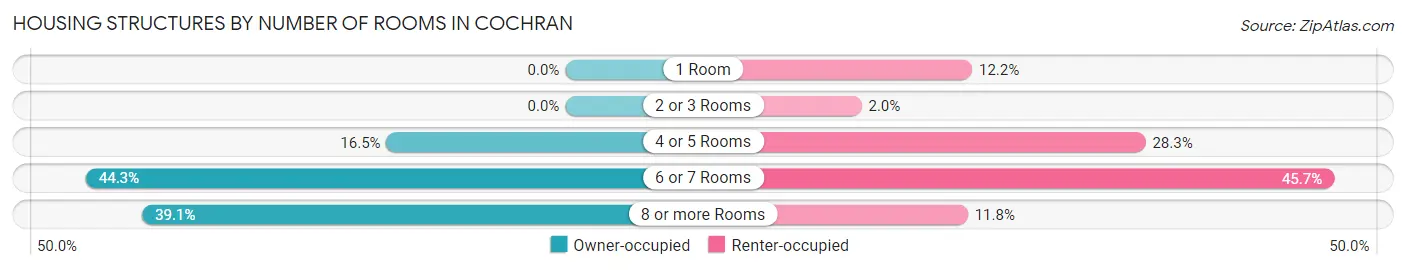
| Number of Rooms | Owner-occupied | Renter-occupied |
| 1 Room | 0 (0.0%) | 61 (12.2%) |
| 2 or 3 Rooms | 0 (0.0%) | 10 (2.0%) |
| 4 or 5 Rooms | 156 (16.5%) | 141 (28.3%) |
| 6 or 7 Rooms | 418 (44.3%) | 228 (45.7%) |
| 8 or more Rooms | 369 (39.1%) | 59 (11.8%) |
| Total | 943 (100.0%) | 499 (100.0%) |
Housing Structure by Heating Type in Cochran
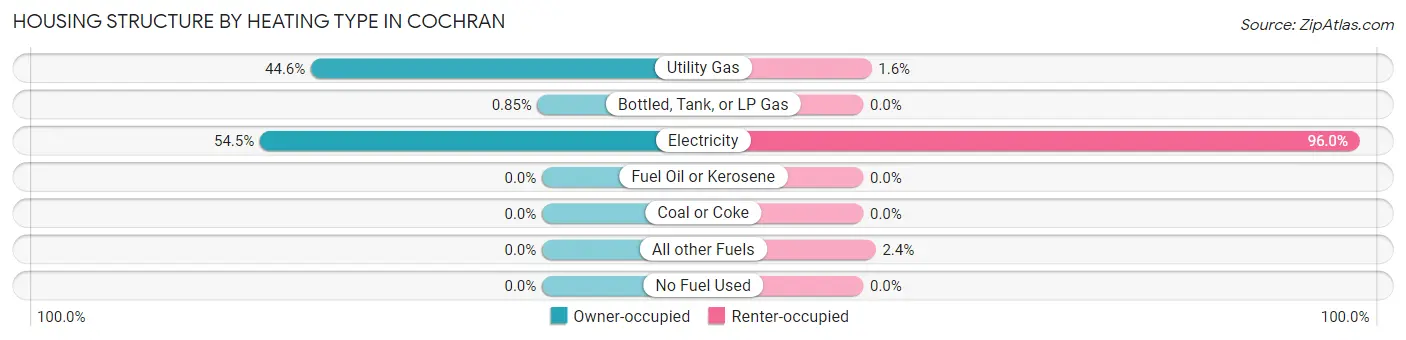
| Heating Type | Owner-occupied | Renter-occupied |
| Utility Gas | 421 (44.6%) | 8 (1.6%) |
| Bottled, Tank, or LP Gas | 8 (0.9%) | 0 (0.0%) |
| Electricity | 514 (54.5%) | 479 (96.0%) |
| Fuel Oil or Kerosene | 0 (0.0%) | 0 (0.0%) |
| Coal or Coke | 0 (0.0%) | 0 (0.0%) |
| All other Fuels | 0 (0.0%) | 12 (2.4%) |
| No Fuel Used | 0 (0.0%) | 0 (0.0%) |
| Total | 943 (100.0%) | 499 (100.0%) |
Household Vehicle Usage in Cochran
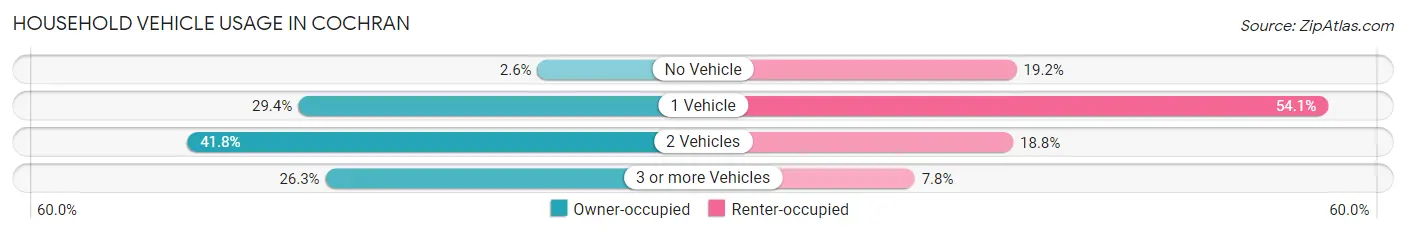
| Vehicles per Household | Owner-occupied | Renter-occupied |
| No Vehicle | 24 (2.5%) | 96 (19.2%) |
| 1 Vehicle | 277 (29.4%) | 270 (54.1%) |
| 2 Vehicles | 394 (41.8%) | 94 (18.8%) |
| 3 or more Vehicles | 248 (26.3%) | 39 (7.8%) |
| Total | 943 (100.0%) | 499 (100.0%) |
Real Estate & Mortgages in Cochran
Real Estate and Mortgage Overview in Cochran
| Characteristic | Without Mortgage | With Mortgage |
| Housing Units | 566 | 377 |
| Median Property Value | $82,100 | $154,400 |
| Median Household Income | $31,338 | $63 |
| Monthly Housing Costs | $333 | $0 |
| Real Estate Taxes | $1,046 | $44 |
Property Value by Mortgage Status in Cochran
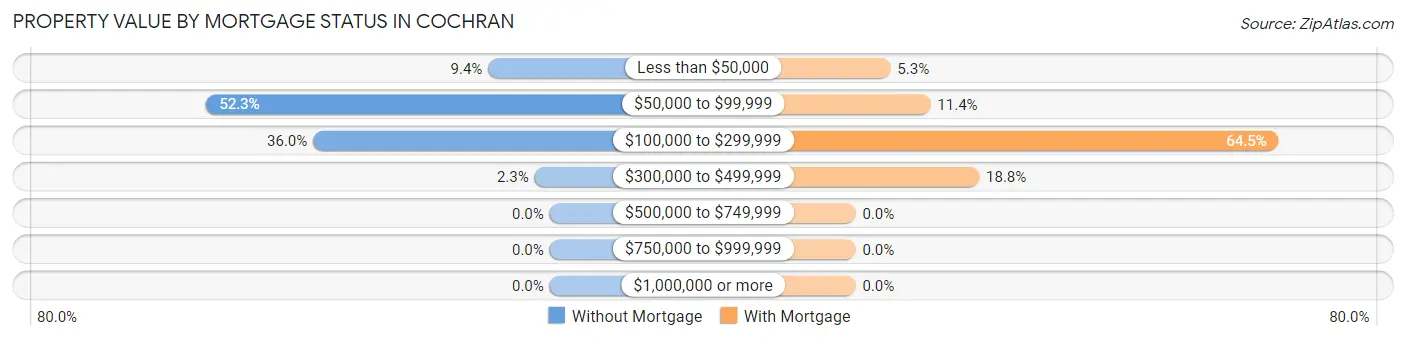
| Property Value | Without Mortgage | With Mortgage |
| Less than $50,000 | 53 (9.4%) | 20 (5.3%) |
| $50,000 to $99,999 | 296 (52.3%) | 43 (11.4%) |
| $100,000 to $299,999 | 204 (36.0%) | 243 (64.5%) |
| $300,000 to $499,999 | 13 (2.3%) | 71 (18.8%) |
| $500,000 to $749,999 | 0 (0.0%) | 0 (0.0%) |
| $750,000 to $999,999 | 0 (0.0%) | 0 (0.0%) |
| $1,000,000 or more | 0 (0.0%) | 0 (0.0%) |
| Total | 566 (100.0%) | 377 (100.0%) |
Household Income by Mortgage Status in Cochran
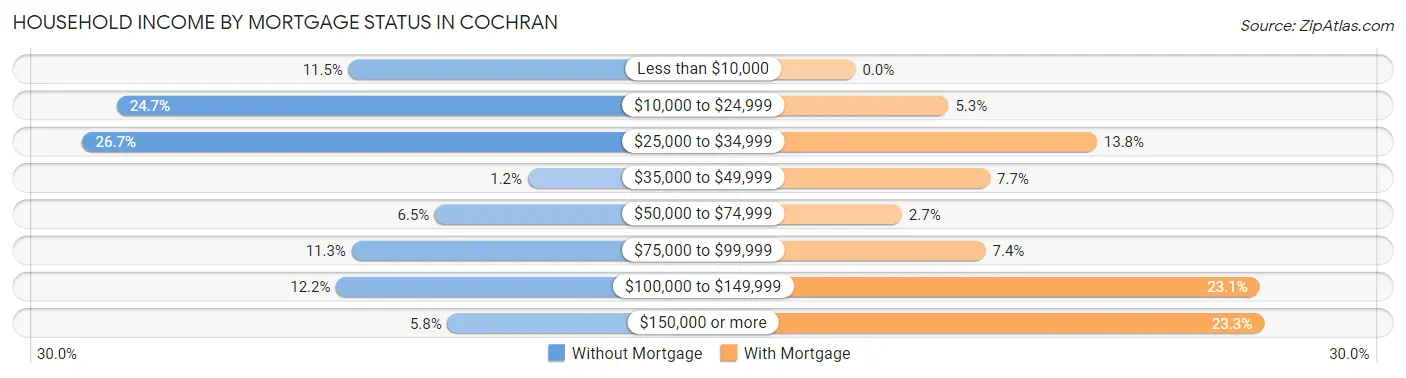
| Household Income | Without Mortgage | With Mortgage |
| Less than $10,000 | 65 (11.5%) | 0 (0.0%) |
| $10,000 to $24,999 | 140 (24.7%) | 20 (5.3%) |
| $25,000 to $34,999 | 151 (26.7%) | 52 (13.8%) |
| $35,000 to $49,999 | 7 (1.2%) | 29 (7.7%) |
| $50,000 to $74,999 | 37 (6.5%) | 10 (2.6%) |
| $75,000 to $99,999 | 64 (11.3%) | 28 (7.4%) |
| $100,000 to $149,999 | 69 (12.2%) | 87 (23.1%) |
| $150,000 or more | 33 (5.8%) | 88 (23.3%) |
| Total | 566 (100.0%) | 377 (100.0%) |
Property Value to Household Income Ratio in Cochran
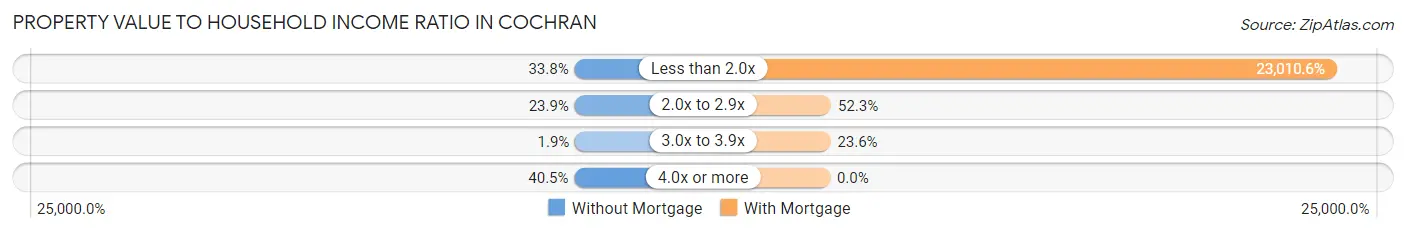
| Value-to-Income Ratio | Without Mortgage | With Mortgage |
| Less than 2.0x | 191 (33.8%) | 86,750 (23,010.6%) |
| 2.0x to 2.9x | 135 (23.8%) | 197 (52.2%) |
| 3.0x to 3.9x | 11 (1.9%) | 89 (23.6%) |
| 4.0x or more | 229 (40.5%) | 0 (0.0%) |
| Total | 566 (100.0%) | 377 (100.0%) |
Real Estate Taxes by Mortgage Status in Cochran
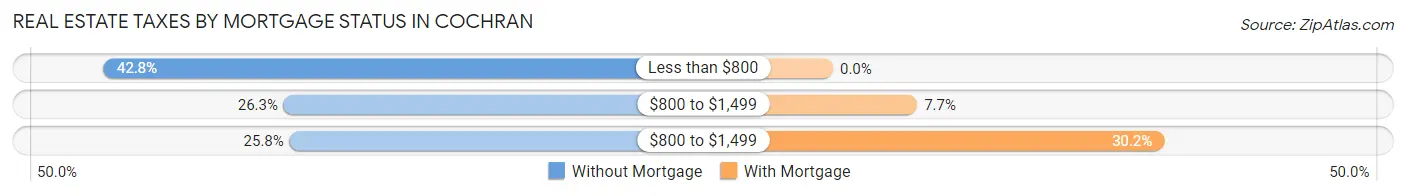
| Property Taxes | Without Mortgage | With Mortgage |
| Less than $800 | 242 (42.8%) | 0 (0.0%) |
| $800 to $1,499 | 149 (26.3%) | 29 (7.7%) |
| $800 to $1,499 | 146 (25.8%) | 114 (30.2%) |
| Total | 566 (100.0%) | 377 (100.0%) |
Health & Disability in Cochran
Health Insurance Coverage by Age in Cochran
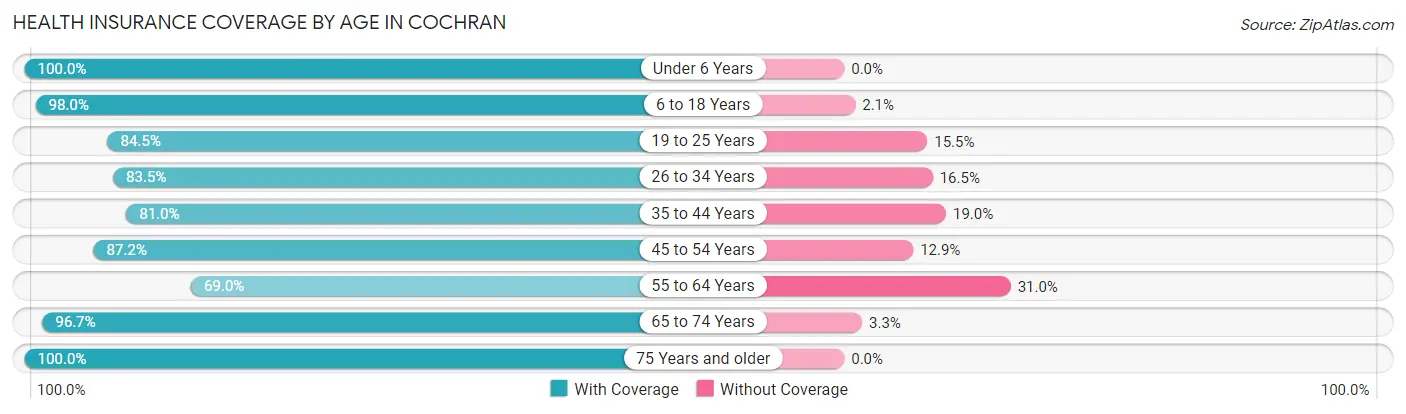
| Age Bracket | With Coverage | Without Coverage |
| Under 6 Years | 376 (100.0%) | 0 (0.0%) |
| 6 to 18 Years | 1,001 (98.0%) | 21 (2.1%) |
| 19 to 25 Years | 759 (84.5%) | 139 (15.5%) |
| 26 to 34 Years | 314 (83.5%) | 62 (16.5%) |
| 35 to 44 Years | 517 (81.0%) | 121 (19.0%) |
| 45 to 54 Years | 400 (87.2%) | 59 (12.9%) |
| 55 to 64 Years | 300 (69.0%) | 135 (31.0%) |
| 65 to 74 Years | 349 (96.7%) | 12 (3.3%) |
| 75 Years and older | 220 (100.0%) | 0 (0.0%) |
| Total | 4,236 (88.5%) | 549 (11.5%) |
Health Insurance Coverage by Citizenship Status in Cochran
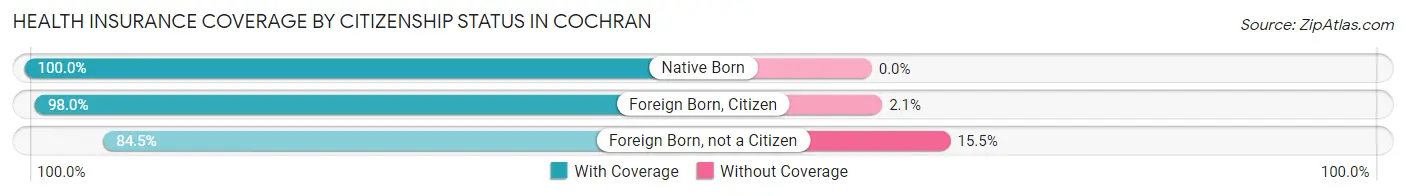
| Citizenship Status | With Coverage | Without Coverage |
| Native Born | 376 (100.0%) | 0 (0.0%) |
| Foreign Born, Citizen | 1,001 (98.0%) | 21 (2.1%) |
| Foreign Born, not a Citizen | 759 (84.5%) | 139 (15.5%) |
Health Insurance Coverage by Household Income in Cochran
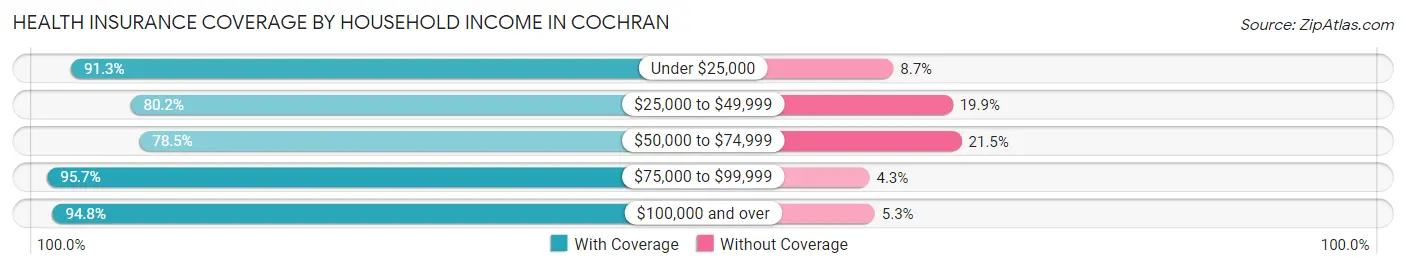
| Household Income | With Coverage | Without Coverage |
| Under $25,000 | 984 (91.3%) | 94 (8.7%) |
| $25,000 to $49,999 | 759 (80.1%) | 188 (19.9%) |
| $50,000 to $74,999 | 427 (78.5%) | 117 (21.5%) |
| $75,000 to $99,999 | 405 (95.7%) | 18 (4.3%) |
| $100,000 and over | 903 (94.8%) | 50 (5.2%) |
Public vs Private Health Insurance Coverage by Age in Cochran
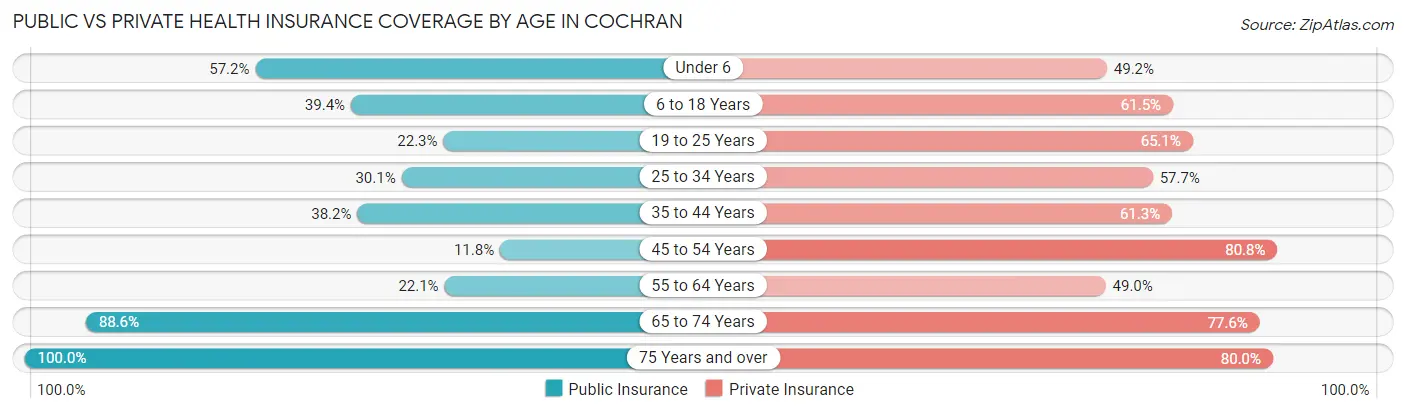
| Age Bracket | Public Insurance | Private Insurance |
| Under 6 | 215 (57.2%) | 185 (49.2%) |
| 6 to 18 Years | 403 (39.4%) | 628 (61.5%) |
| 19 to 25 Years | 200 (22.3%) | 585 (65.1%) |
| 25 to 34 Years | 113 (30.0%) | 217 (57.7%) |
| 35 to 44 Years | 244 (38.2%) | 391 (61.3%) |
| 45 to 54 Years | 54 (11.8%) | 371 (80.8%) |
| 55 to 64 Years | 96 (22.1%) | 213 (49.0%) |
| 65 to 74 Years | 320 (88.6%) | 280 (77.6%) |
| 75 Years and over | 220 (100.0%) | 176 (80.0%) |
| Total | 1,865 (39.0%) | 3,046 (63.7%) |
Disability Status by Sex by Age in Cochran
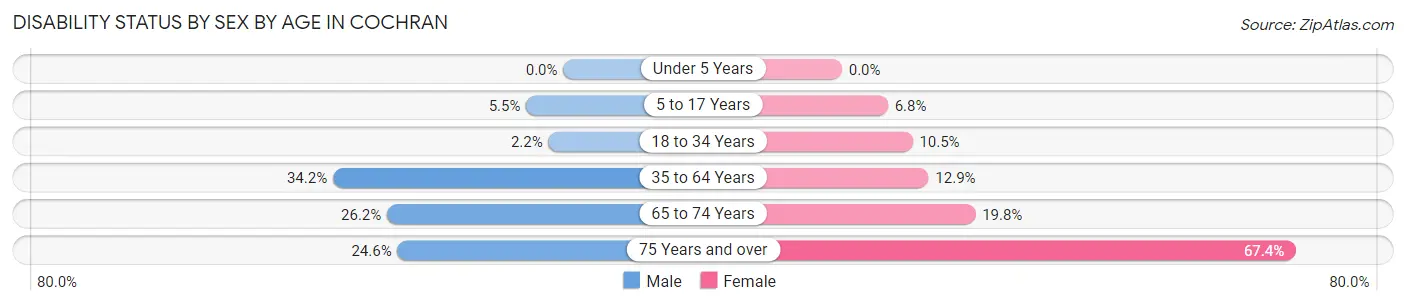
| Age Bracket | Male | Female |
| Under 5 Years | 0 (0.0%) | 0 (0.0%) |
| 5 to 17 Years | 24 (5.5%) | 27 (6.8%) |
| 18 to 34 Years | 16 (2.2%) | 85 (10.5%) |
| 35 to 64 Years | 274 (34.2%) | 94 (12.9%) |
| 65 to 74 Years | 39 (26.2%) | 42 (19.8%) |
| 75 Years and over | 33 (24.6%) | 58 (67.4%) |
Disability Class by Sex by Age in Cochran
Disability Class: Hearing Difficulty
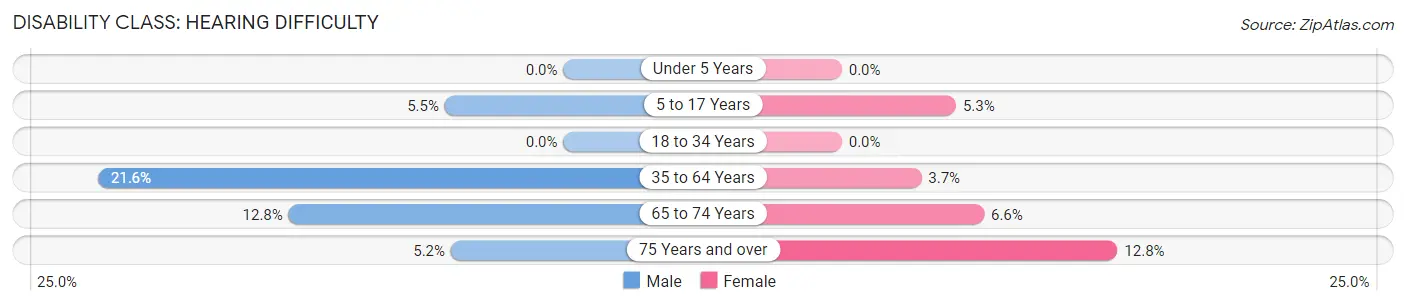
| Age Bracket | Male | Female |
| Under 5 Years | 0 (0.0%) | 0 (0.0%) |
| 5 to 17 Years | 24 (5.5%) | 21 (5.3%) |
| 18 to 34 Years | 0 (0.0%) | 0 (0.0%) |
| 35 to 64 Years | 173 (21.6%) | 27 (3.7%) |
| 65 to 74 Years | 19 (12.8%) | 14 (6.6%) |
| 75 Years and over | 7 (5.2%) | 11 (12.8%) |
Disability Class: Vision Difficulty
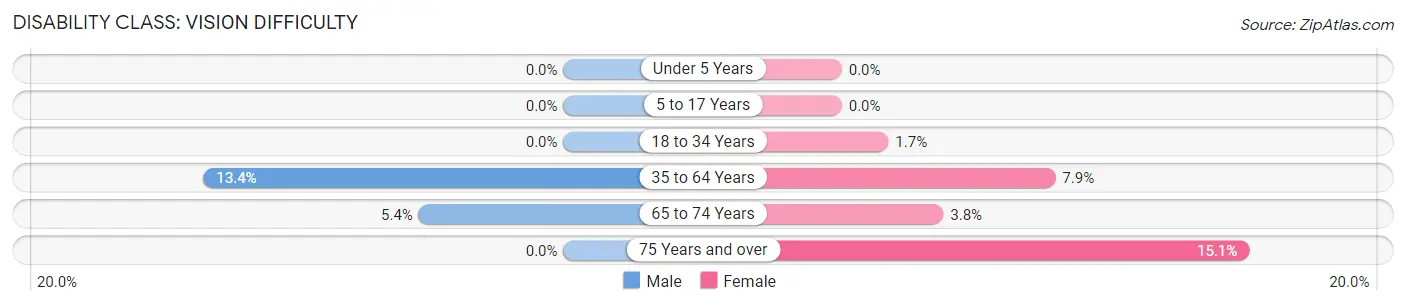
| Age Bracket | Male | Female |
| Under 5 Years | 0 (0.0%) | 0 (0.0%) |
| 5 to 17 Years | 0 (0.0%) | 0 (0.0%) |
| 18 to 34 Years | 0 (0.0%) | 14 (1.7%) |
| 35 to 64 Years | 107 (13.4%) | 58 (7.9%) |
| 65 to 74 Years | 8 (5.4%) | 8 (3.8%) |
| 75 Years and over | 0 (0.0%) | 13 (15.1%) |
Disability Class: Cognitive Difficulty
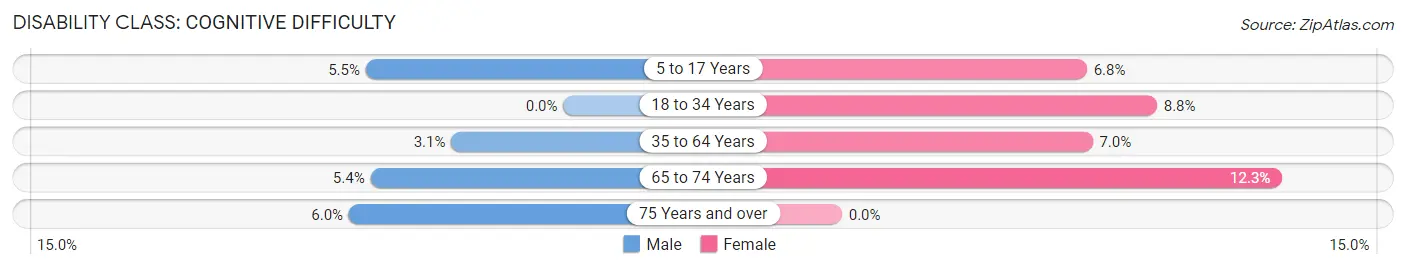
| Age Bracket | Male | Female |
| 5 to 17 Years | 24 (5.5%) | 27 (6.8%) |
| 18 to 34 Years | 0 (0.0%) | 71 (8.8%) |
| 35 to 64 Years | 25 (3.1%) | 51 (7.0%) |
| 65 to 74 Years | 8 (5.4%) | 26 (12.3%) |
| 75 Years and over | 8 (6.0%) | 0 (0.0%) |
Disability Class: Ambulatory Difficulty
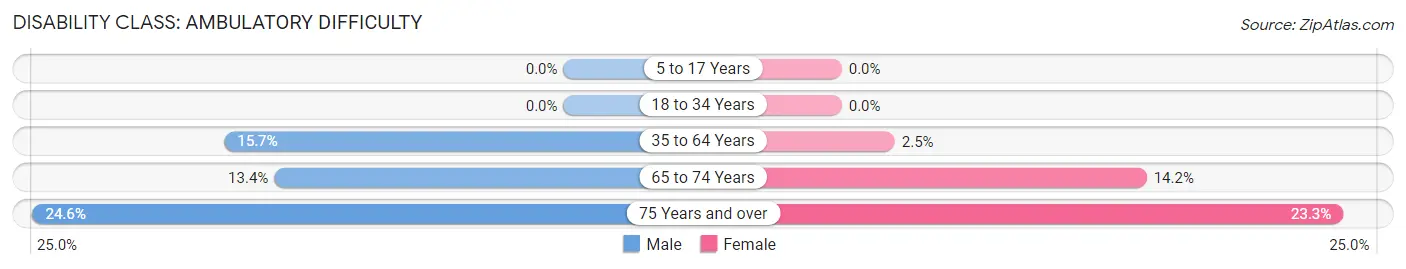
| Age Bracket | Male | Female |
| 5 to 17 Years | 0 (0.0%) | 0 (0.0%) |
| 18 to 34 Years | 0 (0.0%) | 0 (0.0%) |
| 35 to 64 Years | 126 (15.7%) | 18 (2.5%) |
| 65 to 74 Years | 20 (13.4%) | 30 (14.1%) |
| 75 Years and over | 33 (24.6%) | 20 (23.3%) |
Disability Class: Self-Care Difficulty
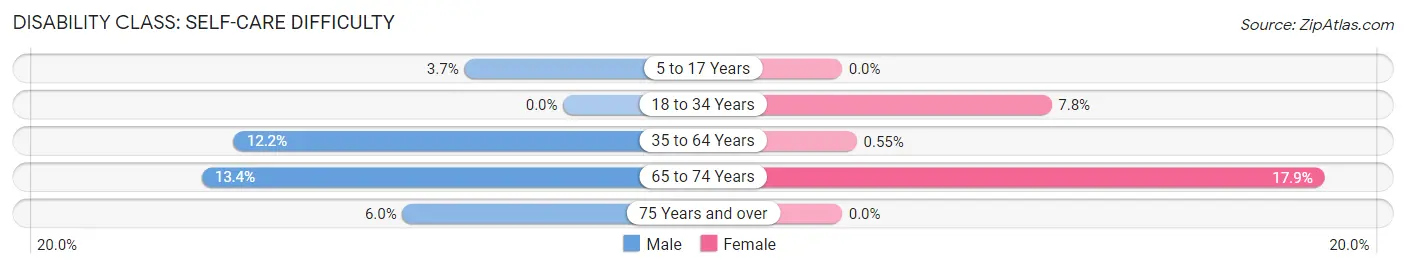
| Age Bracket | Male | Female |
| 5 to 17 Years | 16 (3.7%) | 0 (0.0%) |
| 18 to 34 Years | 0 (0.0%) | 63 (7.8%) |
| 35 to 64 Years | 98 (12.2%) | 4 (0.5%) |
| 65 to 74 Years | 20 (13.4%) | 38 (17.9%) |
| 75 Years and over | 8 (6.0%) | 0 (0.0%) |
Technology Access in Cochran
Computing Device Access in Cochran
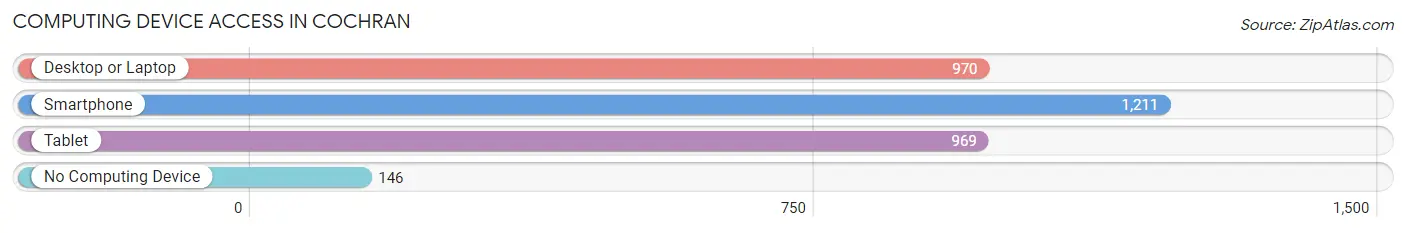
| Device Type | # Households | % Households |
| Desktop or Laptop | 970 | 67.3% |
| Smartphone | 1,211 | 84.0% |
| Tablet | 969 | 67.2% |
| No Computing Device | 146 | 10.1% |
| Total | 1,442 | 100.0% |
Internet Access in Cochran
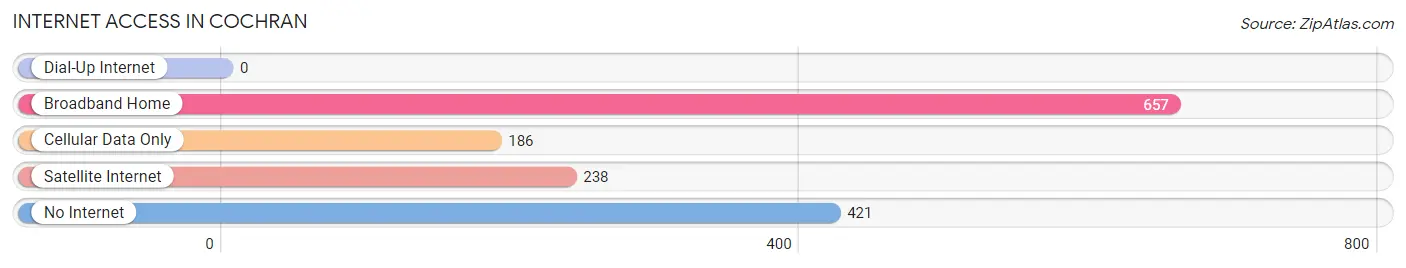
| Internet Type | # Households | % Households |
| Dial-Up Internet | 0 | 0.0% |
| Broadband Home | 657 | 45.6% |
| Cellular Data Only | 186 | 12.9% |
| Satellite Internet | 238 | 16.5% |
| No Internet | 421 | 29.2% |
| Total | 1,442 | 100.0% |
Cochran Summary
Cochran, Georgia is a small city located in Bleckley County in the southeastern part of the state. It is situated about halfway between Macon and Savannah, and is part of the larger Macon-Warner Robins metropolitan area. The city has a population of 5,939 people, according to the 2010 census, and is the county seat of Bleckley County.
History
Cochran was founded in 1871 by the Georgia General Assembly, and was named after Judge Thomas W. Cochran, a prominent local judge. The city was incorporated in 1872, and the first mayor was elected in 1873. The city was originally a farming community, and the main crops grown were cotton, corn, and peanuts.
In the early 1900s, the city began to grow and develop, and the first bank was established in 1906. The city also became a major railroad hub, with the Georgia and Florida Railroad running through the city. The railroad brought new businesses and industries to the city, and the population began to grow.
In the 1950s, the city began to experience a period of growth and development. The city was home to several manufacturing plants, including a cotton mill, a shoe factory, and a furniture factory. The city also became a major center for education, with the establishment of the Bleckley County School System in 1954.
Geography
Cochran is located in the southeastern part of the state, about halfway between Macon and Savannah. The city is situated in the Piedmont region of Georgia, and is part of the larger Macon-Warner Robins metropolitan area. The city is located at the intersection of U.S. Route 23 and Georgia State Route 26.
The city has a total area of 4.3 square miles, all of which is land. The city is located in a hilly area, and the highest point in the city is located at an elevation of 545 feet. The city is located in a humid subtropical climate zone, and the average annual temperature is around 70 degrees Fahrenheit.
Economy
Cochran’s economy is largely based on agriculture and manufacturing. The city is home to several manufacturing plants, including a cotton mill, a shoe factory, and a furniture factory. The city is also home to several agricultural businesses, including a peanut processing plant and a poultry processing plant.
The city is also home to several retail businesses, including a grocery store, a hardware store, and a variety of restaurants. The city is also home to several medical facilities, including a hospital and several clinics.
Demographics
According to the 2010 census, the population of Cochran was 5,939 people. The racial makeup of the city was 57.3% White, 37.2% African American, 0.3% Native American, 0.7% Asian, 0.1% Pacific Islander, and 4.4% from other races. The median household income was $30,945, and the median family income was $37,917.
Conclusion
Cochran, Georgia is a small city located in Bleckley County in the southeastern part of the state. It is situated about halfway between Macon and Savannah, and is part of the larger Macon-Warner Robins metropolitan area. The city has a population of 5,939 people, according to the 2010 census, and is the county seat of Bleckley County. The city’s economy is largely based on agriculture and manufacturing, and the city is home to several retail businesses, medical facilities, and educational institutions. The city is also home to a diverse population, with a majority of the population being White, African American, and other races.
Common Questions
What is Per Capita Income in Cochran?
Per Capita income in Cochran is $21,683.
What is the Median Family Income in Cochran?
Median Family Income in Cochran is $48,826.
What is the Median Household income in Cochran?
Median Household Income in Cochran is $31,326.
What is Income or Wage Gap in Cochran?
Income or Wage Gap in Cochran is 29.0%.
Women in Cochran earn 71.0 cents for every dollar earned by a man.
What is Inequality or Gini Index in Cochran?
Inequality or Gini Index in Cochran is 0.58.
What is the Total Population of Cochran?
Total Population of Cochran is 4,867.
What is the Total Male Population of Cochran?
Total Male Population of Cochran is 2,386.
What is the Total Female Population of Cochran?
Total Female Population of Cochran is 2,481.
What is the Ratio of Males per 100 Females in Cochran?
There are 96.17 Males per 100 Females in Cochran.
What is the Ratio of Females per 100 Males in Cochran?
There are 103.98 Females per 100 Males in Cochran.
What is the Median Population Age in Cochran?
Median Population Age in Cochran is 28.9 Years.
What is the Average Family Size in Cochran
Average Family Size in Cochran is 3.3 People.
What is the Average Household Size in Cochran
Average Household Size in Cochran is 2.7 People.
How Large is the Labor Force in Cochran?
There are 1,832 People in the Labor Forcein in Cochran.
What is the Percentage of People in the Labor Force in Cochran?
47.6% of People are in the Labor Force in Cochran.
What is the Unemployment Rate in Cochran?
Unemployment Rate in Cochran is 10.5%.