Bartow, GA Map & Demographics
Bartow Map
Bartow Overview
$40,314
PER CAPITA INCOME
$61,000
AVG FAMILY INCOME
$43,750
AVG HOUSEHOLD INCOME
7.4%
WAGE / INCOME GAP [ % ]
92.6¢/ $1
WAGE / INCOME GAP [ $ ]
0.42
INEQUALITY / GINI INDEX
219
TOTAL POPULATION
130
MALE POPULATION
89
FEMALE POPULATION
146.07
MALES / 100 FEMALES
68.46
FEMALES / 100 MALES
59.5
MEDIAN AGE
2.3
AVG FAMILY SIZE
1.6
AVG HOUSEHOLD SIZE
141
LABOR FORCE [ PEOPLE ]
65.3%
PERCENT IN LABOR FORCE
3.5%
UNEMPLOYMENT RATE
Bartow Zip Codes
Bartow Area Codes
Income in Bartow
Income Overview in Bartow
Per Capita Income in Bartow is $40,314, while median incomes of families and households are $61,000 and $43,750 respectively.
| Characteristic | Number | Measure |
| Per Capita Income | 219 | $40,314 |
| Median Family Income | 60 | $61,000 |
| Mean Family Income | 60 | $84,363 |
| Median Household Income | 140 | $43,750 |
| Mean Household Income | 140 | $61,952 |
| Income Deficit | 60 | $0 |
| Wage / Income Gap (%) | 219 | 7.40% |
| Wage / Income Gap ($) | 219 | 92.60¢ per $1 |
| Gini / Inequality Index | 219 | 0.42 |
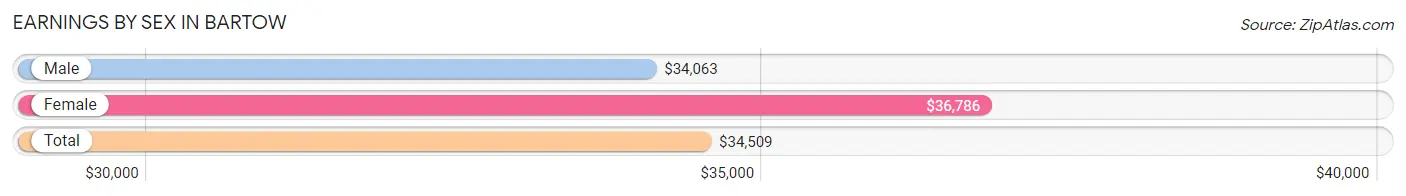
Earnings by Sex in Bartow
Average Earnings in Bartow are $34,509, $34,063 for men and $36,786 for women, a difference of 7.4%.
| Sex | Number | Average Earnings |
| Male | 97 (68.8%) | $34,063 |
| Female | 44 (31.2%) | $36,786 |
| Total | 141 (100.0%) | $34,509 |
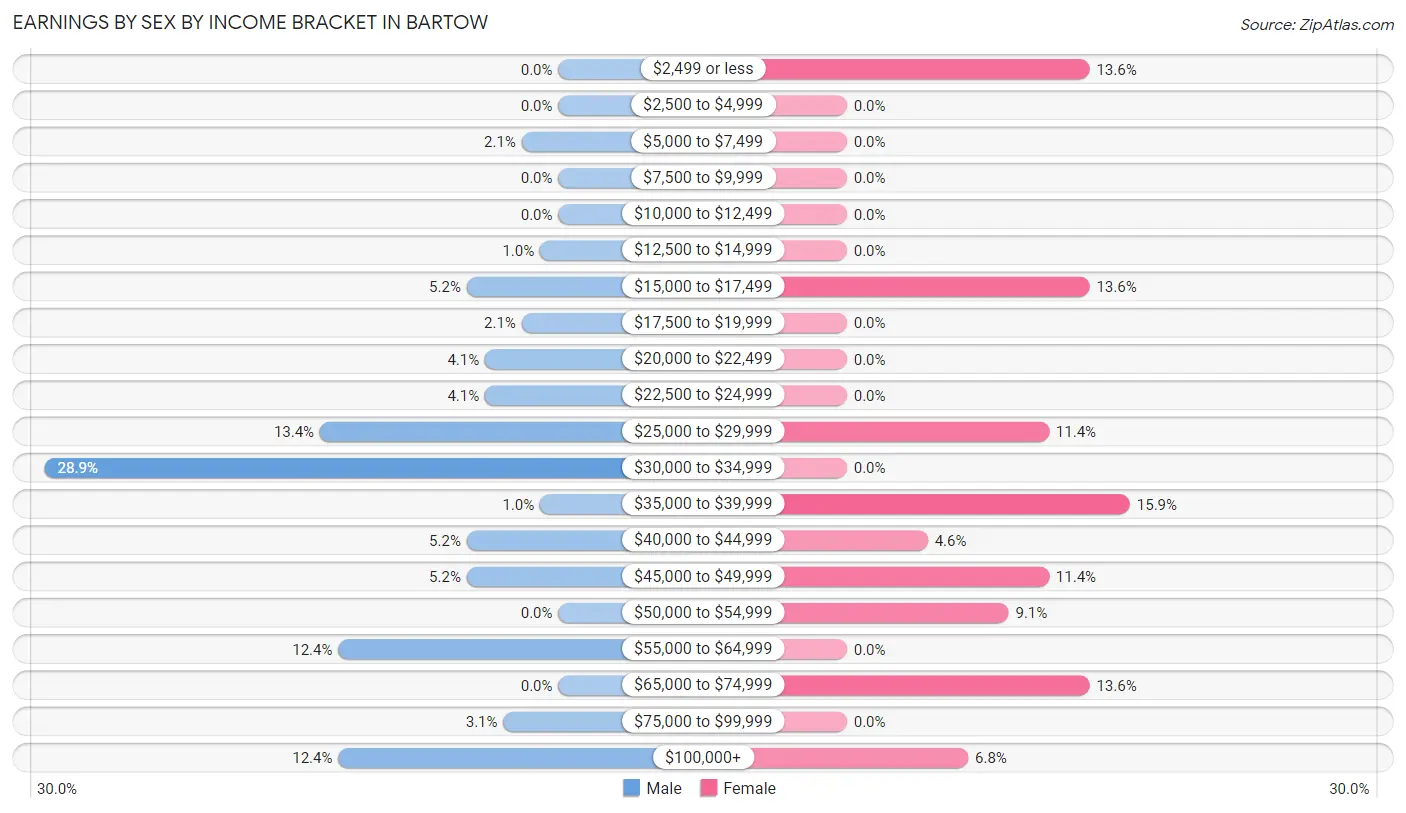
Earnings by Sex by Income Bracket in Bartow
The most common earnings brackets in Bartow are $30,000 to $34,999 for men (28 | 28.9%) and $35,000 to $39,999 for women (7 | 15.9%).
| Income | Male | Female |
| $2,499 or less | 0 (0.0%) | 6 (13.6%) |
| $2,500 to $4,999 | 0 (0.0%) | 0 (0.0%) |
| $5,000 to $7,499 | 2 (2.1%) | 0 (0.0%) |
| $7,500 to $9,999 | 0 (0.0%) | 0 (0.0%) |
| $10,000 to $12,499 | 0 (0.0%) | 0 (0.0%) |
| $12,500 to $14,999 | 1 (1.0%) | 0 (0.0%) |
| $15,000 to $17,499 | 5 (5.1%) | 6 (13.6%) |
| $17,500 to $19,999 | 2 (2.1%) | 0 (0.0%) |
| $20,000 to $22,499 | 4 (4.1%) | 0 (0.0%) |
| $22,500 to $24,999 | 4 (4.1%) | 0 (0.0%) |
| $25,000 to $29,999 | 13 (13.4%) | 5 (11.4%) |
| $30,000 to $34,999 | 28 (28.9%) | 0 (0.0%) |
| $35,000 to $39,999 | 1 (1.0%) | 7 (15.9%) |
| $40,000 to $44,999 | 5 (5.1%) | 2 (4.5%) |
| $45,000 to $49,999 | 5 (5.1%) | 5 (11.4%) |
| $50,000 to $54,999 | 0 (0.0%) | 4 (9.1%) |
| $55,000 to $64,999 | 12 (12.4%) | 0 (0.0%) |
| $65,000 to $74,999 | 0 (0.0%) | 6 (13.6%) |
| $75,000 to $99,999 | 3 (3.1%) | 0 (0.0%) |
| $100,000+ | 12 (12.4%) | 3 (6.8%) |
| Total | 97 (100.0%) | 44 (100.0%) |
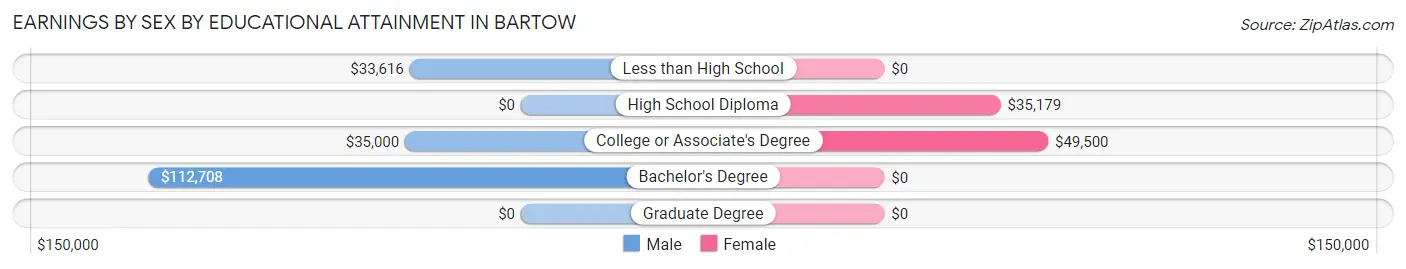
Earnings by Sex by Educational Attainment in Bartow
Average earnings in Bartow are $34,063 for men and $43,750 for women, a difference of 22.1%. Men with an educational attainment of bachelor's degree enjoy the highest average annual earnings of $112,708, while those with less than high school education earn the least with $33,616. Women with an educational attainment of college or associate's degree earn the most with the average annual earnings of $49,500, while those with high school diploma education have the smallest earnings of $35,179.
| Educational Attainment | Male Income | Female Income |
| Less than High School | $33,616 | $0 |
| High School Diploma | - | - |
| College or Associate's Degree | $35,000 | $49,500 |
| Bachelor's Degree | $112,708 | $0 |
| Graduate Degree | - | - |
| Total | $34,063 | $43,750 |
Family Income in Bartow
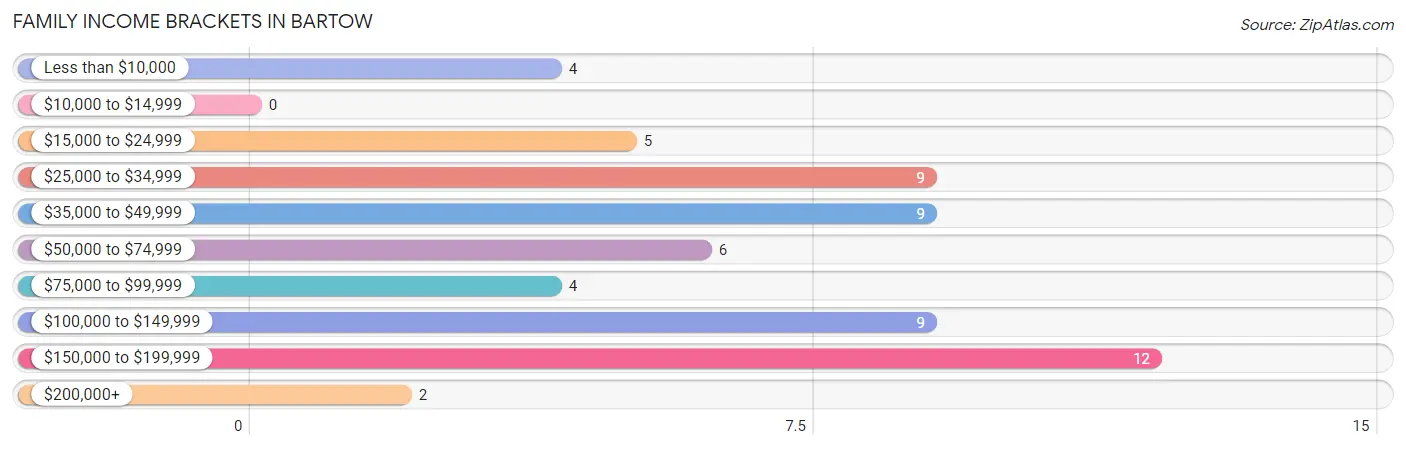
Family Income Brackets in Bartow
According to the Bartow family income data, there are 12 families falling into the $150,000 to $199,999 income range, which is the most common income bracket and makes up 20.0% of all families.
| Income Bracket | # Families | % Families |
| Less than $10,000 | 4 | 6.7% |
| $10,000 to $14,999 | 0 | 0.0% |
| $15,000 to $24,999 | 5 | 8.3% |
| $25,000 to $34,999 | 9 | 15.0% |
| $35,000 to $49,999 | 9 | 15.0% |
| $50,000 to $74,999 | 6 | 10.0% |
| $75,000 to $99,999 | 4 | 6.7% |
| $100,000 to $149,999 | 9 | 15.0% |
| $150,000 to $199,999 | 12 | 20.0% |
| $200,000+ | 2 | 3.3% |
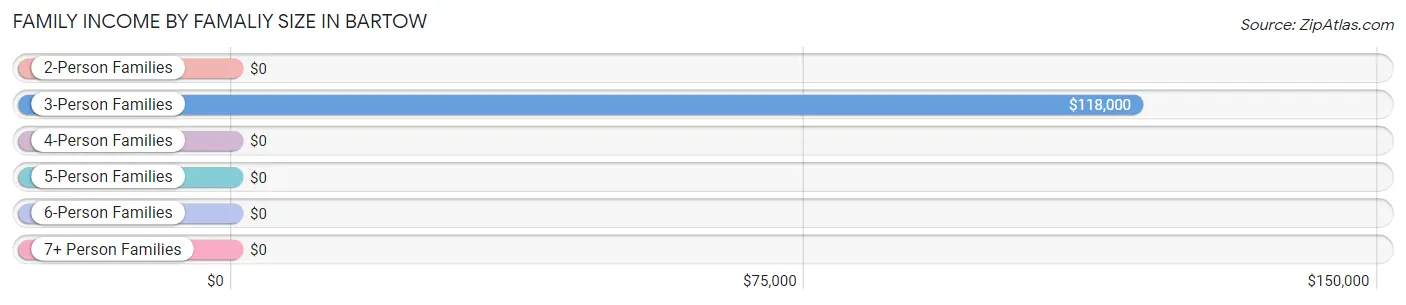
Family Income by Famaliy Size in Bartow
3-person families (8 | 13.3%) account for the highest median family income in Bartow with $118,000 per family, while 3-person families (8 | 13.3%) have the highest median income of $39,333 per family member.
| Income Bracket | # Families | Median Income |
| 2-Person Families | 50 (83.3%) | $0 |
| 3-Person Families | 8 (13.3%) | $118,000 |
| 4-Person Families | 2 (3.3%) | $0 |
| 5-Person Families | 0 (0.0%) | $0 |
| 6-Person Families | 0 (0.0%) | $0 |
| 7+ Person Families | 0 (0.0%) | $0 |
| Total | 60 (100.0%) | $61,000 |
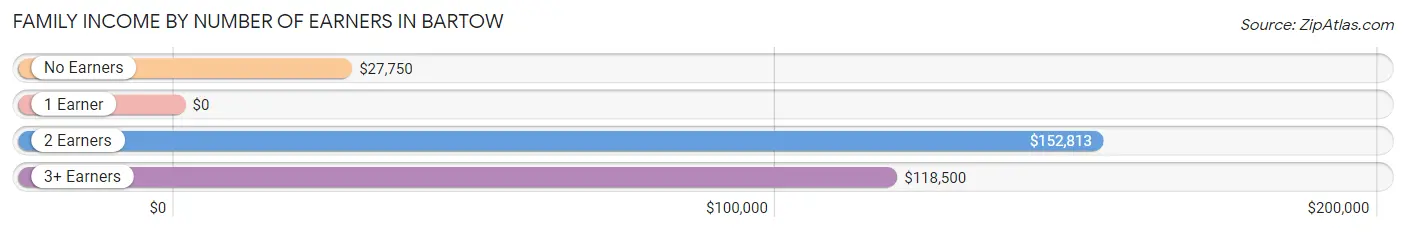
Family Income by Number of Earners in Bartow
| Number of Earners | # Families | Median Income |
| No Earners | 19 (31.7%) | $27,750 |
| 1 Earner | 12 (20.0%) | $0 |
| 2 Earners | 21 (35.0%) | $152,813 |
| 3+ Earners | 8 (13.3%) | $118,500 |
| Total | 60 (100.0%) | $61,000 |
Household Income in Bartow
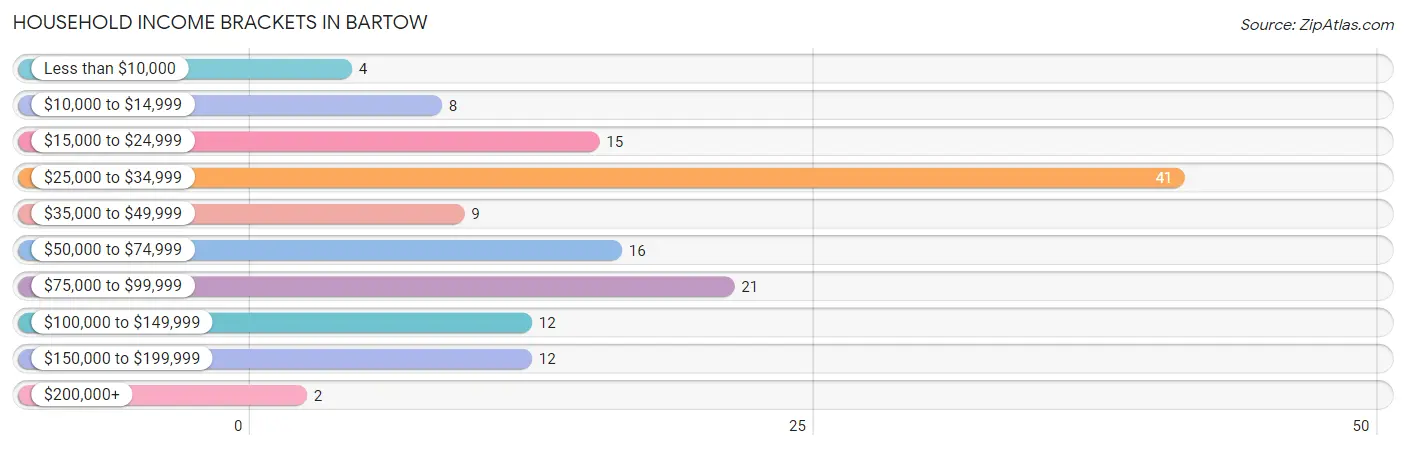
Household Income Brackets in Bartow
With 41 households falling in the category, the $25,000 to $34,999 income range is the most frequent in Bartow, accounting for 29.3% of all households. In contrast, only 2 households (1.4%) fall into the $200,000+ income bracket, making it the least populous group.
| Income Bracket | # Households | % Households |
| Less than $10,000 | 4 | 2.9% |
| $10,000 to $14,999 | 8 | 5.7% |
| $15,000 to $24,999 | 15 | 10.7% |
| $25,000 to $34,999 | 41 | 29.3% |
| $35,000 to $49,999 | 9 | 6.4% |
| $50,000 to $74,999 | 16 | 11.4% |
| $75,000 to $99,999 | 21 | 15.0% |
| $100,000 to $149,999 | 12 | 8.6% |
| $150,000 to $199,999 | 12 | 8.6% |
| $200,000+ | 2 | 1.4% |
Household Income by Householder Age in Bartow
The median household income in Bartow is $43,750, with the highest median household income of $88,750 found in the 45 to 64 years age bracket for the primary householder. A total of 52 households (37.1%) fall into this category.
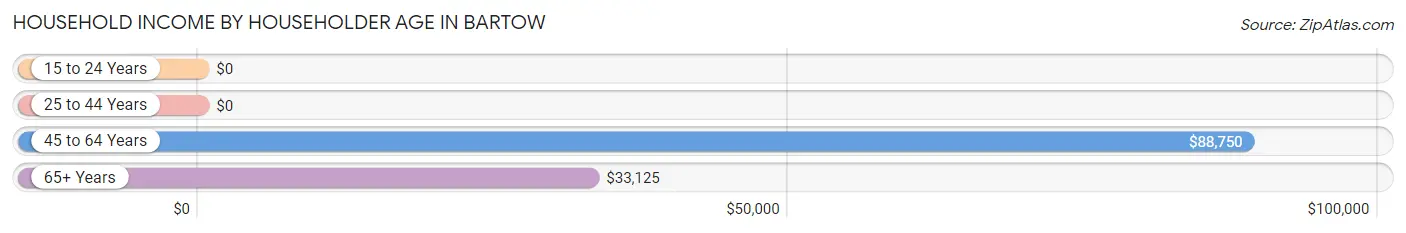
| Income Bracket | # Households | Median Income |
| 15 to 24 Years | 0 (0.0%) | $0 |
| 25 to 44 Years | 32 (22.9%) | $0 |
| 45 to 64 Years | 52 (37.1%) | $88,750 |
| 65+ Years | 56 (40.0%) | $33,125 |
| Total | 140 (100.0%) | $43,750 |
Poverty in Bartow
Income Below Poverty by Sex and Age in Bartow
With 7.7% poverty level for males and 10.1% for females among the residents of Bartow, 65 to 74 year old males and 65 to 74 year old females are the most vulnerable to poverty, with 6 males (22.2%) and 2 females (15.4%) in their respective age groups living below the poverty level.
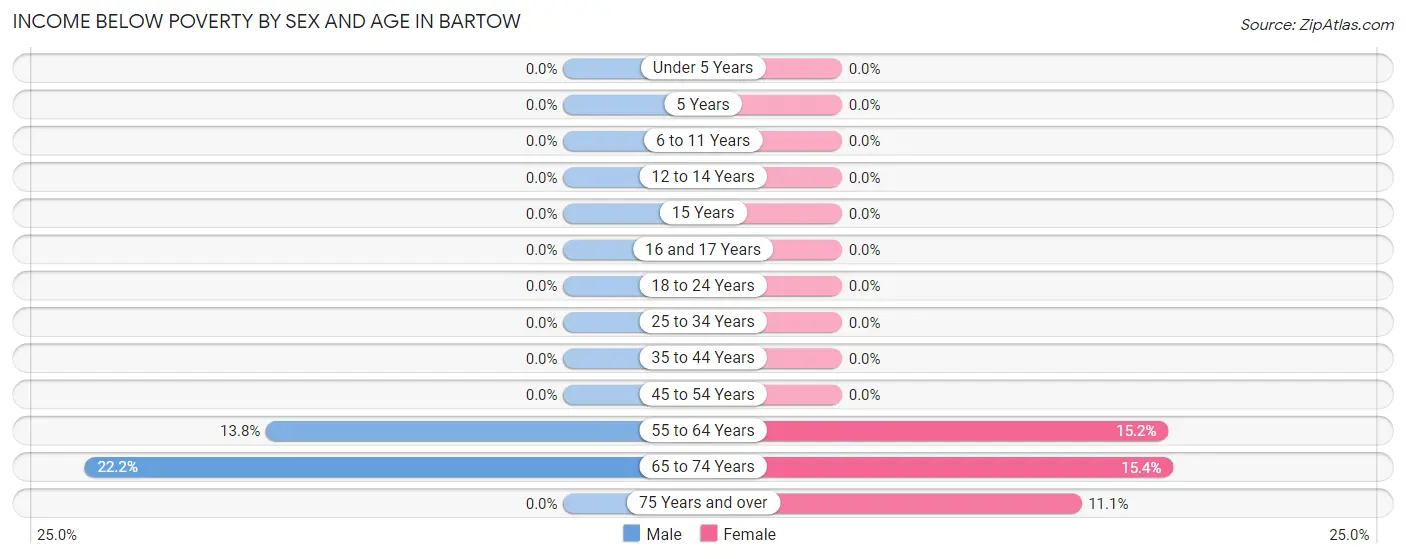
| Age Bracket | Male | Female |
| Under 5 Years | 0 (0.0%) | 0 (0.0%) |
| 5 Years | 0 (0.0%) | 0 (0.0%) |
| 6 to 11 Years | 0 (0.0%) | 0 (0.0%) |
| 12 to 14 Years | 0 (0.0%) | 0 (0.0%) |
| 15 Years | 0 (0.0%) | 0 (0.0%) |
| 16 and 17 Years | 0 (0.0%) | 0 (0.0%) |
| 18 to 24 Years | 0 (0.0%) | 0 (0.0%) |
| 25 to 34 Years | 0 (0.0%) | 0 (0.0%) |
| 35 to 44 Years | 0 (0.0%) | 0 (0.0%) |
| 45 to 54 Years | 0 (0.0%) | 0 (0.0%) |
| 55 to 64 Years | 4 (13.8%) | 5 (15.1%) |
| 65 to 74 Years | 6 (22.2%) | 2 (15.4%) |
| 75 Years and over | 0 (0.0%) | 2 (11.1%) |
| Total | 10 (7.7%) | 9 (10.1%) |
Income Above Poverty by Sex and Age in Bartow
According to the poverty statistics in Bartow, males aged 25 to 34 years and females aged 6 to 11 years are the age groups that are most secure financially, with 100.0% of males and 100.0% of females in these age groups living above the poverty line.
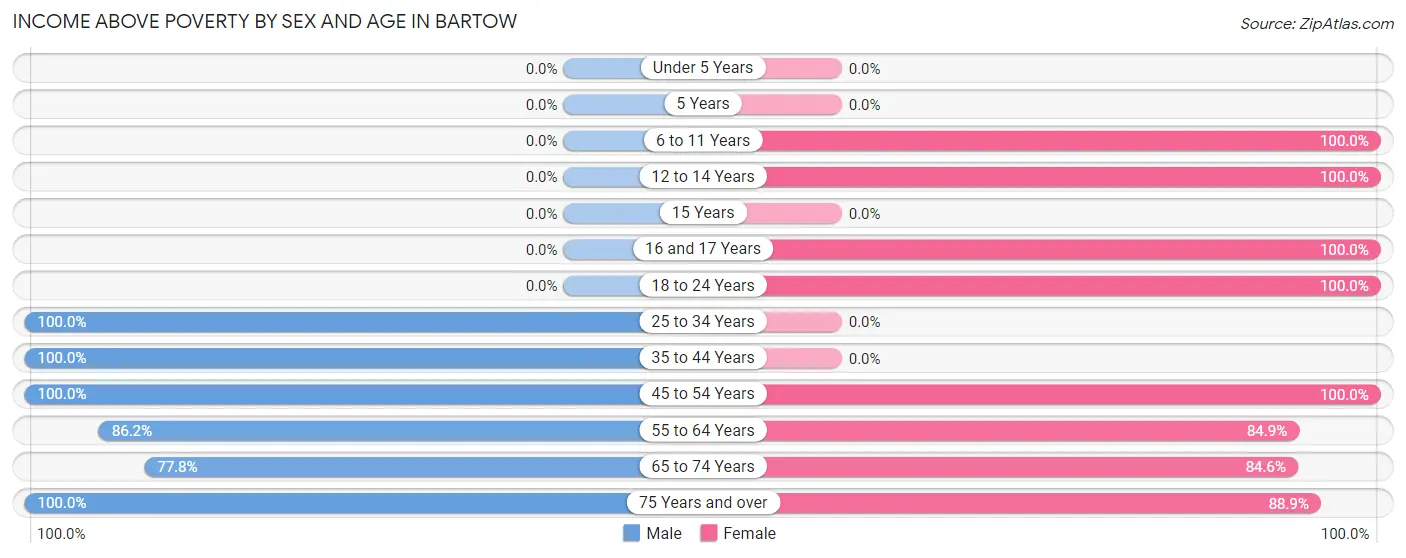
| Age Bracket | Male | Female |
| Under 5 Years | 0 (0.0%) | 0 (0.0%) |
| 5 Years | 0 (0.0%) | 0 (0.0%) |
| 6 to 11 Years | 0 (0.0%) | 2 (100.0%) |
| 12 to 14 Years | 0 (0.0%) | 1 (100.0%) |
| 15 Years | 0 (0.0%) | 0 (0.0%) |
| 16 and 17 Years | 0 (0.0%) | 6 (100.0%) |
| 18 to 24 Years | 0 (0.0%) | 3 (100.0%) |
| 25 to 34 Years | 5 (100.0%) | 0 (0.0%) |
| 35 to 44 Years | 37 (100.0%) | 0 (0.0%) |
| 45 to 54 Years | 13 (100.0%) | 13 (100.0%) |
| 55 to 64 Years | 25 (86.2%) | 28 (84.9%) |
| 65 to 74 Years | 21 (77.8%) | 11 (84.6%) |
| 75 Years and over | 19 (100.0%) | 16 (88.9%) |
| Total | 120 (92.3%) | 80 (89.9%) |
Income Below Poverty Among Married-Couple Families in Bartow
The poverty statistics for married-couple families in Bartow show that 4.0% or 2 of the total 50 families live below the poverty line. Families with no children have the highest poverty rate of 4.8%, comprising of 2 families. On the other hand, families with 1 or 2 children have the lowest poverty rate of 0.0%, which includes 0 families.
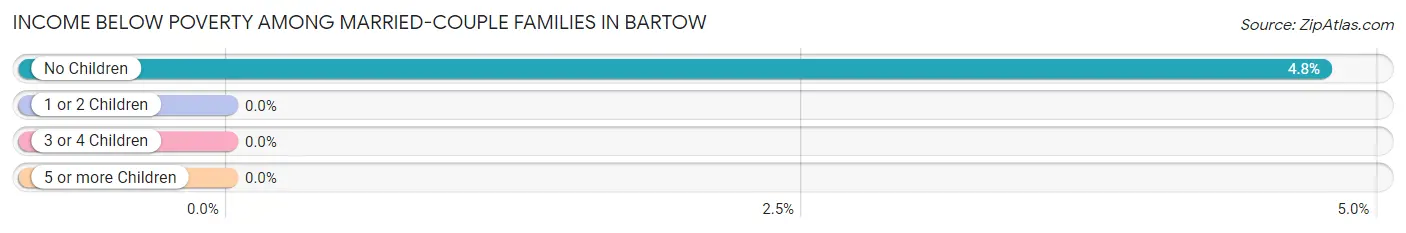
| Children | Above Poverty | Below Poverty |
| No Children | 40 (95.2%) | 2 (4.8%) |
| 1 or 2 Children | 8 (100.0%) | 0 (0.0%) |
| 3 or 4 Children | 0 (0.0%) | 0 (0.0%) |
| 5 or more Children | 0 (0.0%) | 0 (0.0%) |
| Total | 48 (96.0%) | 2 (4.0%) |
Income Below Poverty Among Single-Parent Households in Bartow
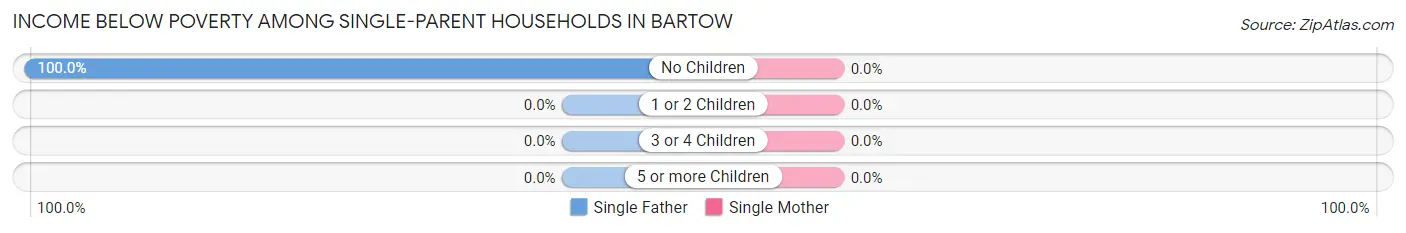
| Children | Single Father | Single Mother |
| No Children | 2 (100.0%) | 0 (0.0%) |
| 1 or 2 Children | 0 (0.0%) | 0 (0.0%) |
| 3 or 4 Children | 0 (0.0%) | 0 (0.0%) |
| 5 or more Children | 0 (0.0%) | 0 (0.0%) |
| Total | 2 (100.0%) | 0 (0.0%) |
Income Below Poverty Among Married-Couple vs Single-Parent Households in Bartow
The poverty data for Bartow shows that 2 of the married-couple family households (4.0%) and 2 of the single-parent households (20.0%) are living below the poverty level. Within the married-couple family households, those with no children have the highest poverty rate, with 2 households (4.8%) falling below the poverty line. Among the single-parent households, those with no children have the highest poverty rate, with 2 household (20.0%) living below poverty.
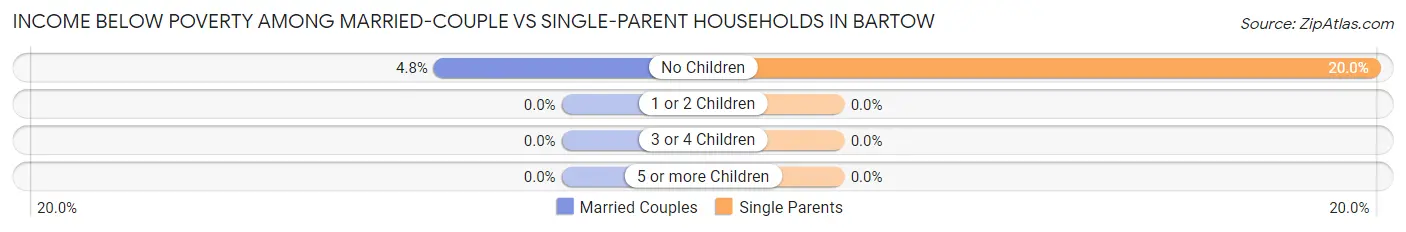
| Children | Married-Couple Families | Single-Parent Households |
| No Children | 2 (4.8%) | 2 (20.0%) |
| 1 or 2 Children | 0 (0.0%) | 0 (0.0%) |
| 3 or 4 Children | 0 (0.0%) | 0 (0.0%) |
| 5 or more Children | 0 (0.0%) | 0 (0.0%) |
| Total | 2 (4.0%) | 2 (20.0%) |
Race in Bartow
The most populous races in Bartow are White / Caucasian (120 | 54.8%), Black / African American (97 | 44.3%), and Two or more Races (2 | 0.9%).
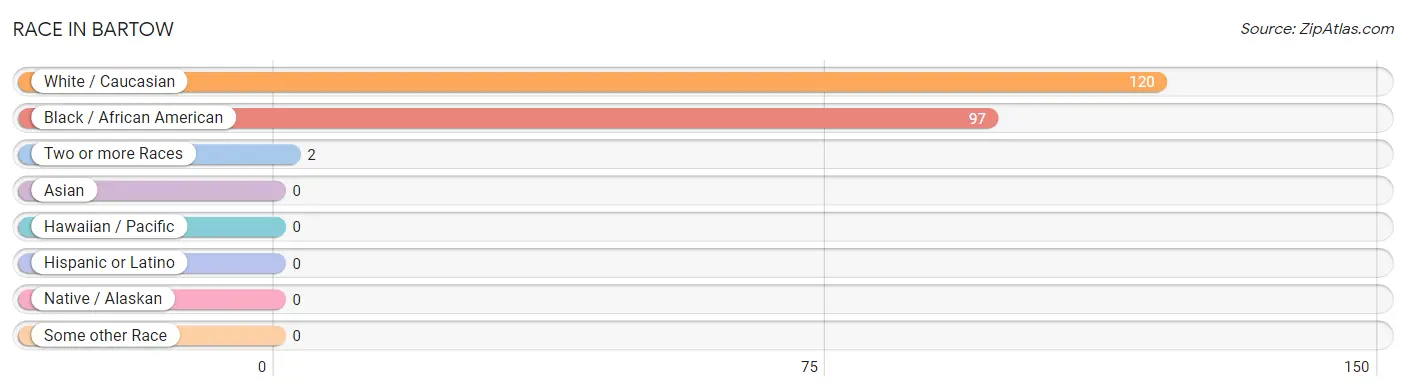
| Race | # Population | % Population |
| Asian | 0 | 0.0% |
| Black / African American | 97 | 44.3% |
| Hawaiian / Pacific | 0 | 0.0% |
| Hispanic or Latino | 0 | 0.0% |
| Native / Alaskan | 0 | 0.0% |
| White / Caucasian | 120 | 54.8% |
| Two or more Races | 2 | 0.9% |
| Some other Race | 0 | 0.0% |
| Total | 219 | 100.0% |
Ancestry in Bartow
The most populous ancestries reported in Bartow are English (54 | 24.7%), American (31 | 14.2%), European (6 | 2.7%), German (6 | 2.7%), and Irish (2 | 0.9%), together accounting for 45.2% of all Bartow residents.
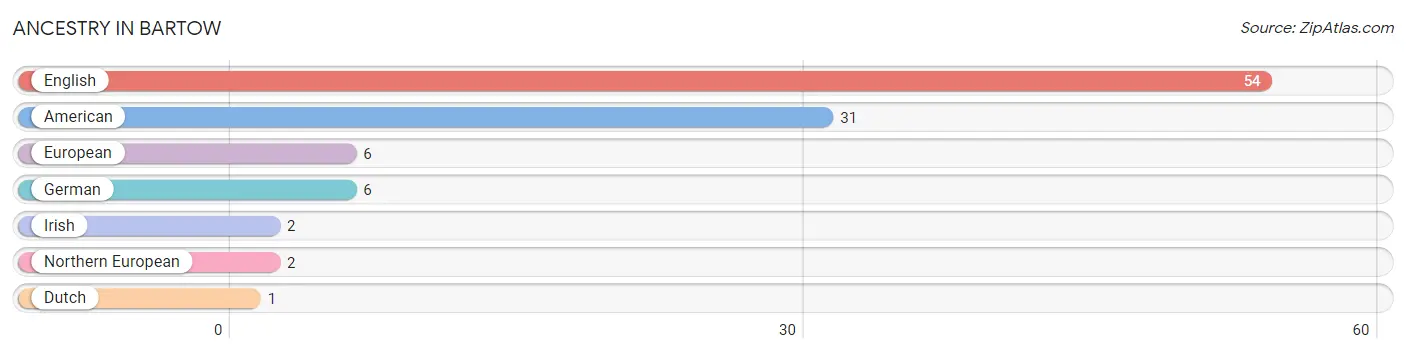
| Ancestry | # Population | % Population |
| American | 31 | 14.2% |
| Dutch | 1 | 0.5% |
| English | 54 | 24.7% |
| European | 6 | 2.7% |
| German | 6 | 2.7% |
| Irish | 2 | 0.9% |
| Northern European | 2 | 0.9% | View All 7 Rows |
Immigrants in Bartow

| Immigration Origin | # Population | % Population | View All 0 Rows |
Sex and Age in Bartow
Sex and Age in Bartow
The most populous age groups in Bartow are 40 to 44 Years (32 | 24.6%) for men and 55 to 59 Years (27 | 30.3%) for women.
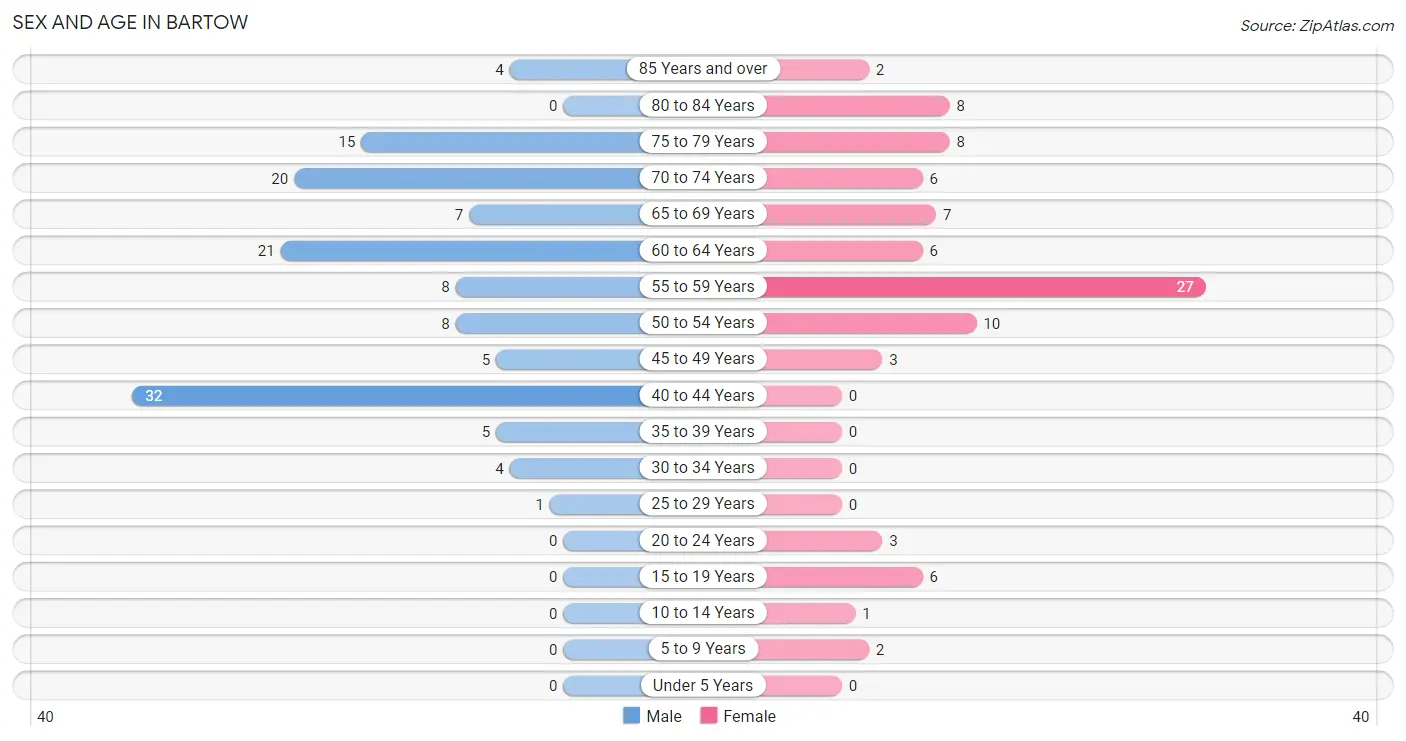
| Age Bracket | Male | Female |
| Under 5 Years | 0 (0.0%) | 0 (0.0%) |
| 5 to 9 Years | 0 (0.0%) | 2 (2.2%) |
| 10 to 14 Years | 0 (0.0%) | 1 (1.1%) |
| 15 to 19 Years | 0 (0.0%) | 6 (6.7%) |
| 20 to 24 Years | 0 (0.0%) | 3 (3.4%) |
| 25 to 29 Years | 1 (0.8%) | 0 (0.0%) |
| 30 to 34 Years | 4 (3.1%) | 0 (0.0%) |
| 35 to 39 Years | 5 (3.8%) | 0 (0.0%) |
| 40 to 44 Years | 32 (24.6%) | 0 (0.0%) |
| 45 to 49 Years | 5 (3.8%) | 3 (3.4%) |
| 50 to 54 Years | 8 (6.1%) | 10 (11.2%) |
| 55 to 59 Years | 8 (6.1%) | 27 (30.3%) |
| 60 to 64 Years | 21 (16.2%) | 6 (6.7%) |
| 65 to 69 Years | 7 (5.4%) | 7 (7.9%) |
| 70 to 74 Years | 20 (15.4%) | 6 (6.7%) |
| 75 to 79 Years | 15 (11.5%) | 8 (9.0%) |
| 80 to 84 Years | 0 (0.0%) | 8 (9.0%) |
| 85 Years and over | 4 (3.1%) | 2 (2.2%) |
| Total | 130 (100.0%) | 89 (100.0%) |
Families and Households in Bartow
Median Family Size in Bartow
The median family size in Bartow is 2.27 persons per family, with single male/father families (2 | 3.3%) accounting for the largest median family size of 3.5 persons per family. On the other hand, single female/mother families (8 | 13.3%) represent the smallest median family size with 2.13 persons per family.
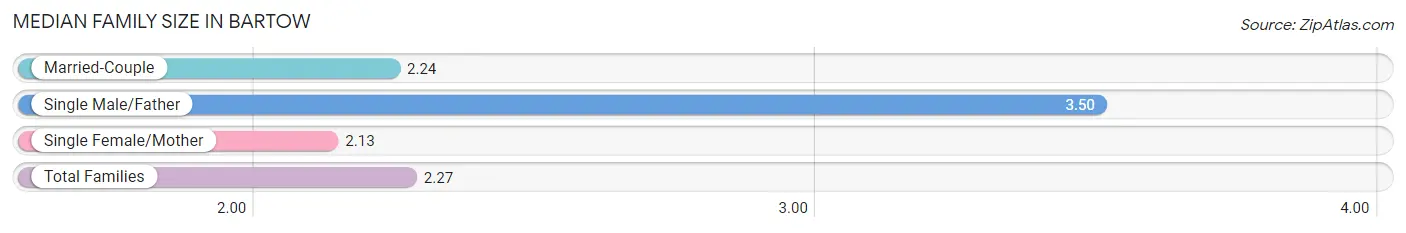
| Family Type | # Families | Family Size |
| Married-Couple | 50 (83.3%) | 2.24 |
| Single Male/Father | 2 (3.3%) | 3.50 |
| Single Female/Mother | 8 (13.3%) | 2.13 |
| Total Families | 60 (100.0%) | 2.27 |
Median Household Size in Bartow
The median household size in Bartow is 1.56 persons per household, with single male/father households (2 | 1.4%) accounting for the largest median household size of 3.5 persons per household. non-family households (80 | 57.1%) represent the smallest median household size with 1.04 persons per household.
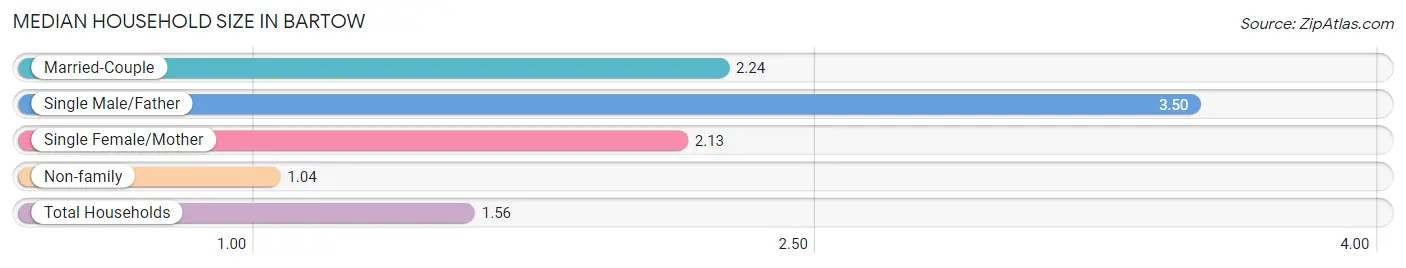
| Household Type | # Households | Household Size |
| Married-Couple | 50 (35.7%) | 2.24 |
| Single Male/Father | 2 (1.4%) | 3.50 |
| Single Female/Mother | 8 (5.7%) | 2.13 |
| Non-family | 80 (57.1%) | 1.04 |
| Total Households | 140 (100.0%) | 1.56 |
Household Size by Marriage Status in Bartow
Out of a total of 140 households in Bartow, 60 (42.9%) are family households, while 80 (57.1%) are nonfamily households. The most numerous type of family households are 2-person households, comprising 50, and the most common type of nonfamily households are 1-person households, comprising 77.
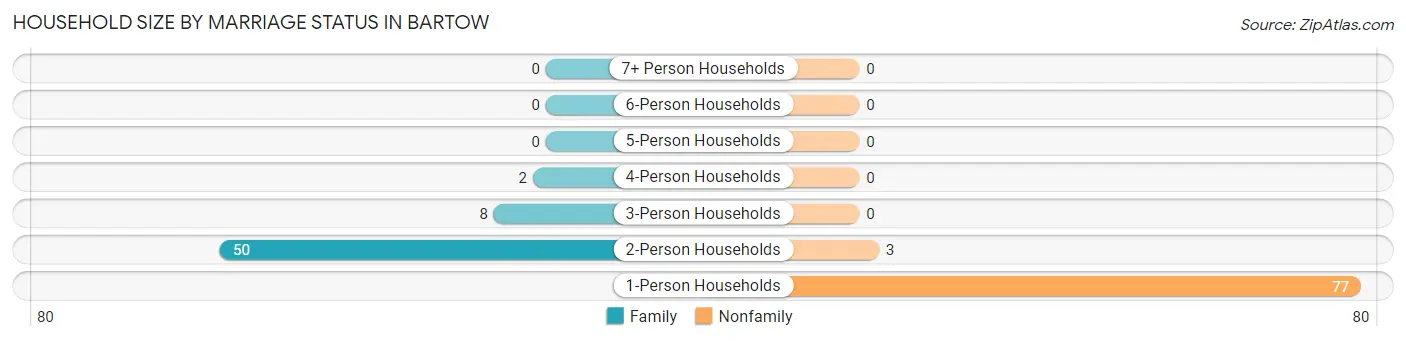
| Household Size | Family Households | Nonfamily Households |
| 1-Person Households | - | 77 (55.0%) |
| 2-Person Households | 50 (35.7%) | 3 (2.1%) |
| 3-Person Households | 8 (5.7%) | 0 (0.0%) |
| 4-Person Households | 2 (1.4%) | 0 (0.0%) |
| 5-Person Households | 0 (0.0%) | 0 (0.0%) |
| 6-Person Households | 0 (0.0%) | 0 (0.0%) |
| 7+ Person Households | 0 (0.0%) | 0 (0.0%) |
| Total | 60 (42.9%) | 80 (57.1%) |
Female Fertility in Bartow
Fertility by Age in Bartow
| Age Bracket | Women with Births | Births / 1,000 Women |
| 15 to 19 years | 0 (0.0%) | 0.0 |
| 20 to 34 years | 0 (0.0%) | 0.0 |
| 35 to 50 years | 0 (0.0%) | 0.0 |
| Total | 0 (0.0%) | 0.0 |
Fertility by Age by Marriage Status in Bartow
| Age Bracket | Married | Unmarried |
| 15 to 19 years | 0 (0.0%) | 0 (0.0%) |
| 20 to 34 years | 0 (0.0%) | 0 (0.0%) |
| 35 to 50 years | 0 (0.0%) | 0 (0.0%) |
| Total | 0 (0.0%) | 0 (0.0%) |
Fertility by Education in Bartow
| Educational Attainment | Women with Births | Births / 1,000 Women |
| Less than High School | 0 (0.0%) | 0.0 |
| High School Diploma | 0 (0.0%) | 0.0 |
| College or Associate's Degree | 0 (0.0%) | 0.0 |
| Bachelor's Degree | 0 (0.0%) | 0.0 |
| Graduate Degree | 0 (0.0%) | 0.0 |
| Total | 0 (0.0%) | 0.0 |
Fertility by Education by Marriage Status in Bartow
| Educational Attainment | Married | Unmarried |
| Less than High School | 0 (0.0%) | 0 (0.0%) |
| High School Diploma | 0 (0.0%) | 0 (0.0%) |
| College or Associate's Degree | 0 (0.0%) | 0 (0.0%) |
| Bachelor's Degree | 0 (0.0%) | 0 (0.0%) |
| Graduate Degree | 0 (0.0%) | 0 (0.0%) |
| Total | 0 (0.0%) | 0 (0.0%) |
Employment Characteristics in Bartow
Employment by Class of Employer in Bartow
Among the 136 employed individuals in Bartow, private company employees (90 | 66.2%), local government employees (16 | 11.8%), and self-employed (incorporated) (15 | 11.0%) make up the most common classes of employment.
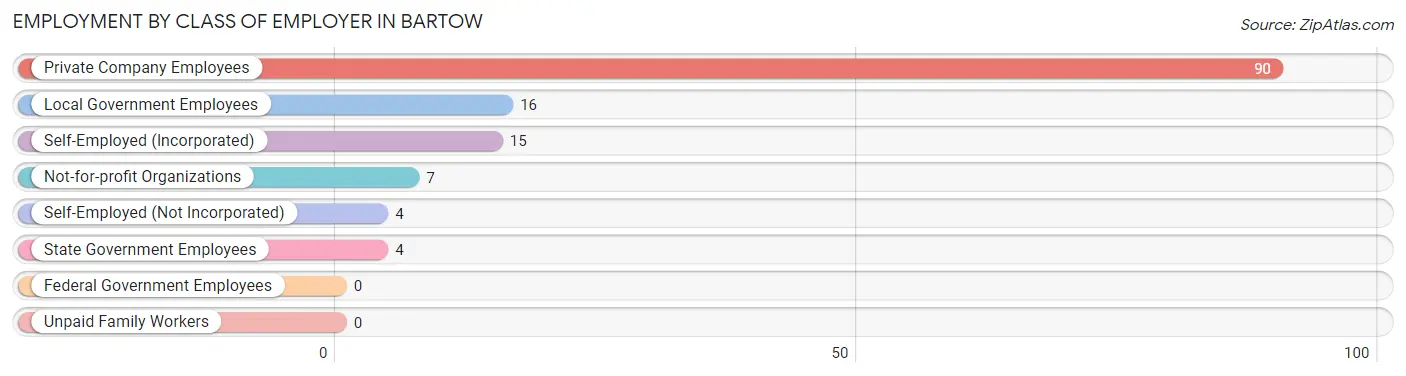
| Employer Class | # Employees | % Employees |
| Private Company Employees | 90 | 66.2% |
| Self-Employed (Incorporated) | 15 | 11.0% |
| Self-Employed (Not Incorporated) | 4 | 2.9% |
| Not-for-profit Organizations | 7 | 5.1% |
| Local Government Employees | 16 | 11.8% |
| State Government Employees | 4 | 2.9% |
| Federal Government Employees | 0 | 0.0% |
| Unpaid Family Workers | 0 | 0.0% |
| Total | 136 | 100.0% |
Employment Status by Age in Bartow
According to the labor force statistics for Bartow, out of the total population over 16 years of age (216), 65.3% or 141 individuals are in the labor force, with 3.5% or 5 of them unemployed. The age group with the highest labor force participation rate is 16 to 19 years, with 100.0% or 6 individuals in the labor force. Within the labor force, the 65 to 74 years age range has the highest percentage of unemployed individuals, with 100.0% or 5 of them being unemployed.
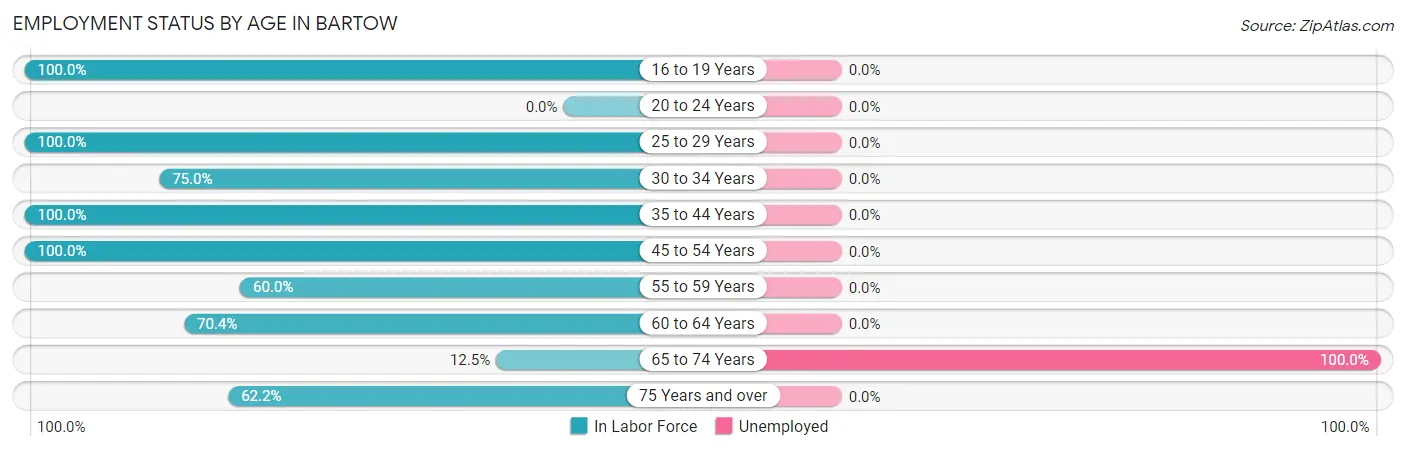
| Age Bracket | In Labor Force | Unemployed |
| 16 to 19 Years | 6 (100.0%) | 0 (0.0%) |
| 20 to 24 Years | 0 (0.0%) | 0 (0.0%) |
| 25 to 29 Years | 1 (100.0%) | 0 (0.0%) |
| 30 to 34 Years | 3 (75.0%) | 0 (0.0%) |
| 35 to 44 Years | 37 (100.0%) | 0 (0.0%) |
| 45 to 54 Years | 26 (100.0%) | 0 (0.0%) |
| 55 to 59 Years | 21 (60.0%) | 0 (0.0%) |
| 60 to 64 Years | 19 (70.4%) | 0 (0.0%) |
| 65 to 74 Years | 5 (12.5%) | 5 (100.0%) |
| 75 Years and over | 23 (62.2%) | 0 (0.0%) |
| Total | 141 (65.3%) | 5 (3.5%) |
Employment Status by Educational Attainment in Bartow
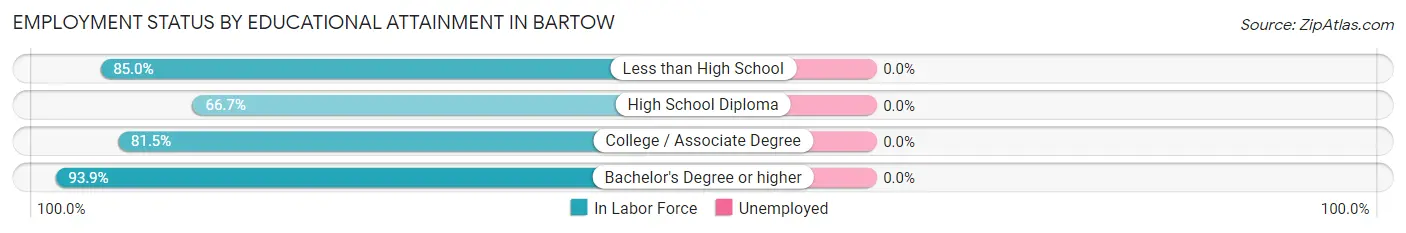
| Educational Attainment | In Labor Force | Unemployed |
| Less than High School | 34 (85.0%) | 0 (0.0%) |
| High School Diploma | 20 (66.7%) | 0 (0.0%) |
| College / Associate Degree | 22 (81.5%) | 0 (0.0%) |
| Bachelor's Degree or higher | 31 (93.9%) | 0 (0.0%) |
| Total | 107 (82.3%) | 0 (0.0%) |
Employment Occupations by Sex in Bartow
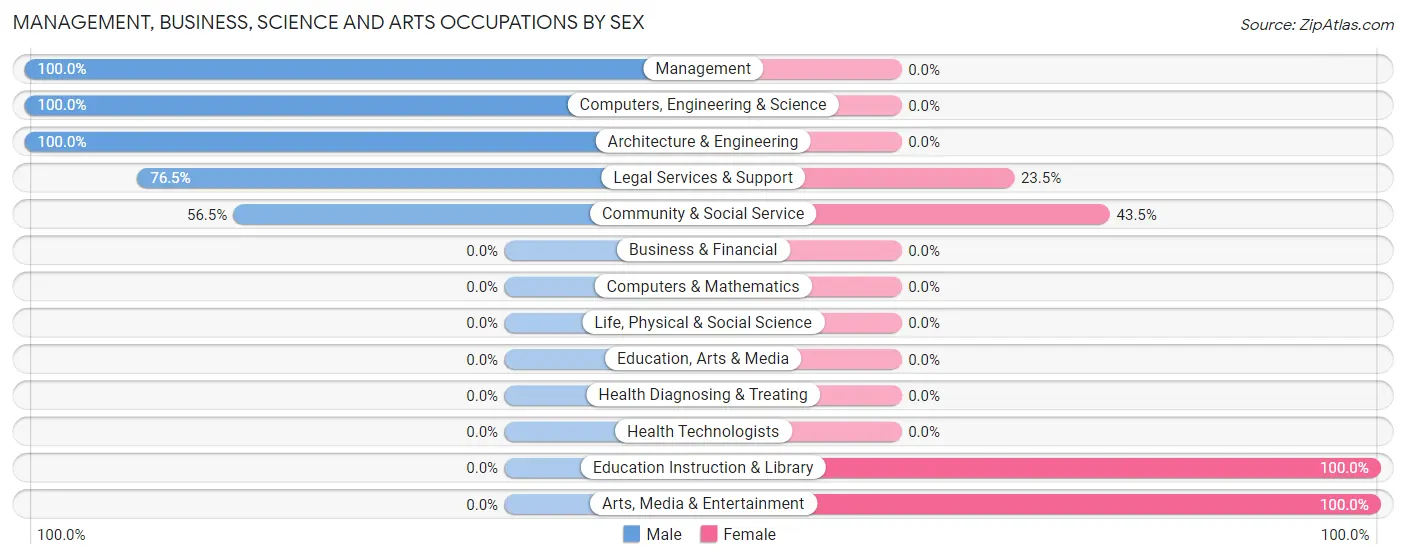
Management, Business, Science and Arts Occupations
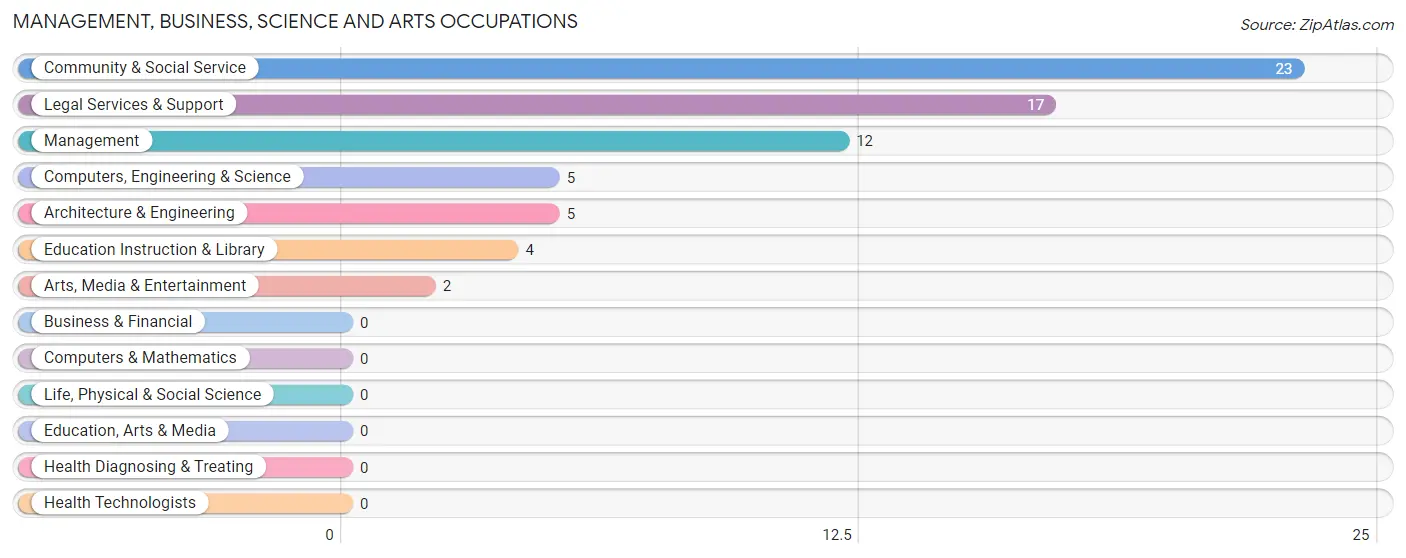
The most common Management, Business, Science and Arts occupations in Bartow are Community & Social Service (23 | 16.9%), Legal Services & Support (17 | 12.5%), Management (12 | 8.8%), Computers, Engineering & Science (5 | 3.7%), and Architecture & Engineering (5 | 3.7%).
Management, Business, Science and Arts Occupations by Sex
Within the Management, Business, Science and Arts occupations in Bartow, the most male-oriented occupations are Management (100.0%), Computers, Engineering & Science (100.0%), and Architecture & Engineering (100.0%), while the most female-oriented occupations are Education Instruction & Library (100.0%), Arts, Media & Entertainment (100.0%), and Community & Social Service (43.5%).
| Occupation | Male | Female |
| Management | 12 (100.0%) | 0 (0.0%) |
| Business & Financial | 0 (0.0%) | 0 (0.0%) |
| Computers, Engineering & Science | 5 (100.0%) | 0 (0.0%) |
| Computers & Mathematics | 0 (0.0%) | 0 (0.0%) |
| Architecture & Engineering | 5 (100.0%) | 0 (0.0%) |
| Life, Physical & Social Science | 0 (0.0%) | 0 (0.0%) |
| Community & Social Service | 13 (56.5%) | 10 (43.5%) |
| Education, Arts & Media | 0 (0.0%) | 0 (0.0%) |
| Legal Services & Support | 13 (76.5%) | 4 (23.5%) |
| Education Instruction & Library | 0 (0.0%) | 4 (100.0%) |
| Arts, Media & Entertainment | 0 (0.0%) | 2 (100.0%) |
| Health Diagnosing & Treating | 0 (0.0%) | 0 (0.0%) |
| Health Technologists | 0 (0.0%) | 0 (0.0%) |
| Total (Category) | 30 (75.0%) | 10 (25.0%) |
| Total (Overall) | 92 (67.6%) | 44 (32.4%) |
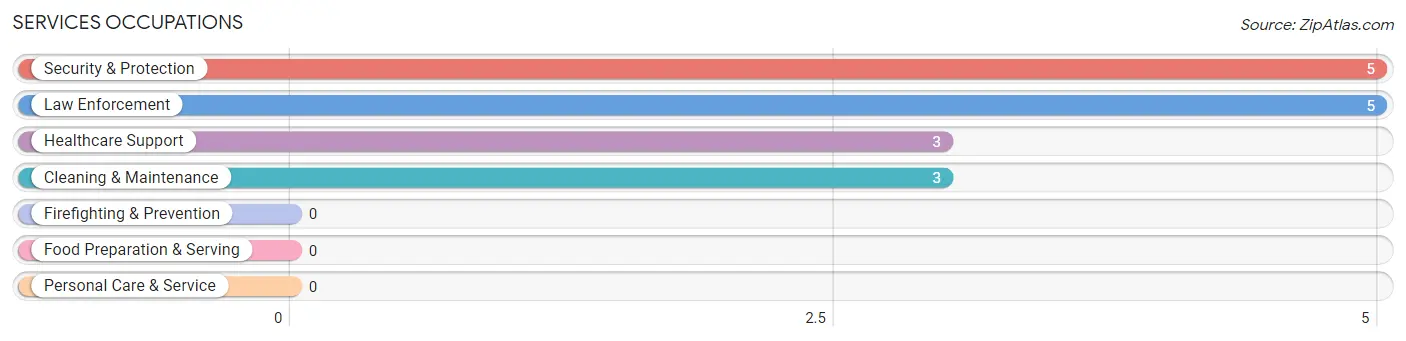
Services Occupations
The most common Services occupations in Bartow are Security & Protection (5 | 3.7%), Law Enforcement (5 | 3.7%), Healthcare Support (3 | 2.2%), and Cleaning & Maintenance (3 | 2.2%).
Services Occupations by Sex
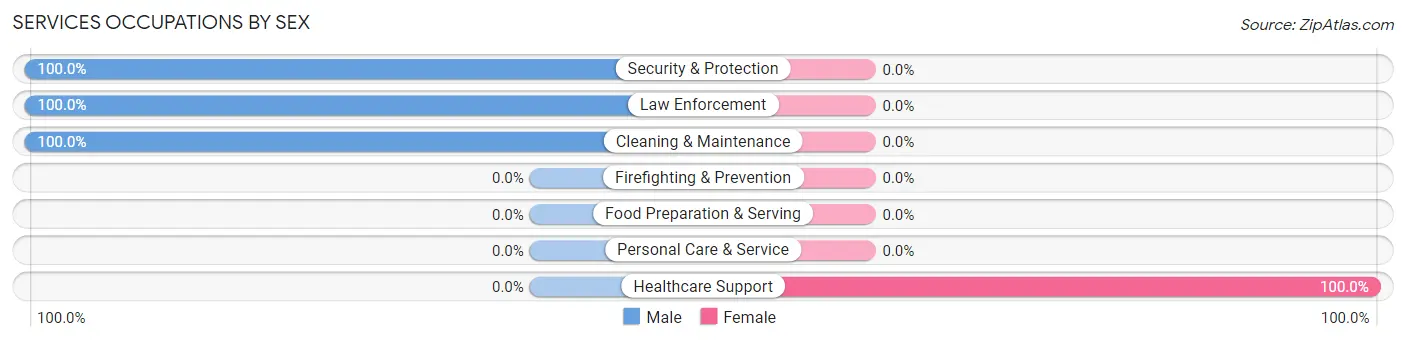
| Occupation | Male | Female |
| Healthcare Support | 0 (0.0%) | 3 (100.0%) |
| Security & Protection | 5 (100.0%) | 0 (0.0%) |
| Firefighting & Prevention | 0 (0.0%) | 0 (0.0%) |
| Law Enforcement | 5 (100.0%) | 0 (0.0%) |
| Food Preparation & Serving | 0 (0.0%) | 0 (0.0%) |
| Cleaning & Maintenance | 3 (100.0%) | 0 (0.0%) |
| Personal Care & Service | 0 (0.0%) | 0 (0.0%) |
| Total (Category) | 8 (72.7%) | 3 (27.3%) |
| Total (Overall) | 92 (67.6%) | 44 (32.4%) |
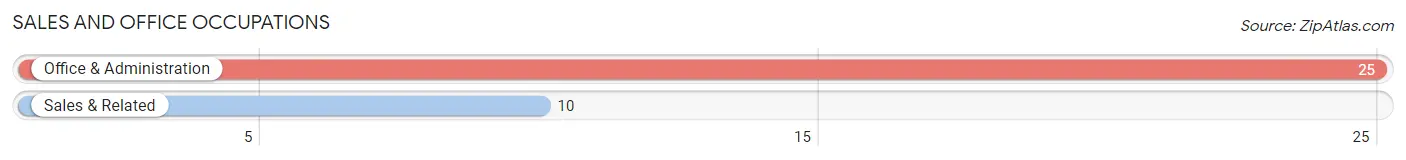
Sales and Office Occupations
The most common Sales and Office occupations in Bartow are Office & Administration (25 | 18.4%), and Sales & Related (10 | 7.3%).
Sales and Office Occupations by Sex
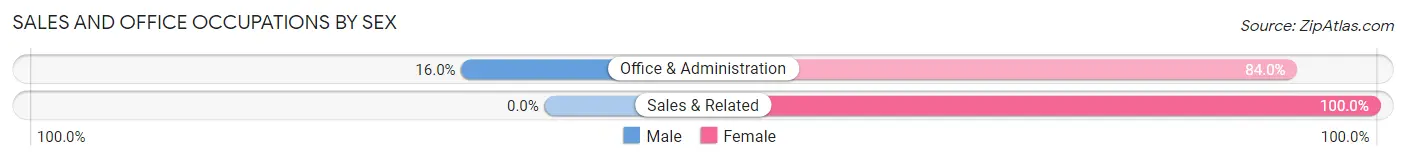
| Occupation | Male | Female |
| Sales & Related | 0 (0.0%) | 10 (100.0%) |
| Office & Administration | 4 (16.0%) | 21 (84.0%) |
| Total (Category) | 4 (11.4%) | 31 (88.6%) |
| Total (Overall) | 92 (67.6%) | 44 (32.4%) |
Natural Resources, Construction and Maintenance Occupations
The most common Natural Resources, Construction and Maintenance occupations in Bartow are , and Installation, Maintenance & Repair (5 | 3.7%).
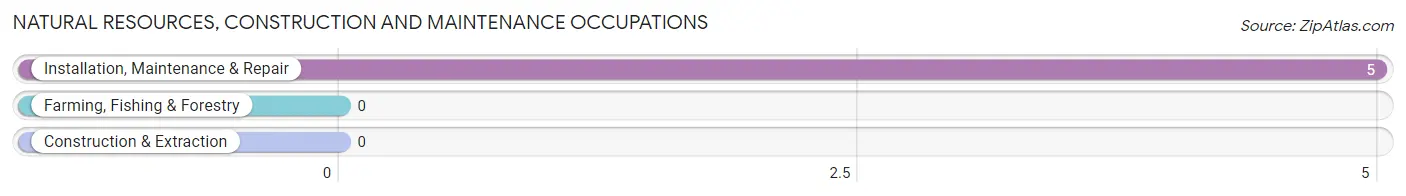
Natural Resources, Construction and Maintenance Occupations by Sex
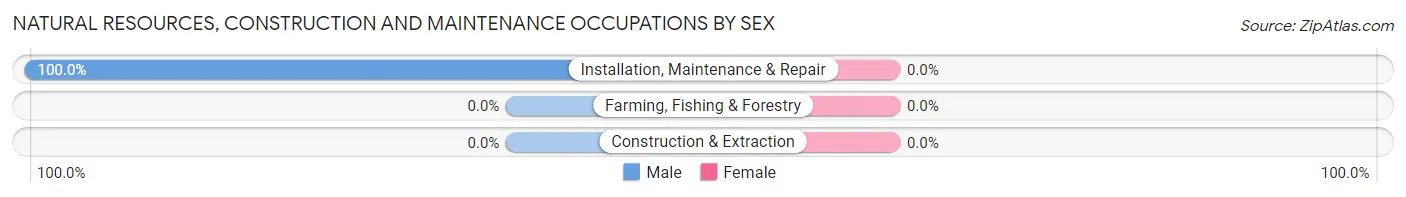
| Occupation | Male | Female |
| Farming, Fishing & Forestry | 0 (0.0%) | 0 (0.0%) |
| Construction & Extraction | 0 (0.0%) | 0 (0.0%) |
| Installation, Maintenance & Repair | 5 (100.0%) | 0 (0.0%) |
| Total (Category) | 5 (100.0%) | 0 (0.0%) |
| Total (Overall) | 92 (67.6%) | 44 (32.4%) |
Production, Transportation and Moving Occupations
The most common Production, Transportation and Moving occupations in Bartow are Material Moving (28 | 20.6%), Production (14 | 10.3%), and Transportation (3 | 2.2%).
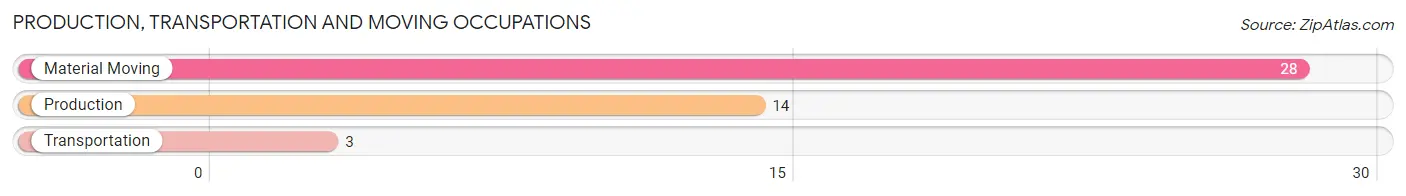
Production, Transportation and Moving Occupations by Sex
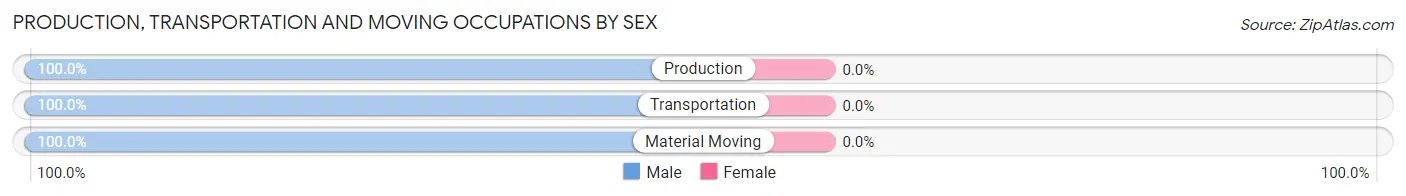
| Occupation | Male | Female |
| Production | 14 (100.0%) | 0 (0.0%) |
| Transportation | 3 (100.0%) | 0 (0.0%) |
| Material Moving | 28 (100.0%) | 0 (0.0%) |
| Total (Category) | 45 (100.0%) | 0 (0.0%) |
| Total (Overall) | 92 (67.6%) | 44 (32.4%) |
Employment Industries by Sex in Bartow
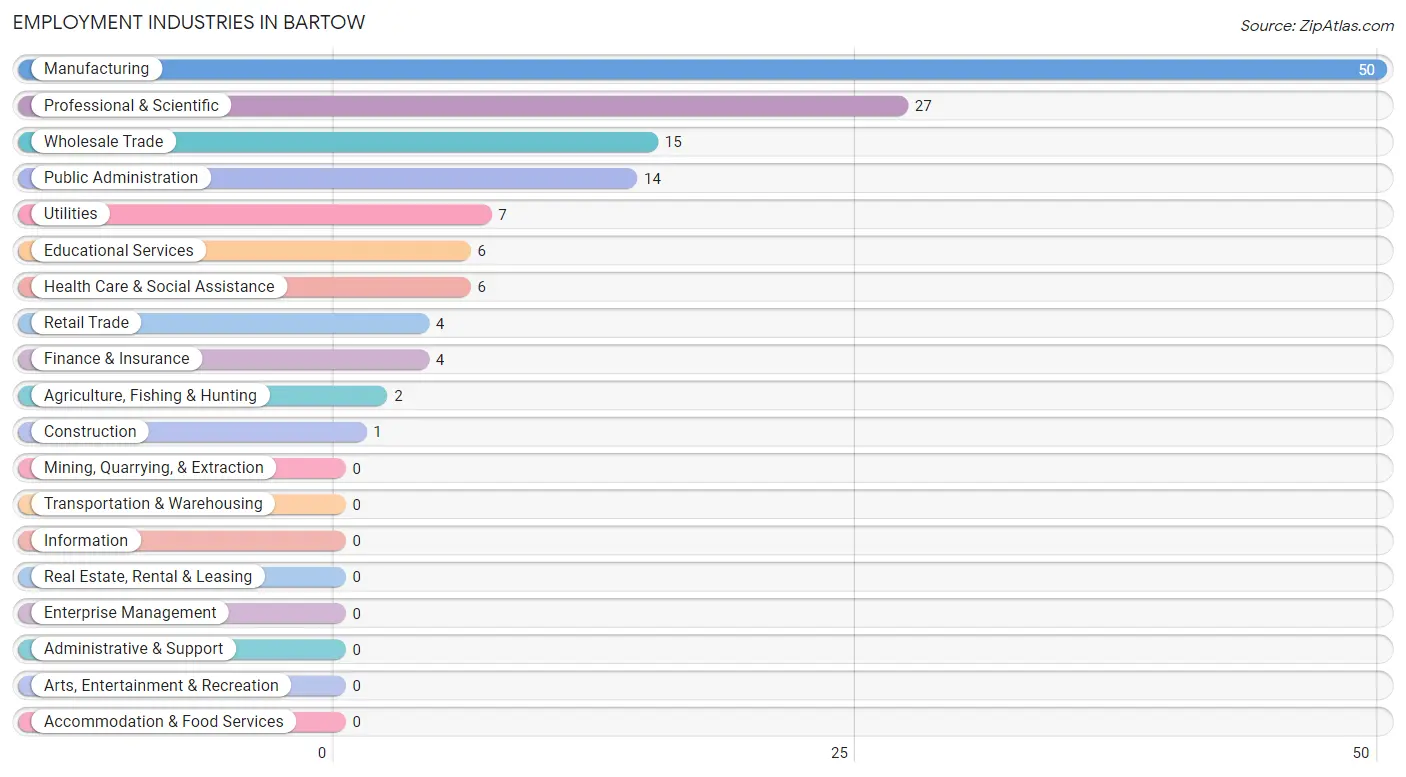
Employment Industries in Bartow
The major employment industries in Bartow include Manufacturing (50 | 36.8%), Professional & Scientific (27 | 19.9%), Wholesale Trade (15 | 11.0%), Public Administration (14 | 10.3%), and Utilities (7 | 5.1%).
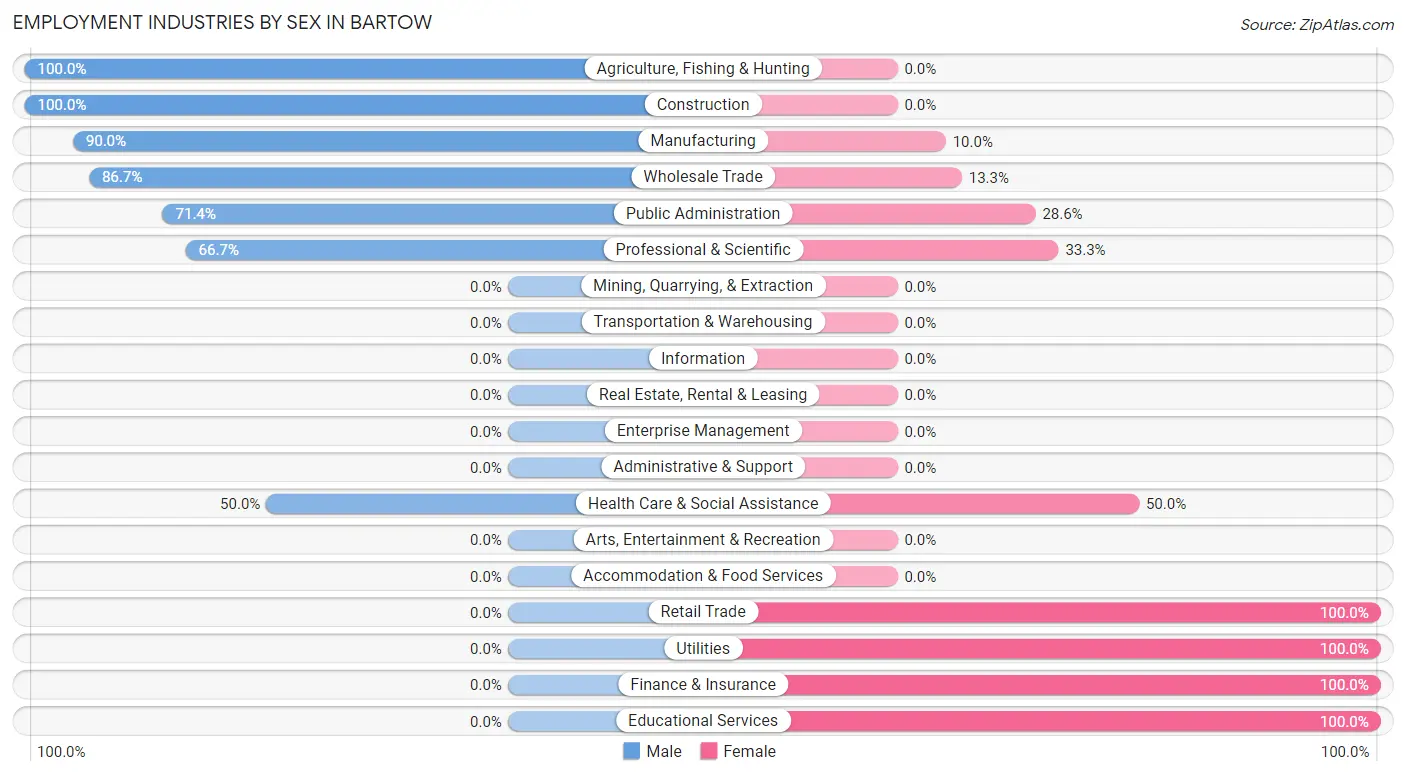
Employment Industries by Sex in Bartow
The Bartow industries that see more men than women are Agriculture, Fishing & Hunting (100.0%), Construction (100.0%), and Manufacturing (90.0%), whereas the industries that tend to have a higher number of women are Retail Trade (100.0%), Utilities (100.0%), and Finance & Insurance (100.0%).
| Industry | Male | Female |
| Agriculture, Fishing & Hunting | 2 (100.0%) | 0 (0.0%) |
| Mining, Quarrying, & Extraction | 0 (0.0%) | 0 (0.0%) |
| Construction | 1 (100.0%) | 0 (0.0%) |
| Manufacturing | 45 (90.0%) | 5 (10.0%) |
| Wholesale Trade | 13 (86.7%) | 2 (13.3%) |
| Retail Trade | 0 (0.0%) | 4 (100.0%) |
| Transportation & Warehousing | 0 (0.0%) | 0 (0.0%) |
| Utilities | 0 (0.0%) | 7 (100.0%) |
| Information | 0 (0.0%) | 0 (0.0%) |
| Finance & Insurance | 0 (0.0%) | 4 (100.0%) |
| Real Estate, Rental & Leasing | 0 (0.0%) | 0 (0.0%) |
| Professional & Scientific | 18 (66.7%) | 9 (33.3%) |
| Enterprise Management | 0 (0.0%) | 0 (0.0%) |
| Administrative & Support | 0 (0.0%) | 0 (0.0%) |
| Educational Services | 0 (0.0%) | 6 (100.0%) |
| Health Care & Social Assistance | 3 (50.0%) | 3 (50.0%) |
| Arts, Entertainment & Recreation | 0 (0.0%) | 0 (0.0%) |
| Accommodation & Food Services | 0 (0.0%) | 0 (0.0%) |
| Public Administration | 10 (71.4%) | 4 (28.6%) |
| Total | 92 (67.6%) | 44 (32.4%) |
Education in Bartow
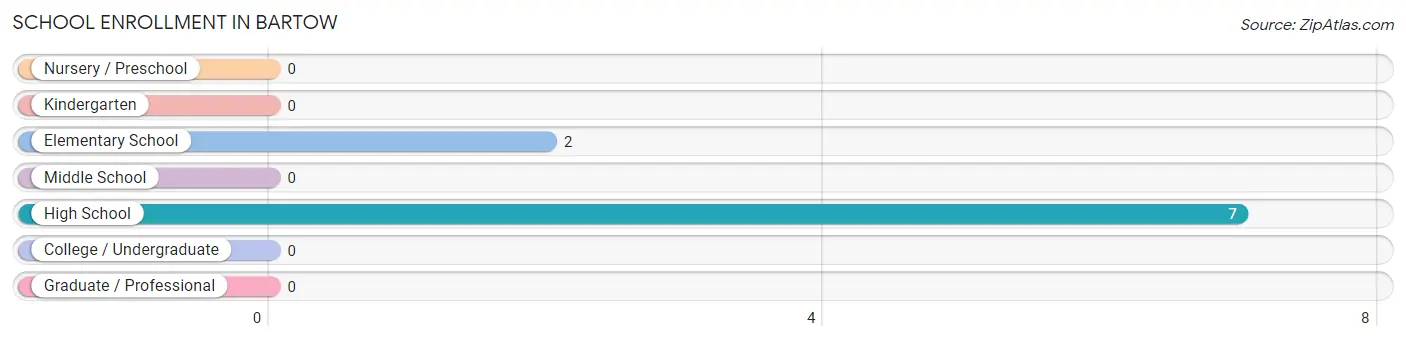
School Enrollment in Bartow
The most common levels of schooling among the 9 students in Bartow are high school (7 | 77.8%), and elementary school (2 | 22.2%).
| School Level | # Students | % Students |
| Nursery / Preschool | 0 | 0.0% |
| Kindergarten | 0 | 0.0% |
| Elementary School | 2 | 22.2% |
| Middle School | 0 | 0.0% |
| High School | 7 | 77.8% |
| College / Undergraduate | 0 | 0.0% |
| Graduate / Professional | 0 | 0.0% |
| Total | 9 | 100.0% |
School Enrollment by Age by Funding Source in Bartow
Out of a total of 9 students who are enrolled in schools in Bartow, 4 (44.4%) attend a private institution, while the remaining 5 (55.6%) are enrolled in public schools. The age group of 15 to 17 year olds has the highest likelihood of being enrolled in private schools, with 4 (66.7% in the age bracket) enrolled. Conversely, the age group of 5 to 9 year old has the lowest likelihood of being enrolled in a private school, with 2 (100.0% in the age bracket) attending a public institution.
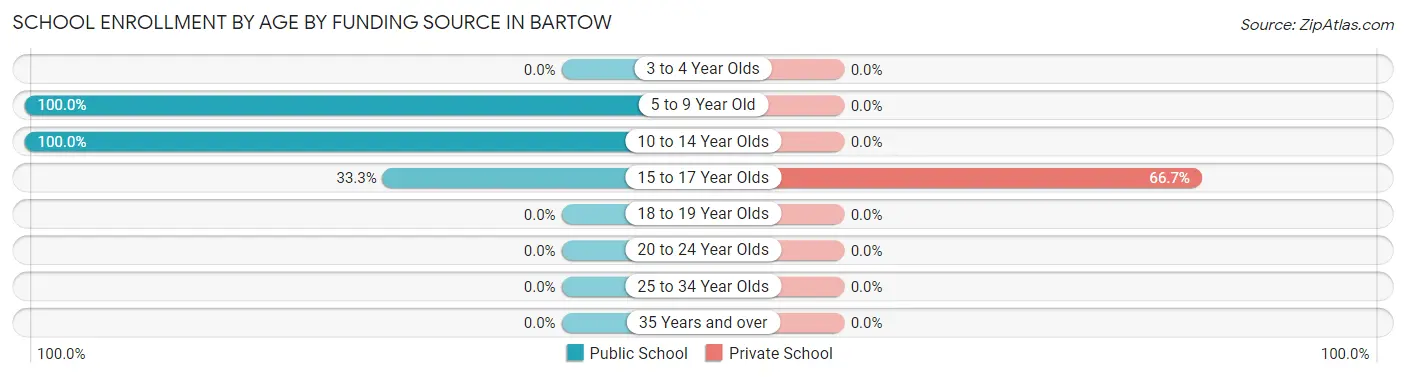
| Age Bracket | Public School | Private School |
| 3 to 4 Year Olds | 0 (0.0%) | 0 (0.0%) |
| 5 to 9 Year Old | 2 (100.0%) | 0 (0.0%) |
| 10 to 14 Year Olds | 1 (100.0%) | 0 (0.0%) |
| 15 to 17 Year Olds | 2 (33.3%) | 4 (66.7%) |
| 18 to 19 Year Olds | 0 (0.0%) | 0 (0.0%) |
| 20 to 24 Year Olds | 0 (0.0%) | 0 (0.0%) |
| 25 to 34 Year Olds | 0 (0.0%) | 0 (0.0%) |
| 35 Years and over | 0 (0.0%) | 0 (0.0%) |
| Total | 5 (55.6%) | 4 (44.4%) |
Educational Attainment by Field of Study in Bartow
Business (23 | 39.7%), bio, nature & agricultural (12 | 20.7%), science & technology (8 | 13.8%), education (7 | 12.1%), and arts & humanities (5 | 8.6%) are the most common fields of study among 58 individuals in Bartow who have obtained a bachelor's degree or higher.
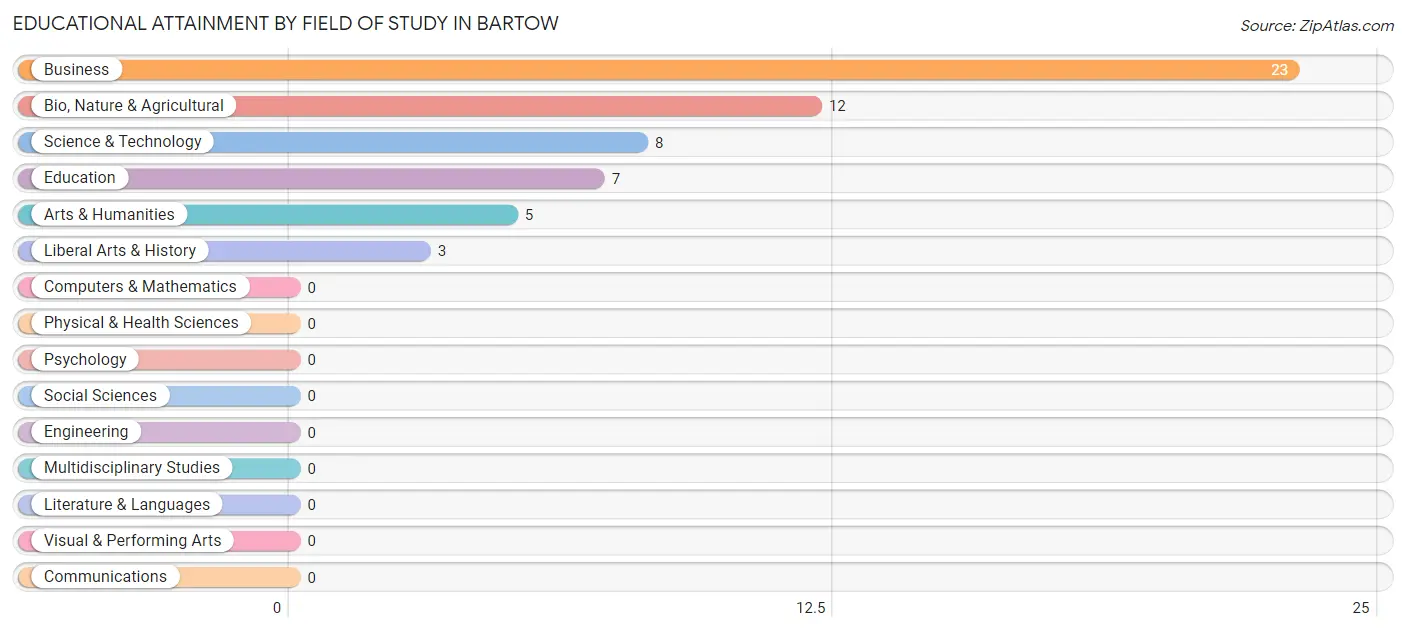
| Field of Study | # Graduates | % Graduates |
| Computers & Mathematics | 0 | 0.0% |
| Bio, Nature & Agricultural | 12 | 20.7% |
| Physical & Health Sciences | 0 | 0.0% |
| Psychology | 0 | 0.0% |
| Social Sciences | 0 | 0.0% |
| Engineering | 0 | 0.0% |
| Multidisciplinary Studies | 0 | 0.0% |
| Science & Technology | 8 | 13.8% |
| Business | 23 | 39.7% |
| Education | 7 | 12.1% |
| Literature & Languages | 0 | 0.0% |
| Liberal Arts & History | 3 | 5.2% |
| Visual & Performing Arts | 0 | 0.0% |
| Communications | 0 | 0.0% |
| Arts & Humanities | 5 | 8.6% |
| Total | 58 | 100.0% |
Transportation & Commute in Bartow
Vehicle Availability by Sex in Bartow
The most prevalent vehicle ownership categories in Bartow are males with no vehicle (28, accounting for 30.4%) and females with no vehicle (0, making up 63.6%).
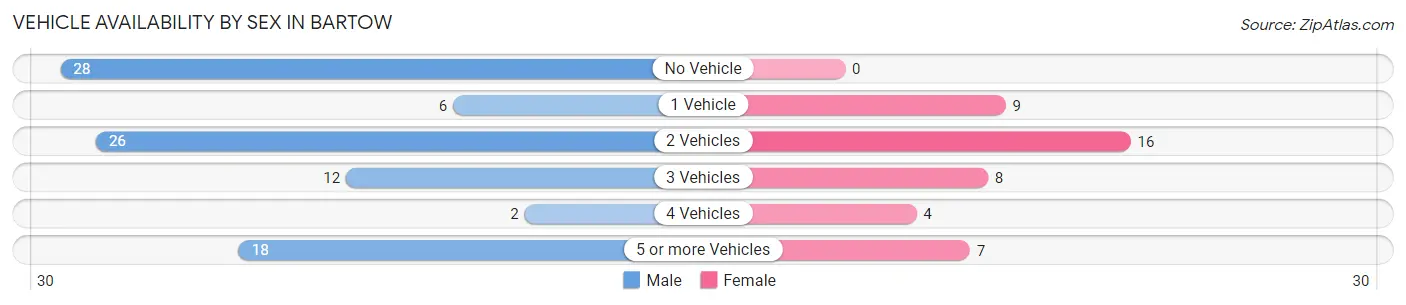
| Vehicles Available | Male | Female |
| No Vehicle | 28 (30.4%) | 0 (0.0%) |
| 1 Vehicle | 6 (6.5%) | 9 (20.4%) |
| 2 Vehicles | 26 (28.3%) | 16 (36.4%) |
| 3 Vehicles | 12 (13.0%) | 8 (18.2%) |
| 4 Vehicles | 2 (2.2%) | 4 (9.1%) |
| 5 or more Vehicles | 18 (19.6%) | 7 (15.9%) |
| Total | 92 (100.0%) | 44 (100.0%) |
Commute Time in Bartow
The most frequently occuring commute durations in Bartow are 10 to 14 minutes (46 commuters, 35.4%), 30 to 34 minutes (21 commuters, 16.2%), and 60 to 89 minutes (13 commuters, 10.0%).
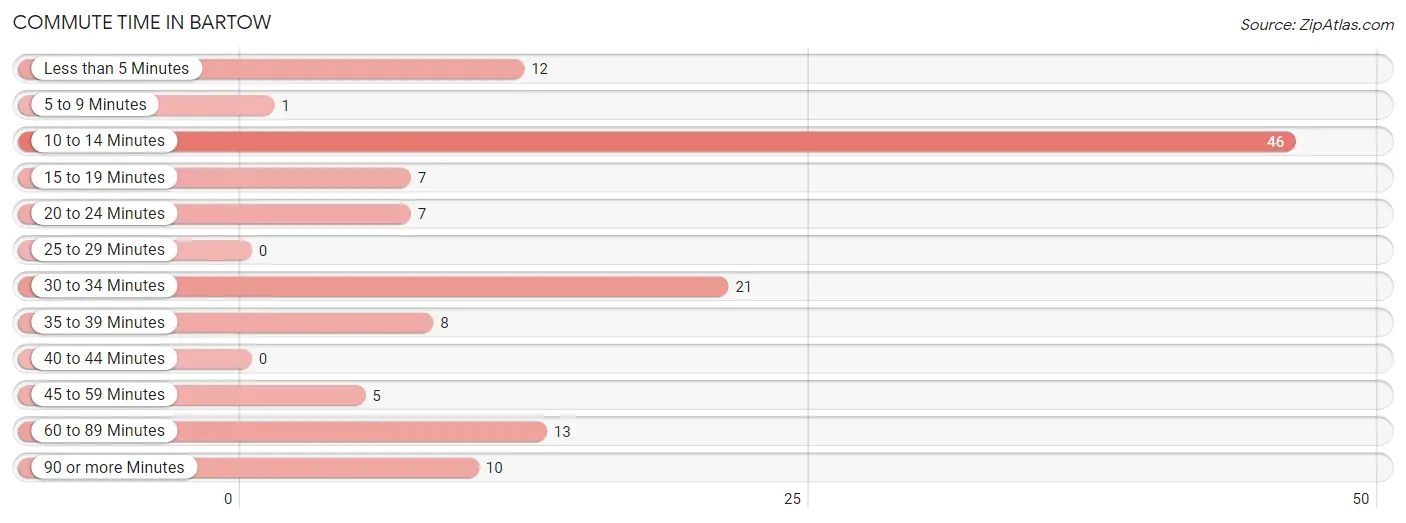
| Commute Time | # Commuters | % Commuters |
| Less than 5 Minutes | 12 | 9.2% |
| 5 to 9 Minutes | 1 | 0.8% |
| 10 to 14 Minutes | 46 | 35.4% |
| 15 to 19 Minutes | 7 | 5.4% |
| 20 to 24 Minutes | 7 | 5.4% |
| 25 to 29 Minutes | 0 | 0.0% |
| 30 to 34 Minutes | 21 | 16.2% |
| 35 to 39 Minutes | 8 | 6.1% |
| 40 to 44 Minutes | 0 | 0.0% |
| 45 to 59 Minutes | 5 | 3.8% |
| 60 to 89 Minutes | 13 | 10.0% |
| 90 or more Minutes | 10 | 7.7% |
Commute Time by Sex in Bartow
The most common commute times in Bartow are 10 to 14 minutes (40 commuters, 44.4%) for males and 30 to 34 minutes (12 commuters, 30.0%) for females.
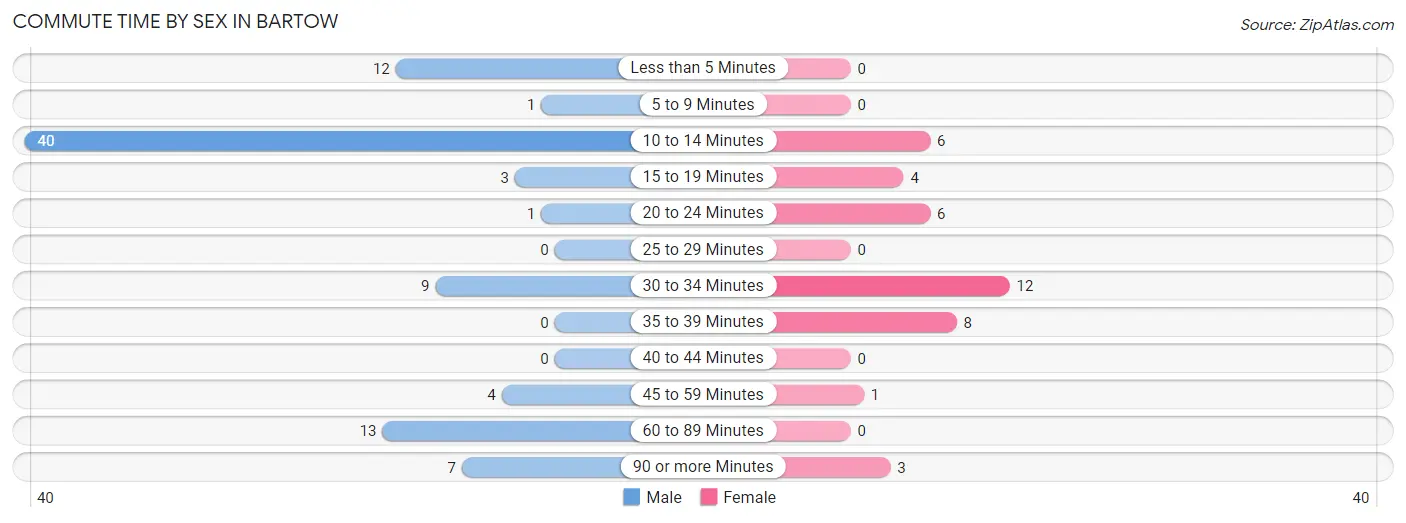
| Commute Time | Male | Female |
| Less than 5 Minutes | 12 (13.3%) | 0 (0.0%) |
| 5 to 9 Minutes | 1 (1.1%) | 0 (0.0%) |
| 10 to 14 Minutes | 40 (44.4%) | 6 (15.0%) |
| 15 to 19 Minutes | 3 (3.3%) | 4 (10.0%) |
| 20 to 24 Minutes | 1 (1.1%) | 6 (15.0%) |
| 25 to 29 Minutes | 0 (0.0%) | 0 (0.0%) |
| 30 to 34 Minutes | 9 (10.0%) | 12 (30.0%) |
| 35 to 39 Minutes | 0 (0.0%) | 8 (20.0%) |
| 40 to 44 Minutes | 0 (0.0%) | 0 (0.0%) |
| 45 to 59 Minutes | 4 (4.4%) | 1 (2.5%) |
| 60 to 89 Minutes | 13 (14.4%) | 0 (0.0%) |
| 90 or more Minutes | 7 (7.8%) | 3 (7.5%) |
Time of Departure to Work by Sex in Bartow
The most frequent times of departure to work in Bartow are 6:00 AM to 6:29 AM (28, 31.1%) for males and 12:00 PM to 3:59 PM (13, 32.5%) for females.
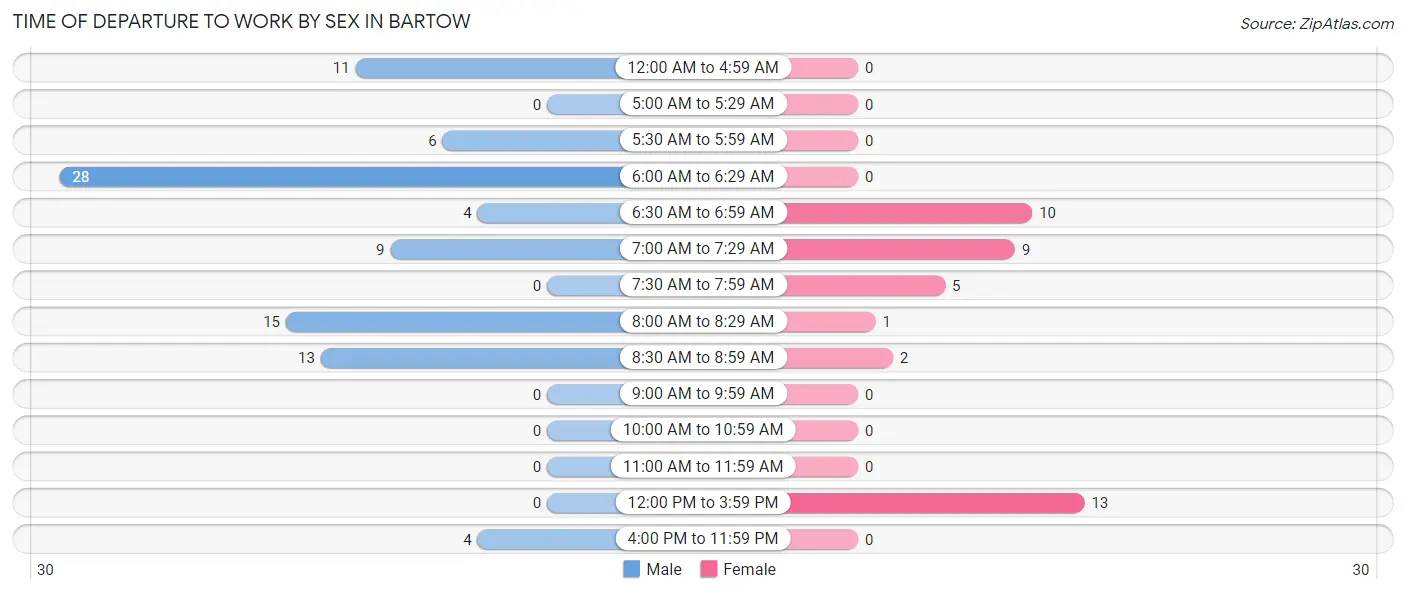
| Time of Departure | Male | Female |
| 12:00 AM to 4:59 AM | 11 (12.2%) | 0 (0.0%) |
| 5:00 AM to 5:29 AM | 0 (0.0%) | 0 (0.0%) |
| 5:30 AM to 5:59 AM | 6 (6.7%) | 0 (0.0%) |
| 6:00 AM to 6:29 AM | 28 (31.1%) | 0 (0.0%) |
| 6:30 AM to 6:59 AM | 4 (4.4%) | 10 (25.0%) |
| 7:00 AM to 7:29 AM | 9 (10.0%) | 9 (22.5%) |
| 7:30 AM to 7:59 AM | 0 (0.0%) | 5 (12.5%) |
| 8:00 AM to 8:29 AM | 15 (16.7%) | 1 (2.5%) |
| 8:30 AM to 8:59 AM | 13 (14.4%) | 2 (5.0%) |
| 9:00 AM to 9:59 AM | 0 (0.0%) | 0 (0.0%) |
| 10:00 AM to 10:59 AM | 0 (0.0%) | 0 (0.0%) |
| 11:00 AM to 11:59 AM | 0 (0.0%) | 0 (0.0%) |
| 12:00 PM to 3:59 PM | 0 (0.0%) | 13 (32.5%) |
| 4:00 PM to 11:59 PM | 4 (4.4%) | 0 (0.0%) |
| Total | 90 (100.0%) | 40 (100.0%) |
Housing Occupancy in Bartow
Occupancy by Ownership in Bartow
Of the total 140 dwellings in Bartow, owner-occupied units account for 118 (84.3%), while renter-occupied units make up 22 (15.7%).
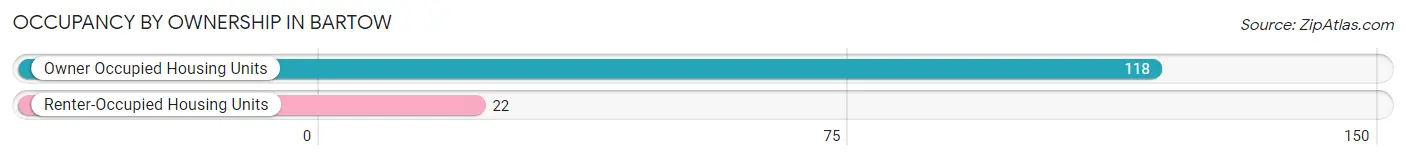
| Occupancy | # Housing Units | % Housing Units |
| Owner Occupied Housing Units | 118 | 84.3% |
| Renter-Occupied Housing Units | 22 | 15.7% |
| Total Occupied Housing Units | 140 | 100.0% |
Occupancy by Household Size in Bartow
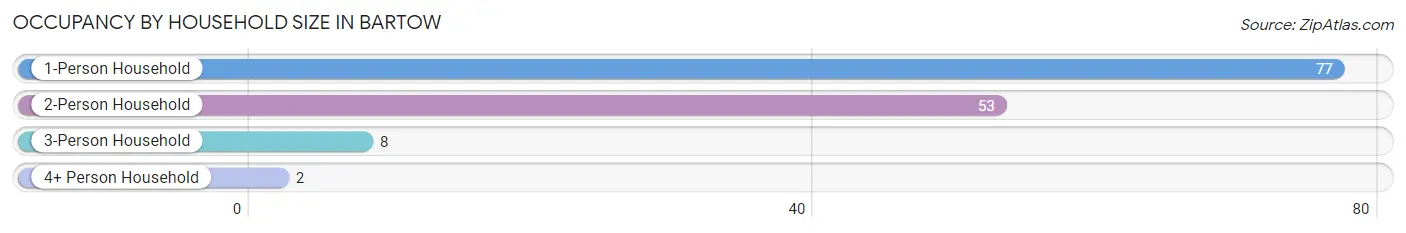
| Household Size | # Housing Units | % Housing Units |
| 1-Person Household | 77 | 55.0% |
| 2-Person Household | 53 | 37.9% |
| 3-Person Household | 8 | 5.7% |
| 4+ Person Household | 2 | 1.4% |
| Total Housing Units | 140 | 100.0% |
Occupancy by Ownership by Household Size in Bartow
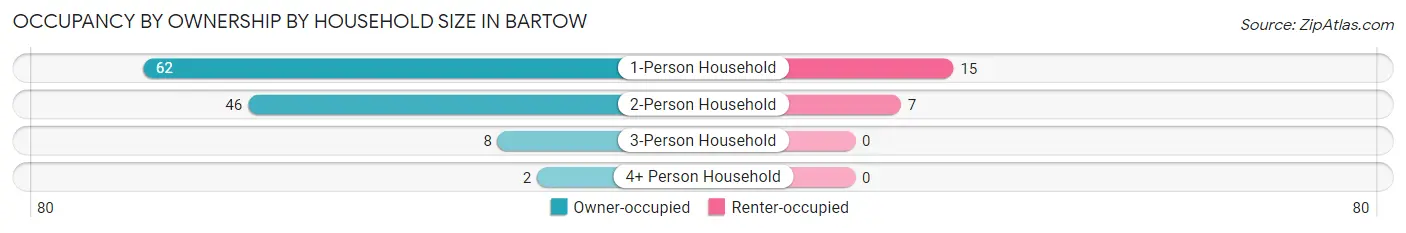
| Household Size | Owner-occupied | Renter-occupied |
| 1-Person Household | 62 (80.5%) | 15 (19.5%) |
| 2-Person Household | 46 (86.8%) | 7 (13.2%) |
| 3-Person Household | 8 (100.0%) | 0 (0.0%) |
| 4+ Person Household | 2 (100.0%) | 0 (0.0%) |
| Total Housing Units | 118 (84.3%) | 22 (15.7%) |
Occupancy by Educational Attainment in Bartow
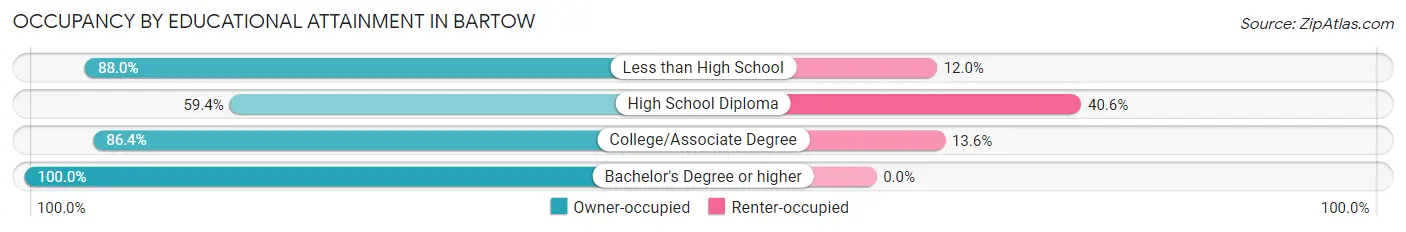
| Household Size | Owner-occupied | Renter-occupied |
| Less than High School | 44 (88.0%) | 6 (12.0%) |
| High School Diploma | 19 (59.4%) | 13 (40.6%) |
| College/Associate Degree | 19 (86.4%) | 3 (13.6%) |
| Bachelor's Degree or higher | 36 (100.0%) | 0 (0.0%) |
Occupancy by Age of Householder in Bartow
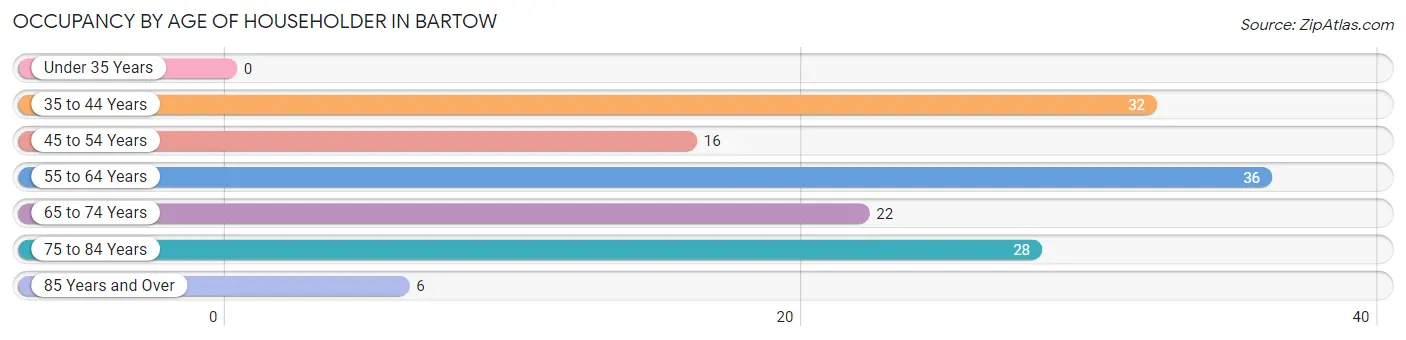
| Age Bracket | # Households | % Households |
| Under 35 Years | 0 | 0.0% |
| 35 to 44 Years | 32 | 22.9% |
| 45 to 54 Years | 16 | 11.4% |
| 55 to 64 Years | 36 | 25.7% |
| 65 to 74 Years | 22 | 15.7% |
| 75 to 84 Years | 28 | 20.0% |
| 85 Years and Over | 6 | 4.3% |
| Total | 140 | 100.0% |
Housing Finances in Bartow
Median Income by Occupancy in Bartow
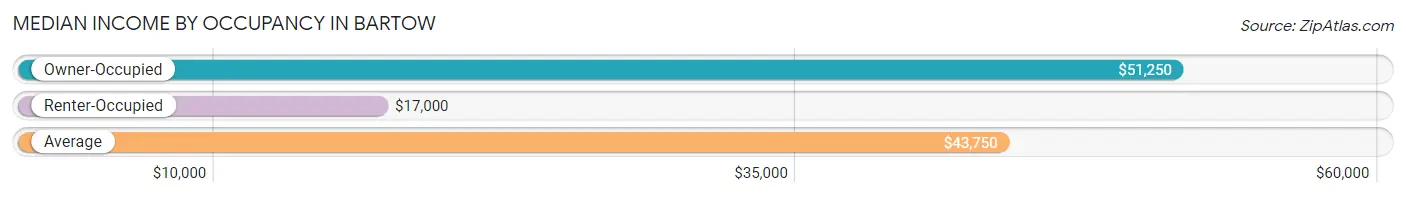
| Occupancy Type | # Households | Median Income |
| Owner-Occupied | 118 (84.3%) | $51,250 |
| Renter-Occupied | 22 (15.7%) | $17,000 |
| Average | 140 (100.0%) | $43,750 |
Occupancy by Householder Income Bracket in Bartow
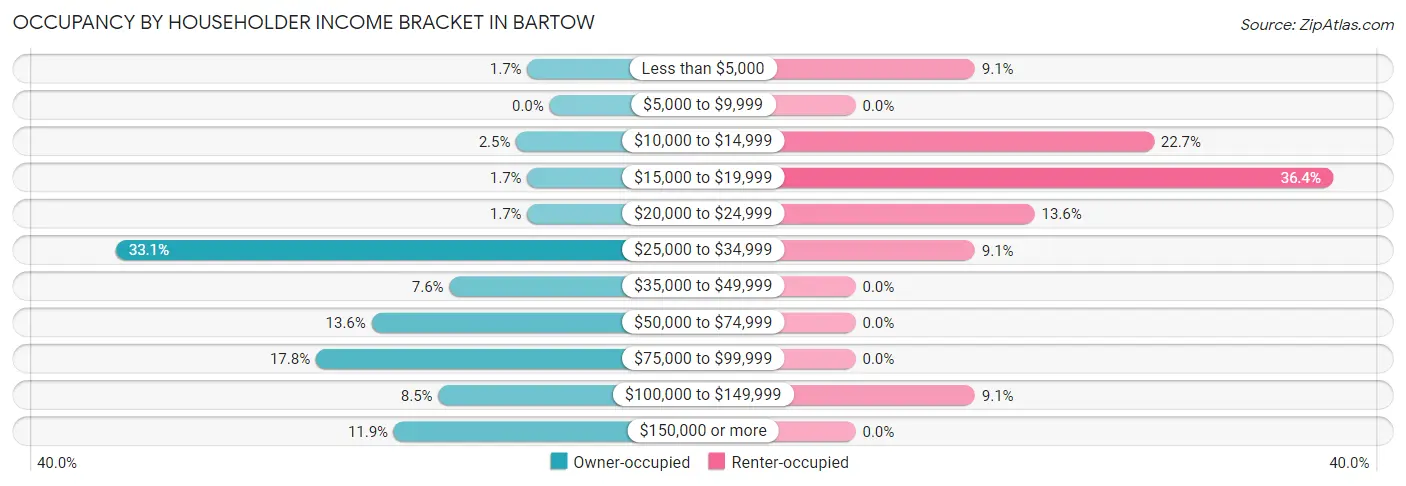
| Income Bracket | Owner-occupied | Renter-occupied |
| Less than $5,000 | 2 (1.7%) | 2 (9.1%) |
| $5,000 to $9,999 | 0 (0.0%) | 0 (0.0%) |
| $10,000 to $14,999 | 3 (2.5%) | 5 (22.7%) |
| $15,000 to $19,999 | 2 (1.7%) | 8 (36.4%) |
| $20,000 to $24,999 | 2 (1.7%) | 3 (13.6%) |
| $25,000 to $34,999 | 39 (33.1%) | 2 (9.1%) |
| $35,000 to $49,999 | 9 (7.6%) | 0 (0.0%) |
| $50,000 to $74,999 | 16 (13.6%) | 0 (0.0%) |
| $75,000 to $99,999 | 21 (17.8%) | 0 (0.0%) |
| $100,000 to $149,999 | 10 (8.5%) | 2 (9.1%) |
| $150,000 or more | 14 (11.9%) | 0 (0.0%) |
| Total | 118 (100.0%) | 22 (100.0%) |
Monthly Housing Cost Tiers in Bartow
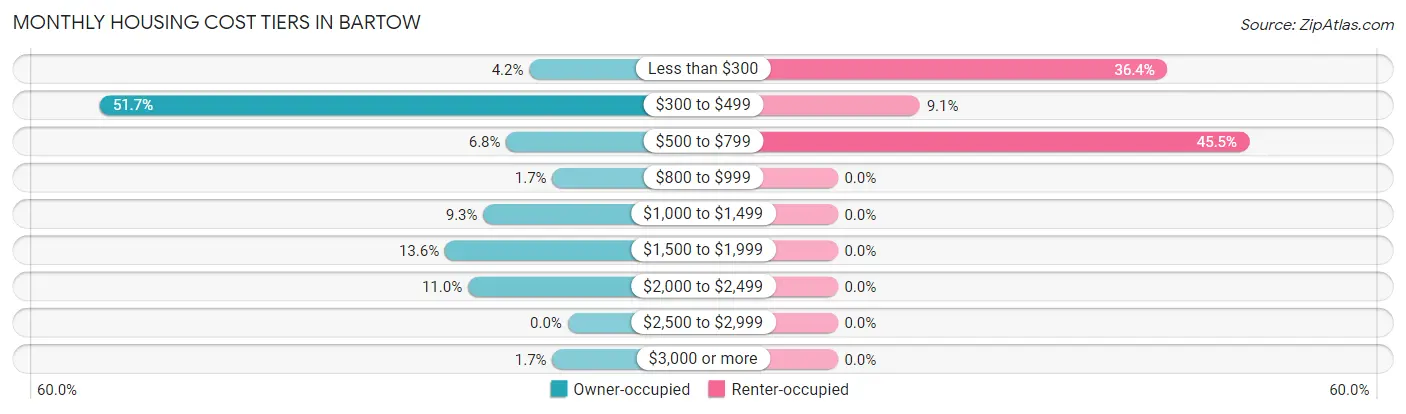
| Monthly Cost | Owner-occupied | Renter-occupied |
| Less than $300 | 5 (4.2%) | 8 (36.4%) |
| $300 to $499 | 61 (51.7%) | 2 (9.1%) |
| $500 to $799 | 8 (6.8%) | 10 (45.5%) |
| $800 to $999 | 2 (1.7%) | 0 (0.0%) |
| $1,000 to $1,499 | 11 (9.3%) | 0 (0.0%) |
| $1,500 to $1,999 | 16 (13.6%) | 0 (0.0%) |
| $2,000 to $2,499 | 13 (11.0%) | 0 (0.0%) |
| $2,500 to $2,999 | 0 (0.0%) | 0 (0.0%) |
| $3,000 or more | 2 (1.7%) | 0 (0.0%) |
| Total | 118 (100.0%) | 22 (100.0%) |
Physical Housing Characteristics in Bartow
Housing Structures in Bartow
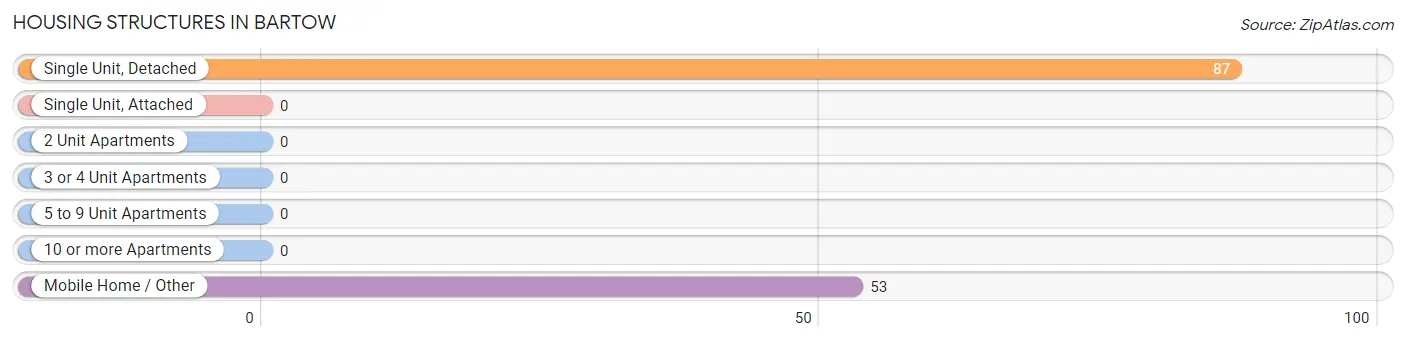
| Structure Type | # Housing Units | % Housing Units |
| Single Unit, Detached | 87 | 62.1% |
| Single Unit, Attached | 0 | 0.0% |
| 2 Unit Apartments | 0 | 0.0% |
| 3 or 4 Unit Apartments | 0 | 0.0% |
| 5 to 9 Unit Apartments | 0 | 0.0% |
| 10 or more Apartments | 0 | 0.0% |
| Mobile Home / Other | 53 | 37.9% |
| Total | 140 | 100.0% |
Housing Structures by Occupancy in Bartow
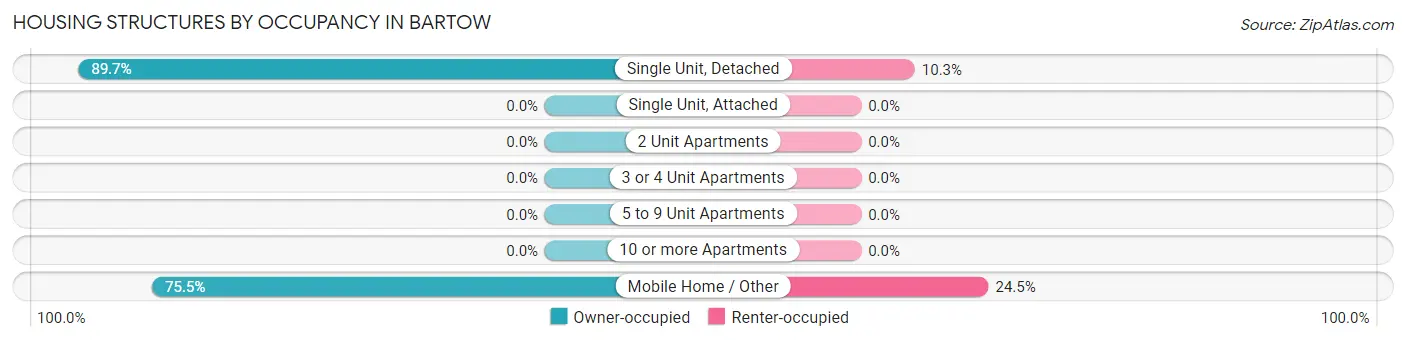
| Structure Type | Owner-occupied | Renter-occupied |
| Single Unit, Detached | 78 (89.7%) | 9 (10.3%) |
| Single Unit, Attached | 0 (0.0%) | 0 (0.0%) |
| 2 Unit Apartments | 0 (0.0%) | 0 (0.0%) |
| 3 or 4 Unit Apartments | 0 (0.0%) | 0 (0.0%) |
| 5 to 9 Unit Apartments | 0 (0.0%) | 0 (0.0%) |
| 10 or more Apartments | 0 (0.0%) | 0 (0.0%) |
| Mobile Home / Other | 40 (75.5%) | 13 (24.5%) |
| Total | 118 (84.3%) | 22 (15.7%) |
Housing Structures by Number of Rooms in Bartow
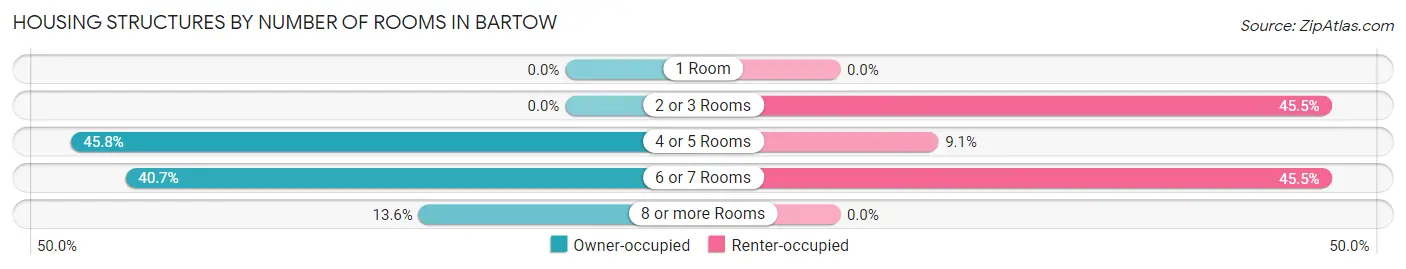
| Number of Rooms | Owner-occupied | Renter-occupied |
| 1 Room | 0 (0.0%) | 0 (0.0%) |
| 2 or 3 Rooms | 0 (0.0%) | 10 (45.5%) |
| 4 or 5 Rooms | 54 (45.8%) | 2 (9.1%) |
| 6 or 7 Rooms | 48 (40.7%) | 10 (45.5%) |
| 8 or more Rooms | 16 (13.6%) | 0 (0.0%) |
| Total | 118 (100.0%) | 22 (100.0%) |
Housing Structure by Heating Type in Bartow
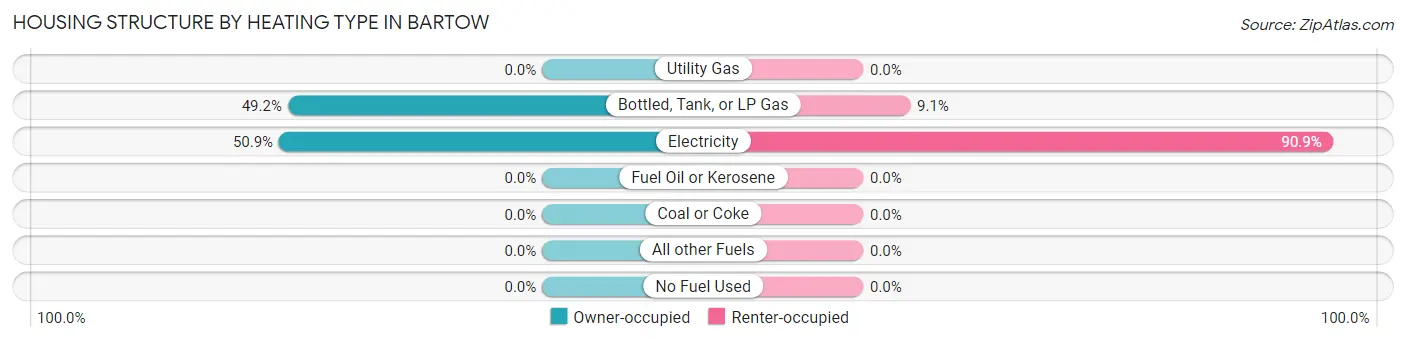
| Heating Type | Owner-occupied | Renter-occupied |
| Utility Gas | 0 (0.0%) | 0 (0.0%) |
| Bottled, Tank, or LP Gas | 58 (49.1%) | 2 (9.1%) |
| Electricity | 60 (50.8%) | 20 (90.9%) |
| Fuel Oil or Kerosene | 0 (0.0%) | 0 (0.0%) |
| Coal or Coke | 0 (0.0%) | 0 (0.0%) |
| All other Fuels | 0 (0.0%) | 0 (0.0%) |
| No Fuel Used | 0 (0.0%) | 0 (0.0%) |
| Total | 118 (100.0%) | 22 (100.0%) |
Household Vehicle Usage in Bartow
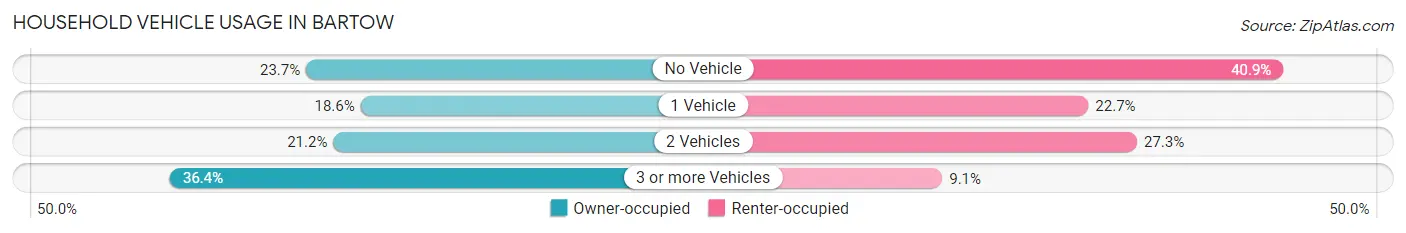
| Vehicles per Household | Owner-occupied | Renter-occupied |
| No Vehicle | 28 (23.7%) | 9 (40.9%) |
| 1 Vehicle | 22 (18.6%) | 5 (22.7%) |
| 2 Vehicles | 25 (21.2%) | 6 (27.3%) |
| 3 or more Vehicles | 43 (36.4%) | 2 (9.1%) |
| Total | 118 (100.0%) | 22 (100.0%) |
Real Estate & Mortgages in Bartow
Real Estate and Mortgage Overview in Bartow
| Characteristic | Without Mortgage | With Mortgage |
| Housing Units | 75 | 43 |
| Median Property Value | - | - |
| Median Household Income | $34,336 | $14 |
| Monthly Housing Costs | $443 | $2 |
| Real Estate Taxes | $318 | $2 |
Property Value by Mortgage Status in Bartow
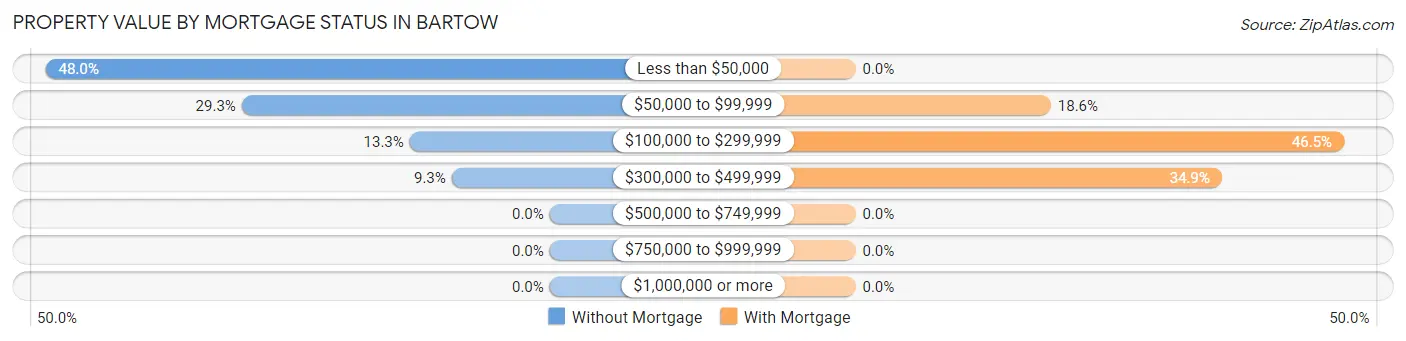
| Property Value | Without Mortgage | With Mortgage |
| Less than $50,000 | 36 (48.0%) | 0 (0.0%) |
| $50,000 to $99,999 | 22 (29.3%) | 8 (18.6%) |
| $100,000 to $299,999 | 10 (13.3%) | 20 (46.5%) |
| $300,000 to $499,999 | 7 (9.3%) | 15 (34.9%) |
| $500,000 to $749,999 | 0 (0.0%) | 0 (0.0%) |
| $750,000 to $999,999 | 0 (0.0%) | 0 (0.0%) |
| $1,000,000 or more | 0 (0.0%) | 0 (0.0%) |
| Total | 75 (100.0%) | 43 (100.0%) |
Household Income by Mortgage Status in Bartow
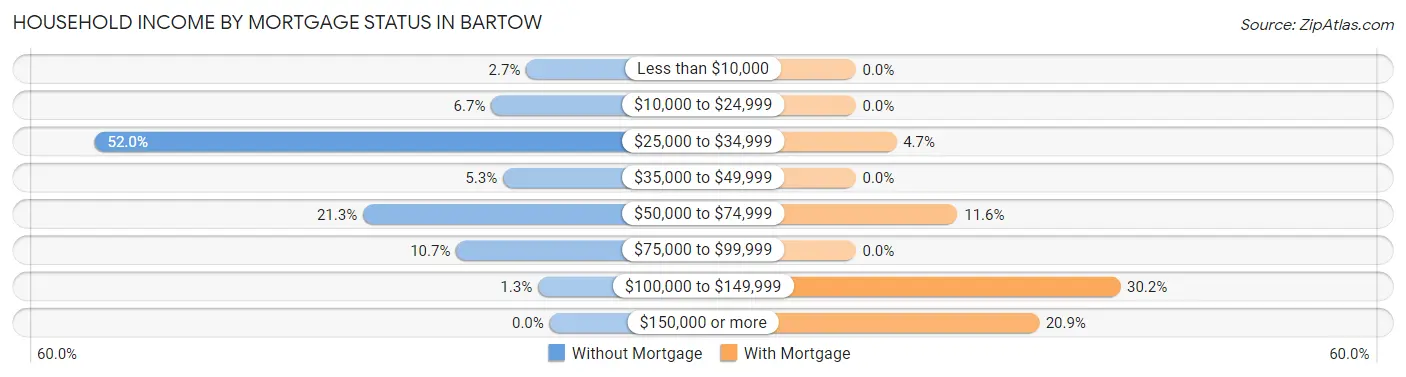
| Household Income | Without Mortgage | With Mortgage |
| Less than $10,000 | 2 (2.7%) | 0 (0.0%) |
| $10,000 to $24,999 | 5 (6.7%) | 0 (0.0%) |
| $25,000 to $34,999 | 39 (52.0%) | 2 (4.6%) |
| $35,000 to $49,999 | 4 (5.3%) | 0 (0.0%) |
| $50,000 to $74,999 | 16 (21.3%) | 5 (11.6%) |
| $75,000 to $99,999 | 8 (10.7%) | 0 (0.0%) |
| $100,000 to $149,999 | 1 (1.3%) | 13 (30.2%) |
| $150,000 or more | 0 (0.0%) | 9 (20.9%) |
| Total | 75 (100.0%) | 43 (100.0%) |
Property Value to Household Income Ratio in Bartow
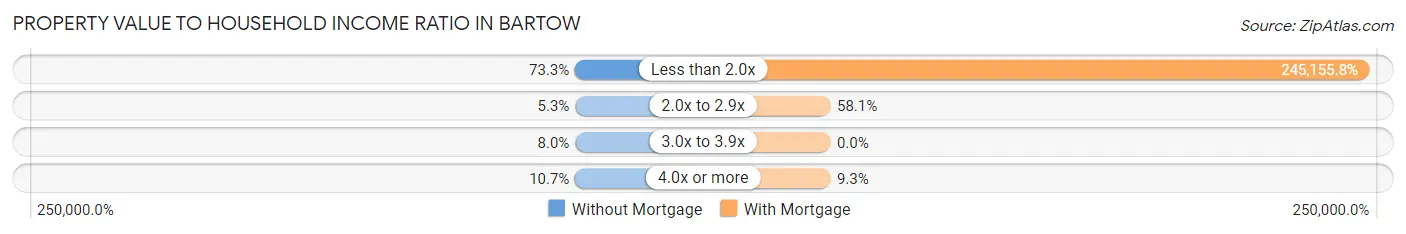
| Value-to-Income Ratio | Without Mortgage | With Mortgage |
| Less than 2.0x | 55 (73.3%) | 105,417 (245,155.8%) |
| 2.0x to 2.9x | 4 (5.3%) | 25 (58.1%) |
| 3.0x to 3.9x | 6 (8.0%) | 0 (0.0%) |
| 4.0x or more | 8 (10.7%) | 4 (9.3%) |
| Total | 75 (100.0%) | 43 (100.0%) |
Real Estate Taxes by Mortgage Status in Bartow
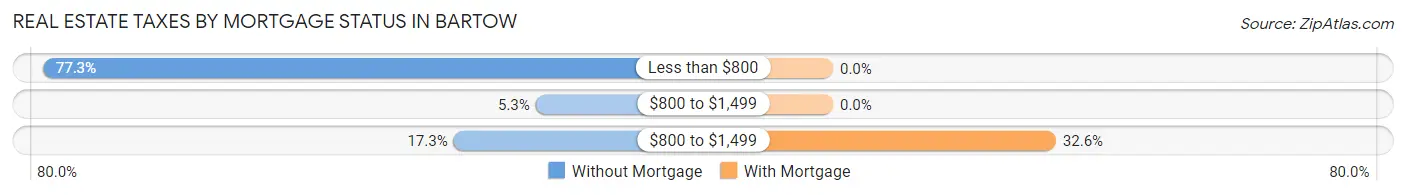
| Property Taxes | Without Mortgage | With Mortgage |
| Less than $800 | 58 (77.3%) | 0 (0.0%) |
| $800 to $1,499 | 4 (5.3%) | 0 (0.0%) |
| $800 to $1,499 | 13 (17.3%) | 14 (32.6%) |
| Total | 75 (100.0%) | 43 (100.0%) |
Health & Disability in Bartow
Health Insurance Coverage by Age in Bartow
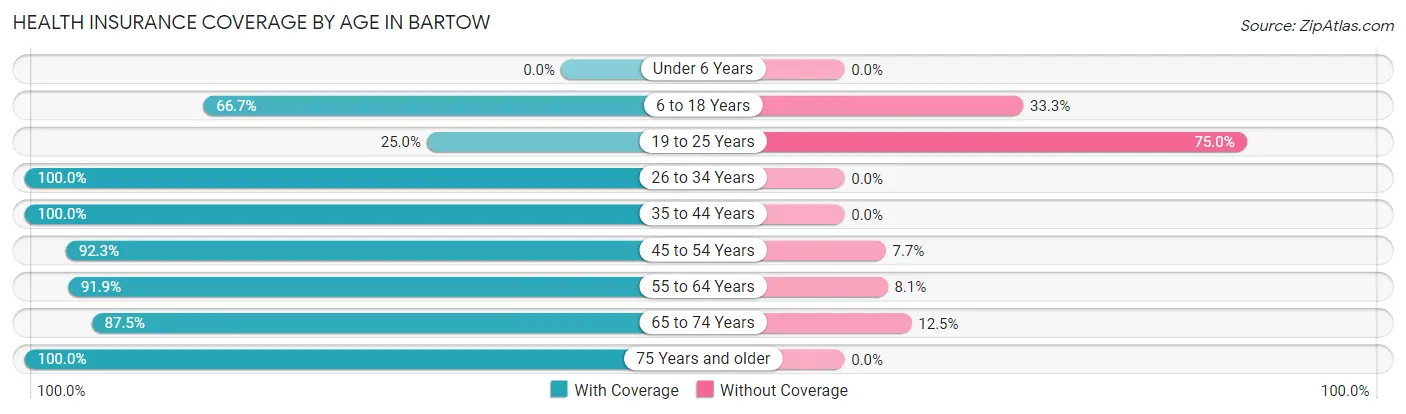
| Age Bracket | With Coverage | Without Coverage |
| Under 6 Years | 0 (0.0%) | 0 (0.0%) |
| 6 to 18 Years | 6 (66.7%) | 3 (33.3%) |
| 19 to 25 Years | 1 (25.0%) | 3 (75.0%) |
| 26 to 34 Years | 4 (100.0%) | 0 (0.0%) |
| 35 to 44 Years | 37 (100.0%) | 0 (0.0%) |
| 45 to 54 Years | 24 (92.3%) | 2 (7.7%) |
| 55 to 64 Years | 57 (91.9%) | 5 (8.1%) |
| 65 to 74 Years | 35 (87.5%) | 5 (12.5%) |
| 75 Years and older | 37 (100.0%) | 0 (0.0%) |
| Total | 201 (91.8%) | 18 (8.2%) |
Health Insurance Coverage by Citizenship Status in Bartow
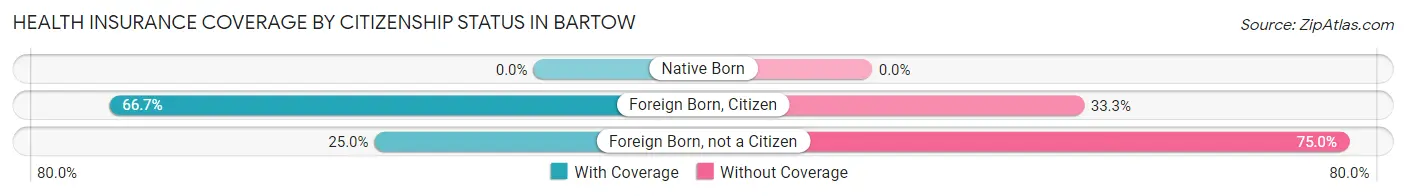
| Citizenship Status | With Coverage | Without Coverage |
| Native Born | 0 (0.0%) | 0 (0.0%) |
| Foreign Born, Citizen | 6 (66.7%) | 3 (33.3%) |
| Foreign Born, not a Citizen | 1 (25.0%) | 3 (75.0%) |
Health Insurance Coverage by Household Income in Bartow
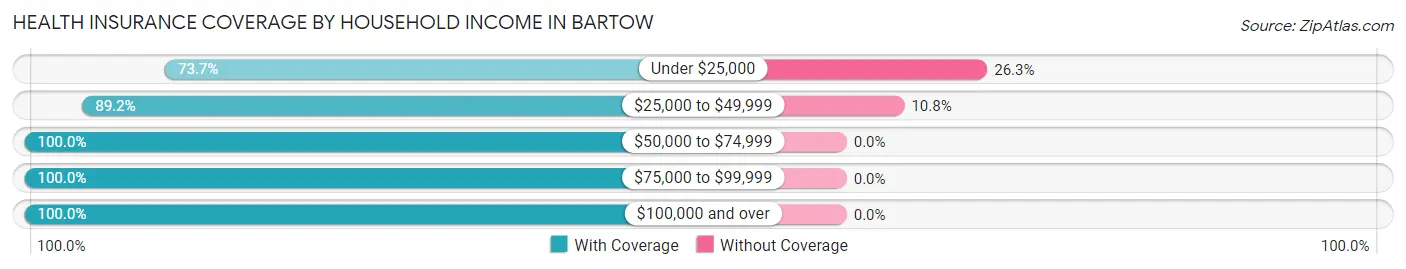
| Household Income | With Coverage | Without Coverage |
| Under $25,000 | 28 (73.7%) | 10 (26.3%) |
| $25,000 to $49,999 | 66 (89.2%) | 8 (10.8%) |
| $50,000 to $74,999 | 23 (100.0%) | 0 (0.0%) |
| $75,000 to $99,999 | 24 (100.0%) | 0 (0.0%) |
| $100,000 and over | 60 (100.0%) | 0 (0.0%) |
Public vs Private Health Insurance Coverage by Age in Bartow
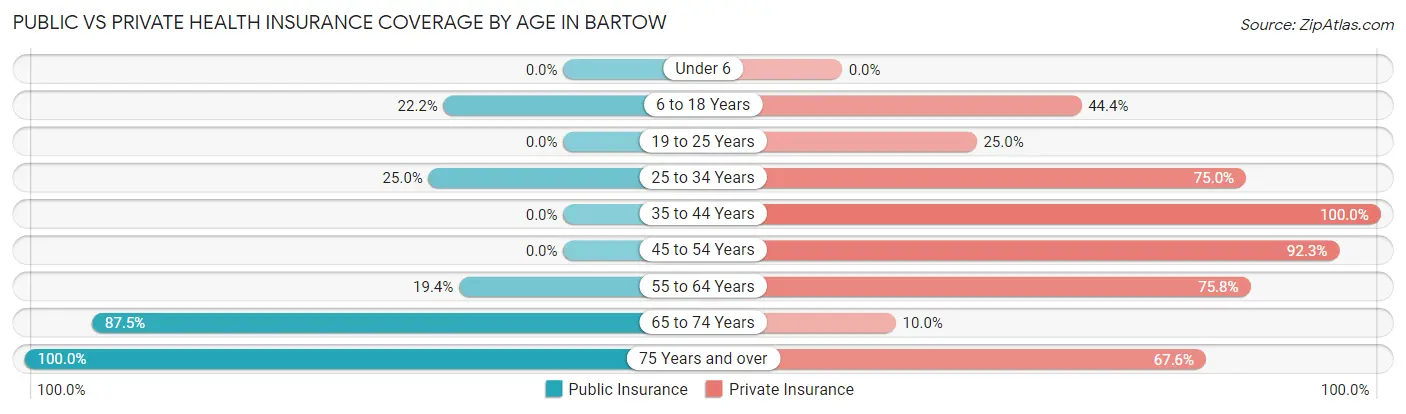
| Age Bracket | Public Insurance | Private Insurance |
| Under 6 | 0 (0.0%) | 0 (0.0%) |
| 6 to 18 Years | 2 (22.2%) | 4 (44.4%) |
| 19 to 25 Years | 0 (0.0%) | 1 (25.0%) |
| 25 to 34 Years | 1 (25.0%) | 3 (75.0%) |
| 35 to 44 Years | 0 (0.0%) | 37 (100.0%) |
| 45 to 54 Years | 0 (0.0%) | 24 (92.3%) |
| 55 to 64 Years | 12 (19.4%) | 47 (75.8%) |
| 65 to 74 Years | 35 (87.5%) | 4 (10.0%) |
| 75 Years and over | 37 (100.0%) | 25 (67.6%) |
| Total | 87 (39.7%) | 145 (66.2%) |
Disability Status by Sex by Age in Bartow
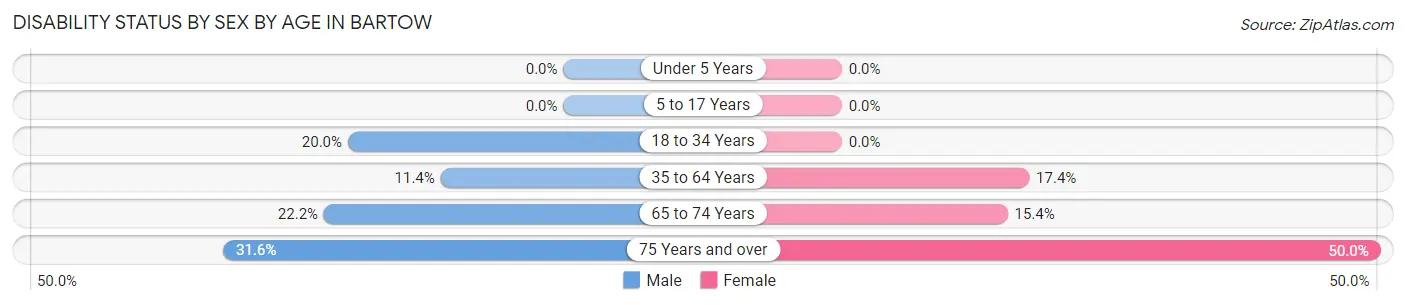
| Age Bracket | Male | Female |
| Under 5 Years | 0 (0.0%) | 0 (0.0%) |
| 5 to 17 Years | 0 (0.0%) | 0 (0.0%) |
| 18 to 34 Years | 1 (20.0%) | 0 (0.0%) |
| 35 to 64 Years | 9 (11.4%) | 8 (17.4%) |
| 65 to 74 Years | 6 (22.2%) | 2 (15.4%) |
| 75 Years and over | 6 (31.6%) | 9 (50.0%) |
Disability Class by Sex by Age in Bartow
Disability Class: Hearing Difficulty
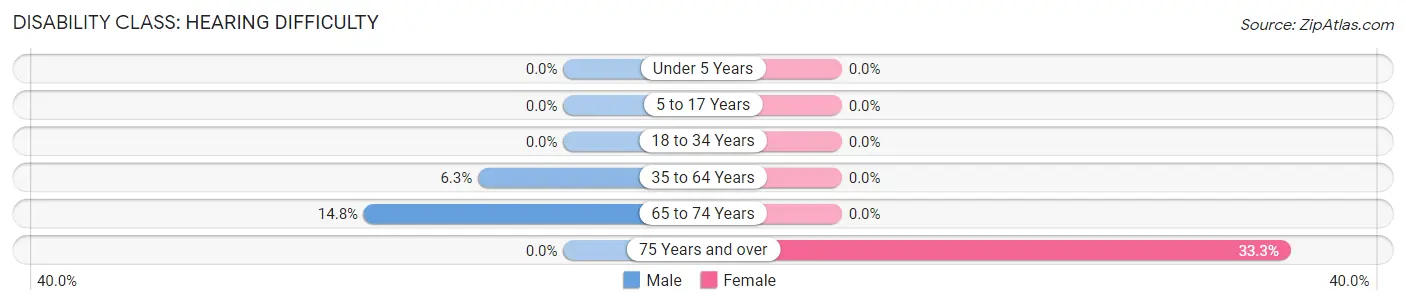
| Age Bracket | Male | Female |
| Under 5 Years | 0 (0.0%) | 0 (0.0%) |
| 5 to 17 Years | 0 (0.0%) | 0 (0.0%) |
| 18 to 34 Years | 0 (0.0%) | 0 (0.0%) |
| 35 to 64 Years | 5 (6.3%) | 0 (0.0%) |
| 65 to 74 Years | 4 (14.8%) | 0 (0.0%) |
| 75 Years and over | 0 (0.0%) | 6 (33.3%) |
Disability Class: Vision Difficulty
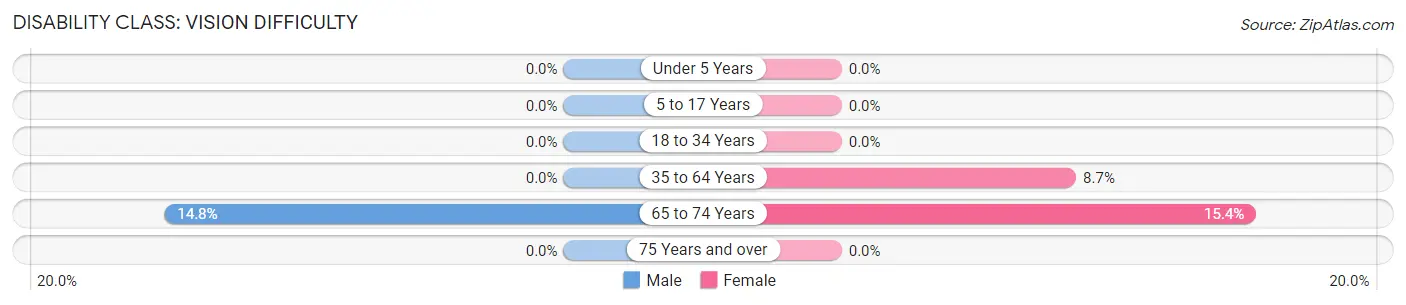
| Age Bracket | Male | Female |
| Under 5 Years | 0 (0.0%) | 0 (0.0%) |
| 5 to 17 Years | 0 (0.0%) | 0 (0.0%) |
| 18 to 34 Years | 0 (0.0%) | 0 (0.0%) |
| 35 to 64 Years | 0 (0.0%) | 4 (8.7%) |
| 65 to 74 Years | 4 (14.8%) | 2 (15.4%) |
| 75 Years and over | 0 (0.0%) | 0 (0.0%) |
Disability Class: Cognitive Difficulty
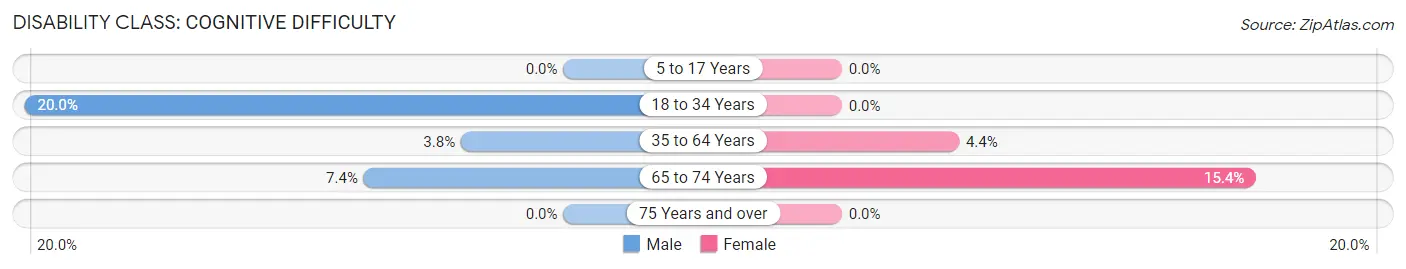
| Age Bracket | Male | Female |
| 5 to 17 Years | 0 (0.0%) | 0 (0.0%) |
| 18 to 34 Years | 1 (20.0%) | 0 (0.0%) |
| 35 to 64 Years | 3 (3.8%) | 2 (4.3%) |
| 65 to 74 Years | 2 (7.4%) | 2 (15.4%) |
| 75 Years and over | 0 (0.0%) | 0 (0.0%) |
Disability Class: Ambulatory Difficulty
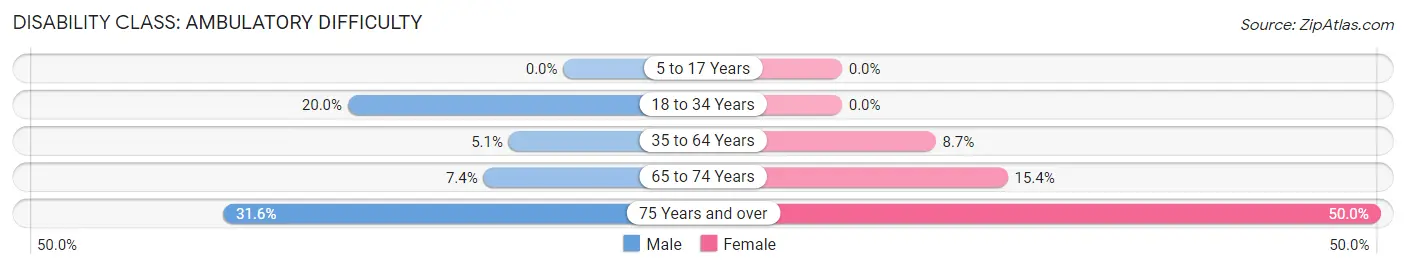
| Age Bracket | Male | Female |
| 5 to 17 Years | 0 (0.0%) | 0 (0.0%) |
| 18 to 34 Years | 1 (20.0%) | 0 (0.0%) |
| 35 to 64 Years | 4 (5.1%) | 4 (8.7%) |
| 65 to 74 Years | 2 (7.4%) | 2 (15.4%) |
| 75 Years and over | 6 (31.6%) | 9 (50.0%) |
Disability Class: Self-Care Difficulty
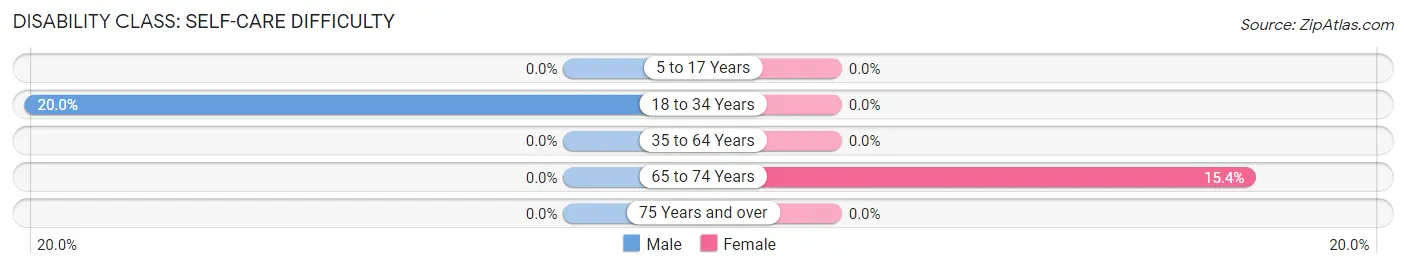
| Age Bracket | Male | Female |
| 5 to 17 Years | 0 (0.0%) | 0 (0.0%) |
| 18 to 34 Years | 1 (20.0%) | 0 (0.0%) |
| 35 to 64 Years | 0 (0.0%) | 0 (0.0%) |
| 65 to 74 Years | 0 (0.0%) | 2 (15.4%) |
| 75 Years and over | 0 (0.0%) | 0 (0.0%) |
Technology Access in Bartow
Computing Device Access in Bartow
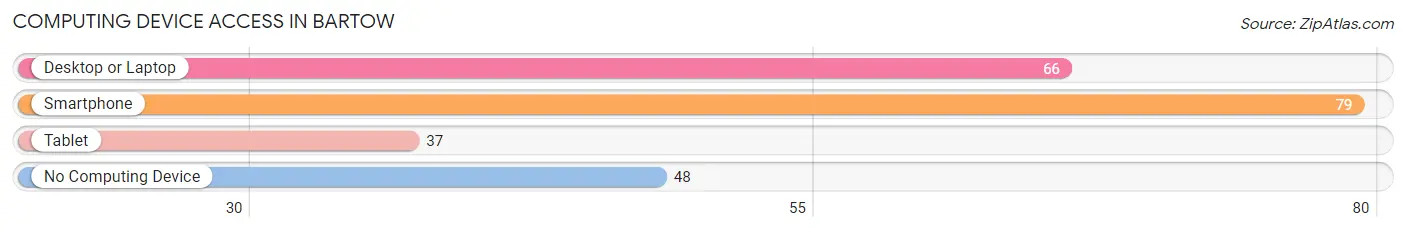
| Device Type | # Households | % Households |
| Desktop or Laptop | 66 | 47.1% |
| Smartphone | 79 | 56.4% |
| Tablet | 37 | 26.4% |
| No Computing Device | 48 | 34.3% |
| Total | 140 | 100.0% |
Internet Access in Bartow
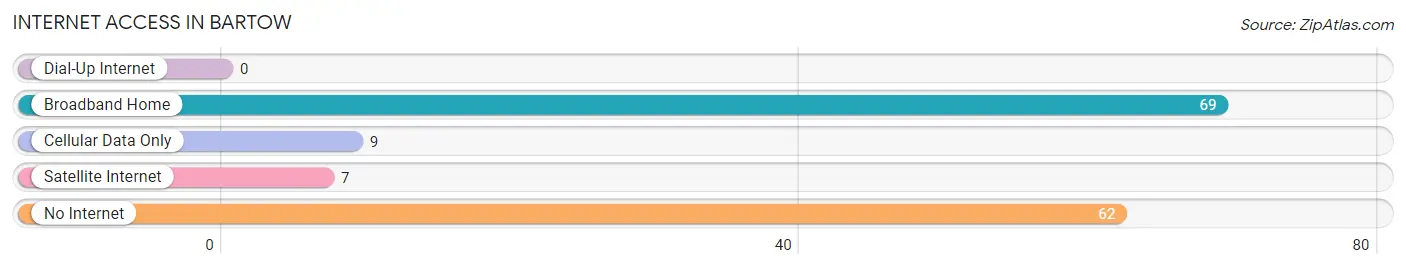
| Internet Type | # Households | % Households |
| Dial-Up Internet | 0 | 0.0% |
| Broadband Home | 69 | 49.3% |
| Cellular Data Only | 9 | 6.4% |
| Satellite Internet | 7 | 5.0% |
| No Internet | 62 | 44.3% |
| Total | 140 | 100.0% |
Bartow Summary
Bartow is a city located in the northwest corner of Georgia, United States. It is the county seat of Bartow County and is part of the Cartersville-Bartow Metropolitan Statistical Area. The city was founded in 1854 and has a population of approximately 13,000 people.
Geography
Bartow is located in the foothills of the Appalachian Mountains, approximately 50 miles northwest of Atlanta. The city is situated on the Etowah River, which flows through the city and is a major source of recreation for the area. The city is surrounded by rolling hills and forests, making it a popular destination for outdoor activities such as hiking, camping, and fishing.
Climate
Bartow has a humid subtropical climate, with hot, humid summers and mild winters. The average annual temperature is around 64°F (18°C). The average annual precipitation is around 50 inches (127 cm).
Demographics
As of the 2010 census, the population of Bartow was 13,068. The racial makeup of the city was 79.3% White, 15.2% African American, 0.4% Native American, 0.7% Asian, 0.1% Pacific Islander, 2.3% from other races, and 2.1% from two or more races. Hispanic or Latino of any race were 4.7% of the population.
Economy
Bartow is home to several major industries, including manufacturing, healthcare, and retail. The city is also home to several large employers, including Shaw Industries, Cartersville Medical Center, and Walmart. The city is also home to several small businesses, including restaurants, shops, and services.
The city is served by the Bartow County Airport, which provides air service to the surrounding area. The city is also served by several major highways, including Interstate 75, US Highway 411, and Georgia State Route 140.
History
Bartow was founded in 1854 and was named after Francis S. Bartow, a Confederate general who was killed in the Battle of Manassas. The city was originally a small farming community, but it grew rapidly after the arrival of the railroad in the late 19th century. The city was incorporated in 1871 and has since grown to become the county seat of Bartow County.
In the early 20th century, the city was a major center for the textile industry. The city was also home to several large manufacturing plants, including a cotton mill and a paper mill. The city was also home to several large retail stores, including a Sears and a J.C. Penney.
In the late 20th century, the city began to diversify its economy, with the arrival of several new industries, including healthcare and retail. The city has also become a popular destination for outdoor activities, such as hiking, camping, and fishing.
Today, Bartow is a vibrant city with a diverse economy and a strong sense of community. The city is home to several large employers, including Shaw Industries, Cartersville Medical Center, and Walmart. The city is also home to several small businesses, including restaurants, shops, and services. The city is served by the Bartow County Airport, which provides air service to the surrounding area. The city is also served by several major highways, including Interstate 75, US Highway 411, and Georgia State Route 140.
Common Questions
What is Per Capita Income in Bartow?
Per Capita income in Bartow is $40,314.
What is the Median Family Income in Bartow?
Median Family Income in Bartow is $61,000.
What is the Median Household income in Bartow?
Median Household Income in Bartow is $43,750.
What is Income or Wage Gap in Bartow?
Income or Wage Gap in Bartow is 7.4%.
Women in Bartow earn 92.6 cents for every dollar earned by a man.
What is Inequality or Gini Index in Bartow?
Inequality or Gini Index in Bartow is 0.42.
What is the Total Population of Bartow?
Total Population of Bartow is 219.
What is the Total Male Population of Bartow?
Total Male Population of Bartow is 130.
What is the Total Female Population of Bartow?
Total Female Population of Bartow is 89.
What is the Ratio of Males per 100 Females in Bartow?
There are 146.07 Males per 100 Females in Bartow.
What is the Ratio of Females per 100 Males in Bartow?
There are 68.46 Females per 100 Males in Bartow.
What is the Median Population Age in Bartow?
Median Population Age in Bartow is 59.5 Years.
What is the Average Family Size in Bartow
Average Family Size in Bartow is 2.3 People.
What is the Average Household Size in Bartow
Average Household Size in Bartow is 1.6 People.
How Large is the Labor Force in Bartow?
There are 141 People in the Labor Forcein in Bartow.
What is the Percentage of People in the Labor Force in Bartow?
65.3% of People are in the Labor Force in Bartow.
What is the Unemployment Rate in Bartow?
Unemployment Rate in Bartow is 3.5%.