Allentown, GA Map & Demographics
Allentown Map
Allentown Overview
$25,092
PER CAPITA INCOME
$56,429
AVG FAMILY INCOME
$42,750
AVG HOUSEHOLD INCOME
46.1%
WAGE / INCOME GAP [ % ]
53.9¢/ $1
WAGE / INCOME GAP [ $ ]
0.29
INEQUALITY / GINI INDEX
204
TOTAL POPULATION
100
MALE POPULATION
104
FEMALE POPULATION
96.15
MALES / 100 FEMALES
104.00
FEMALES / 100 MALES
65.0
MEDIAN AGE
2.8
AVG FAMILY SIZE
2.2
AVG HOUSEHOLD SIZE
64
LABOR FORCE [ PEOPLE ]
37.9%
PERCENT IN LABOR FORCE
3.1%
UNEMPLOYMENT RATE
Allentown Zip Codes
Allentown Area Codes
Income in Allentown
Income Overview in Allentown
Per Capita Income in Allentown is $25,092, while median incomes of families and households are $56,429 and $42,750 respectively.
| Characteristic | Number | Measure |
| Per Capita Income | 204 | $25,092 |
| Median Family Income | 50 | $56,429 |
| Mean Family Income | 50 | $62,304 |
| Median Household Income | 91 | $42,750 |
| Mean Household Income | 91 | $51,134 |
| Income Deficit | 50 | $0 |
| Wage / Income Gap (%) | 204 | 46.07% |
| Wage / Income Gap ($) | 204 | 53.93¢ per $1 |
| Gini / Inequality Index | 204 | 0.29 |
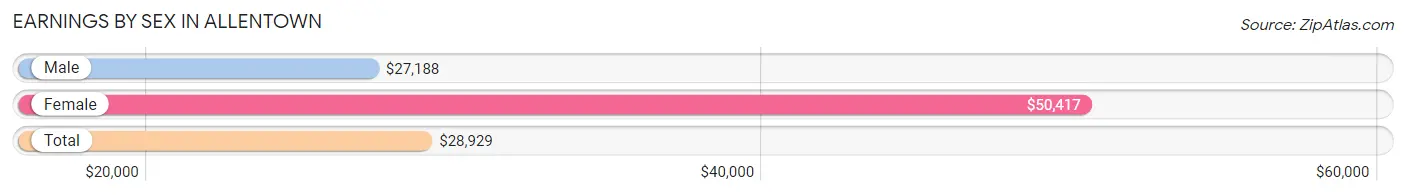
Earnings by Sex in Allentown
Average Earnings in Allentown are $28,929, $27,188 for men and $50,417 for women, a difference of 46.1%.
| Sex | Number | Average Earnings |
| Male | 49 (72.1%) | $27,188 |
| Female | 19 (27.9%) | $50,417 |
| Total | 68 (100.0%) | $28,929 |
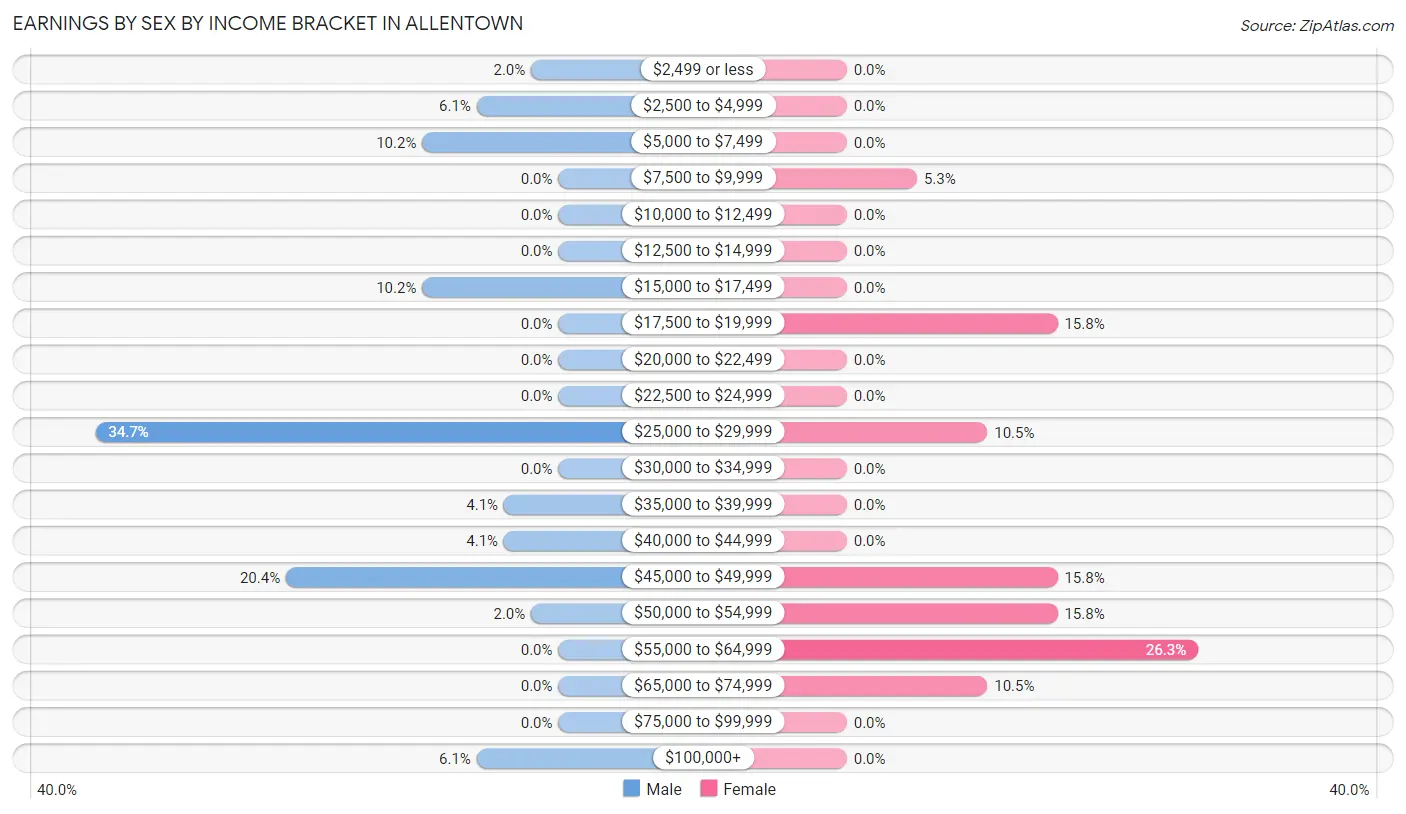
Earnings by Sex by Income Bracket in Allentown
The most common earnings brackets in Allentown are $25,000 to $29,999 for men (17 | 34.7%) and $55,000 to $64,999 for women (5 | 26.3%).
| Income | Male | Female |
| $2,499 or less | 1 (2.0%) | 0 (0.0%) |
| $2,500 to $4,999 | 3 (6.1%) | 0 (0.0%) |
| $5,000 to $7,499 | 5 (10.2%) | 0 (0.0%) |
| $7,500 to $9,999 | 0 (0.0%) | 1 (5.3%) |
| $10,000 to $12,499 | 0 (0.0%) | 0 (0.0%) |
| $12,500 to $14,999 | 0 (0.0%) | 0 (0.0%) |
| $15,000 to $17,499 | 5 (10.2%) | 0 (0.0%) |
| $17,500 to $19,999 | 0 (0.0%) | 3 (15.8%) |
| $20,000 to $22,499 | 0 (0.0%) | 0 (0.0%) |
| $22,500 to $24,999 | 0 (0.0%) | 0 (0.0%) |
| $25,000 to $29,999 | 17 (34.7%) | 2 (10.5%) |
| $30,000 to $34,999 | 0 (0.0%) | 0 (0.0%) |
| $35,000 to $39,999 | 2 (4.1%) | 0 (0.0%) |
| $40,000 to $44,999 | 2 (4.1%) | 0 (0.0%) |
| $45,000 to $49,999 | 10 (20.4%) | 3 (15.8%) |
| $50,000 to $54,999 | 1 (2.0%) | 3 (15.8%) |
| $55,000 to $64,999 | 0 (0.0%) | 5 (26.3%) |
| $65,000 to $74,999 | 0 (0.0%) | 2 (10.5%) |
| $75,000 to $99,999 | 0 (0.0%) | 0 (0.0%) |
| $100,000+ | 3 (6.1%) | 0 (0.0%) |
| Total | 49 (100.0%) | 19 (100.0%) |
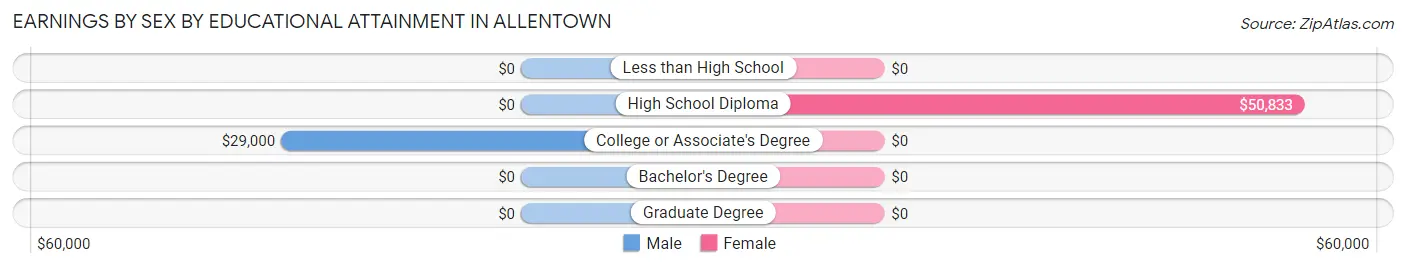
Earnings by Sex by Educational Attainment in Allentown
Average earnings in Allentown are $26,146 for men and $50,417 for women, a difference of 48.1%. Men with an educational attainment of college or associate's degree enjoy the highest average annual earnings of $29,000, while those with college or associate's degree education earn the least with $29,000. Women with an educational attainment of high school diploma earn the most with the average annual earnings of $50,833, while those with high school diploma education have the smallest earnings of $50,833.
| Educational Attainment | Male Income | Female Income |
| Less than High School | - | - |
| High School Diploma | - | - |
| College or Associate's Degree | $29,000 | $0 |
| Bachelor's Degree | - | - |
| Graduate Degree | - | - |
| Total | $26,146 | $50,417 |
Family Income in Allentown
Family Income Brackets in Allentown
According to the Allentown family income data, there are 21 families falling into the $50,000 to $74,999 income range, which is the most common income bracket and makes up 42.0% of all families.
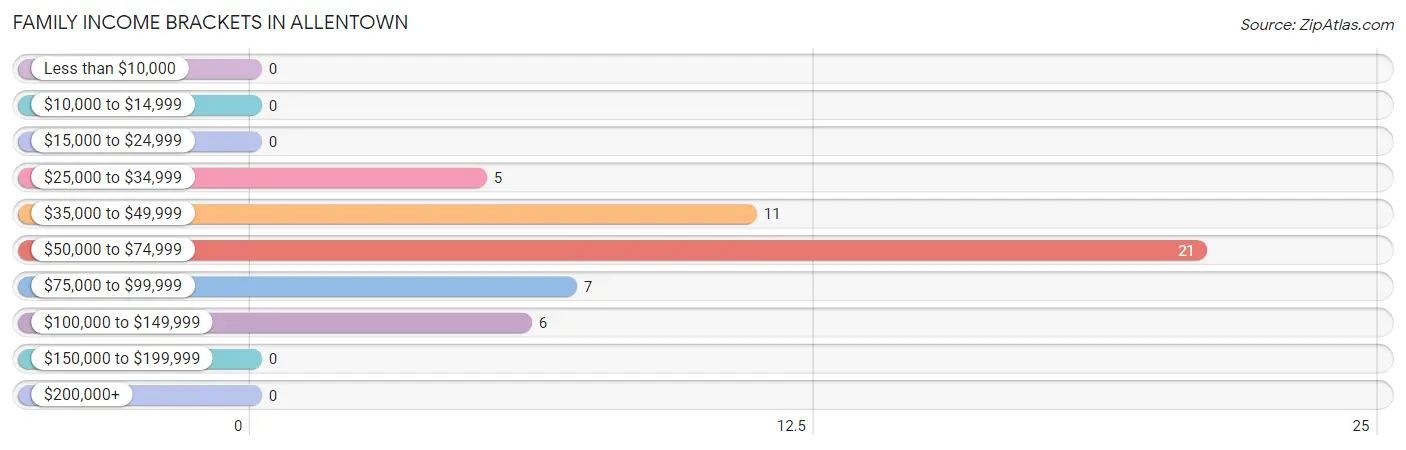
| Income Bracket | # Families | % Families |
| Less than $10,000 | 0 | 0.0% |
| $10,000 to $14,999 | 0 | 0.0% |
| $15,000 to $24,999 | 0 | 0.0% |
| $25,000 to $34,999 | 5 | 10.0% |
| $35,000 to $49,999 | 11 | 22.0% |
| $50,000 to $74,999 | 21 | 42.0% |
| $75,000 to $99,999 | 7 | 14.0% |
| $100,000 to $149,999 | 6 | 12.0% |
| $150,000 to $199,999 | 0 | 0.0% |
| $200,000+ | 0 | 0.0% |
Family Income by Famaliy Size in Allentown
3-person families (11 | 22.0%) account for the highest median family income in Allentown with $73,438 per family, while 2-person families (37 | 74.0%) have the highest median income of $27,991 per family member.
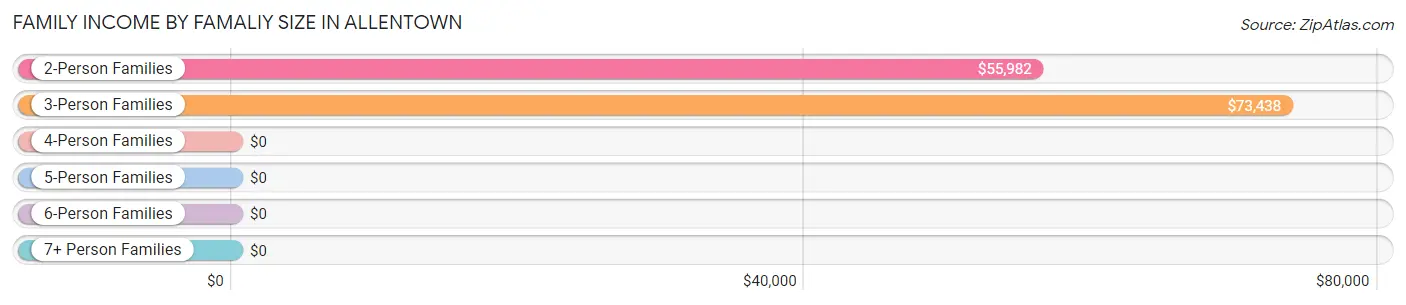
| Income Bracket | # Families | Median Income |
| 2-Person Families | 37 (74.0%) | $55,982 |
| 3-Person Families | 11 (22.0%) | $73,438 |
| 4-Person Families | 0 (0.0%) | $0 |
| 5-Person Families | 2 (4.0%) | $0 |
| 6-Person Families | 0 (0.0%) | $0 |
| 7+ Person Families | 0 (0.0%) | $0 |
| Total | 50 (100.0%) | $56,429 |
Family Income by Number of Earners in Allentown
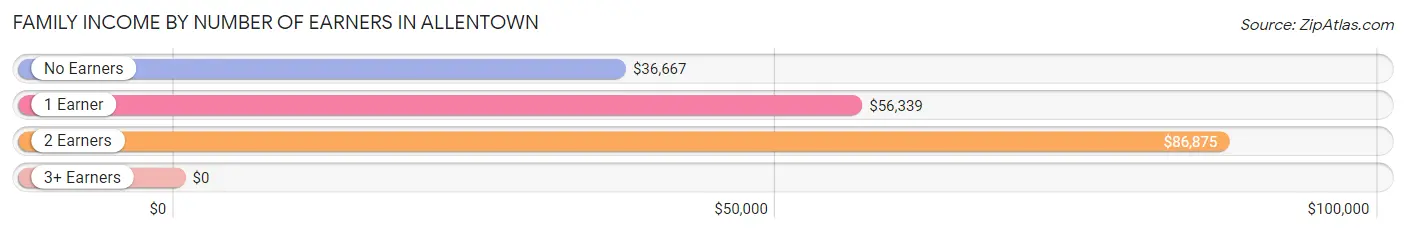
| Number of Earners | # Families | Median Income |
| No Earners | 14 (28.0%) | $36,667 |
| 1 Earner | 23 (46.0%) | $56,339 |
| 2 Earners | 13 (26.0%) | $86,875 |
| 3+ Earners | 0 (0.0%) | $0 |
| Total | 50 (100.0%) | $56,429 |
Household Income in Allentown
Household Income Brackets in Allentown
With 33 households falling in the category, the $25,000 to $34,999 income range is the most frequent in Allentown, accounting for 36.3% of all households.
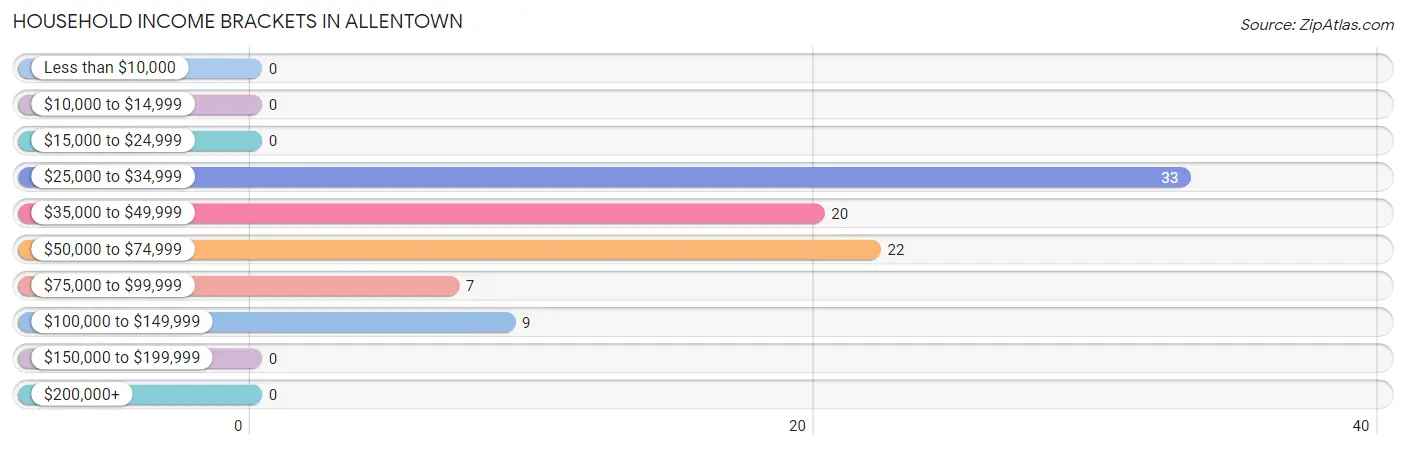
| Income Bracket | # Households | % Households |
| Less than $10,000 | 0 | 0.0% |
| $10,000 to $14,999 | 0 | 0.0% |
| $15,000 to $24,999 | 0 | 0.0% |
| $25,000 to $34,999 | 33 | 36.3% |
| $35,000 to $49,999 | 20 | 22.0% |
| $50,000 to $74,999 | 22 | 24.2% |
| $75,000 to $99,999 | 7 | 7.7% |
| $100,000 to $149,999 | 9 | 9.9% |
| $150,000 to $199,999 | 0 | 0.0% |
| $200,000+ | 0 | 0.0% |
Household Income by Householder Age in Allentown
The median household income in Allentown is $42,750, with the highest median household income of $74,063 found in the 25 to 44 years age bracket for the primary householder. A total of 7 households (7.7%) fall into this category.
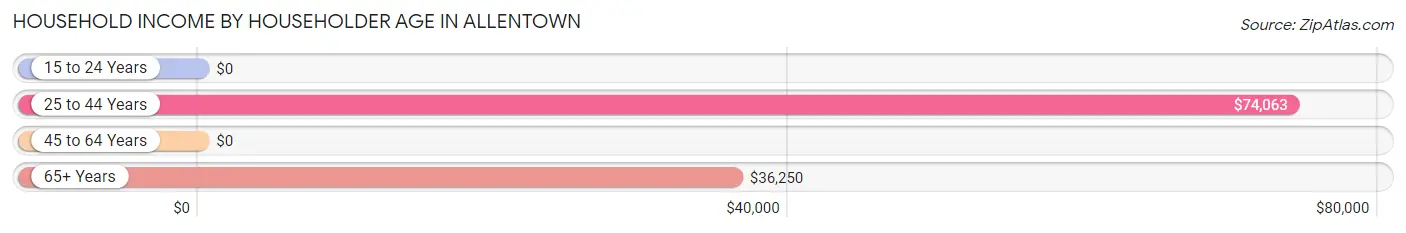
| Income Bracket | # Households | Median Income |
| 15 to 24 Years | 0 (0.0%) | $0 |
| 25 to 44 Years | 7 (7.7%) | $74,063 |
| 45 to 64 Years | 30 (33.0%) | $0 |
| 65+ Years | 54 (59.3%) | $36,250 |
| Total | 91 (100.0%) | $42,750 |
Poverty in Allentown
Income Below Poverty by Sex and Age in Allentown
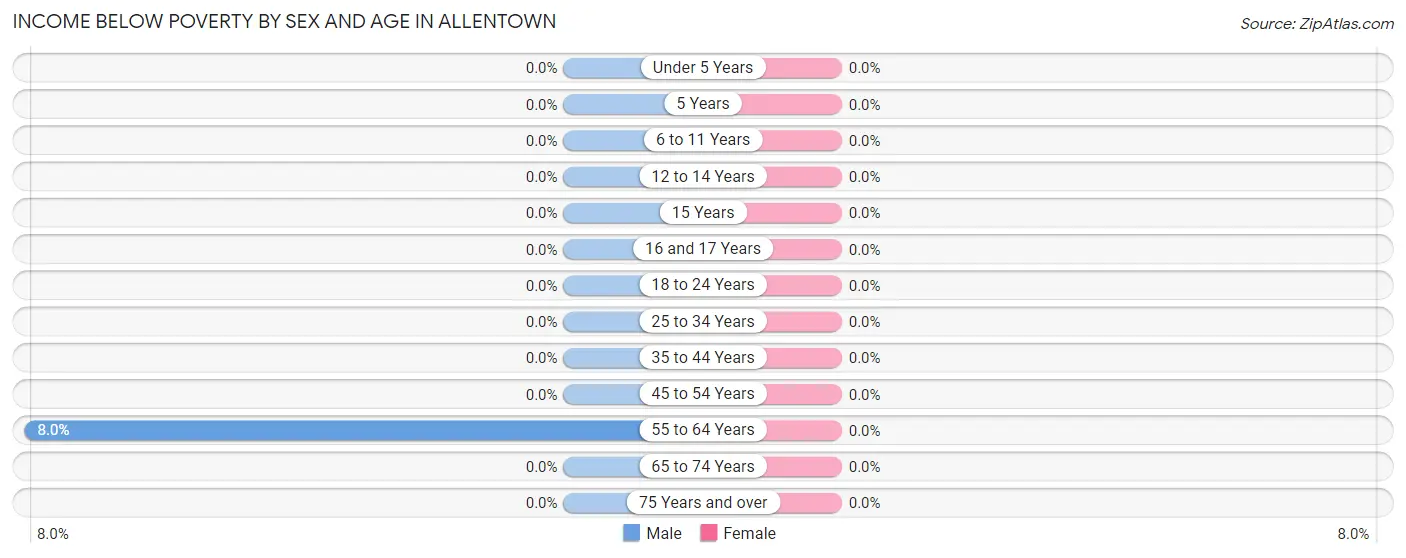
| Age Bracket | Male | Female |
| Under 5 Years | 0 (0.0%) | 0 (0.0%) |
| 5 Years | 0 (0.0%) | 0 (0.0%) |
| 6 to 11 Years | 0 (0.0%) | 0 (0.0%) |
| 12 to 14 Years | 0 (0.0%) | 0 (0.0%) |
| 15 Years | 0 (0.0%) | 0 (0.0%) |
| 16 and 17 Years | 0 (0.0%) | 0 (0.0%) |
| 18 to 24 Years | 0 (0.0%) | 0 (0.0%) |
| 25 to 34 Years | 0 (0.0%) | 0 (0.0%) |
| 35 to 44 Years | 0 (0.0%) | 0 (0.0%) |
| 45 to 54 Years | 0 (0.0%) | 0 (0.0%) |
| 55 to 64 Years | 2 (8.0%) | 0 (0.0%) |
| 65 to 74 Years | 0 (0.0%) | 0 (0.0%) |
| 75 Years and over | 0 (0.0%) | 0 (0.0%) |
| Total | 2 (2.2%) | 0 (0.0%) |
Income Above Poverty by Sex and Age in Allentown
According to the poverty statistics in Allentown, males aged under 5 years and females aged under 5 years are the age groups that are most secure financially, with 100.0% of males and 100.0% of females in these age groups living above the poverty line.
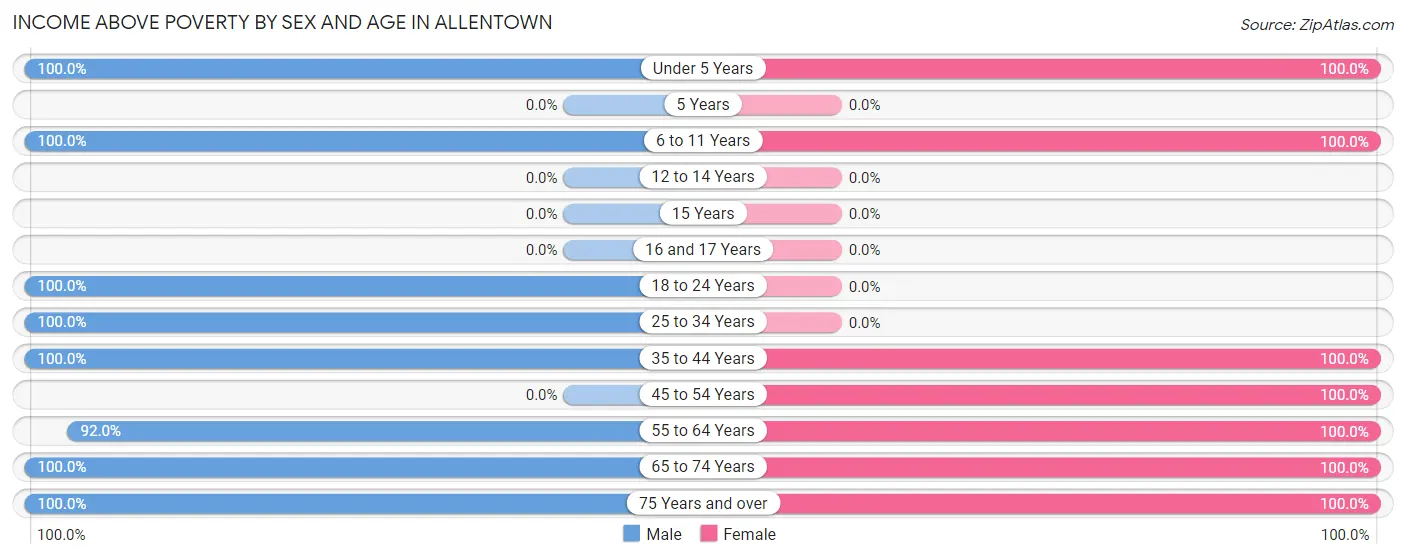
| Age Bracket | Male | Female |
| Under 5 Years | 5 (100.0%) | 5 (100.0%) |
| 5 Years | 0 (0.0%) | 0 (0.0%) |
| 6 to 11 Years | 3 (100.0%) | 14 (100.0%) |
| 12 to 14 Years | 0 (0.0%) | 0 (0.0%) |
| 15 Years | 0 (0.0%) | 0 (0.0%) |
| 16 and 17 Years | 0 (0.0%) | 0 (0.0%) |
| 18 to 24 Years | 10 (100.0%) | 0 (0.0%) |
| 25 to 34 Years | 7 (100.0%) | 0 (0.0%) |
| 35 to 44 Years | 6 (100.0%) | 5 (100.0%) |
| 45 to 54 Years | 0 (0.0%) | 5 (100.0%) |
| 55 to 64 Years | 23 (92.0%) | 9 (100.0%) |
| 65 to 74 Years | 24 (100.0%) | 19 (100.0%) |
| 75 Years and over | 12 (100.0%) | 47 (100.0%) |
| Total | 90 (97.8%) | 104 (100.0%) |
Income Below Poverty Among Married-Couple Families in Allentown
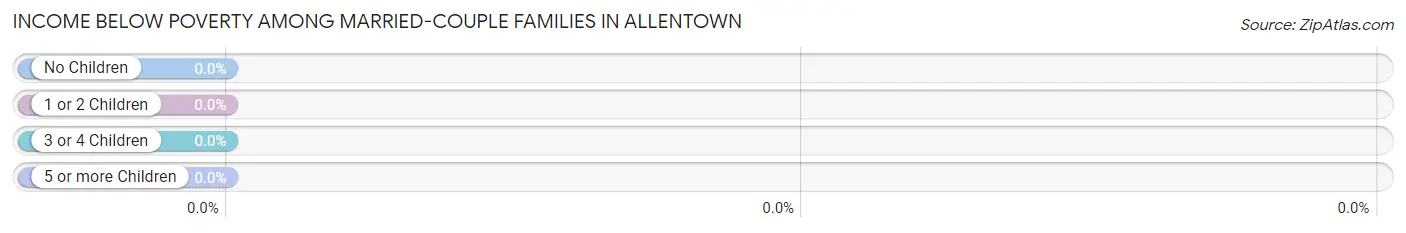
| Children | Above Poverty | Below Poverty |
| No Children | 27 (100.0%) | 0 (0.0%) |
| 1 or 2 Children | 7 (100.0%) | 0 (0.0%) |
| 3 or 4 Children | 2 (100.0%) | 0 (0.0%) |
| 5 or more Children | 0 (0.0%) | 0 (0.0%) |
| Total | 36 (100.0%) | 0 (0.0%) |
Income Below Poverty Among Single-Parent Households in Allentown
| Children | Single Father | Single Mother |
| No Children | 0 (0.0%) | 0 (0.0%) |
| 1 or 2 Children | 0 (0.0%) | 0 (0.0%) |
| 3 or 4 Children | 0 (0.0%) | 0 (0.0%) |
| 5 or more Children | 0 (0.0%) | 0 (0.0%) |
| Total | 0 (0.0%) | 0 (0.0%) |
Income Below Poverty Among Married-Couple vs Single-Parent Households in Allentown
| Children | Married-Couple Families | Single-Parent Households |
| No Children | 0 (0.0%) | 0 (0.0%) |
| 1 or 2 Children | 0 (0.0%) | 0 (0.0%) |
| 3 or 4 Children | 0 (0.0%) | 0 (0.0%) |
| 5 or more Children | 0 (0.0%) | 0 (0.0%) |
| Total | 0 (0.0%) | 0 (0.0%) |
Race in Allentown
The most populous races in Allentown are White / Caucasian (145 | 71.1%), Black / African American (58 | 28.4%), and Two or more Races (1 | 0.5%).
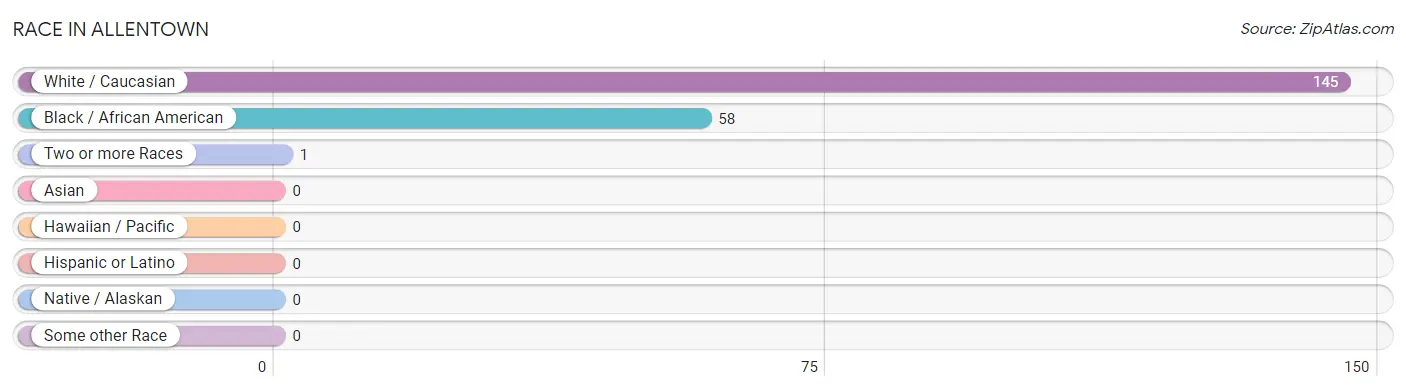
| Race | # Population | % Population |
| Asian | 0 | 0.0% |
| Black / African American | 58 | 28.4% |
| Hawaiian / Pacific | 0 | 0.0% |
| Hispanic or Latino | 0 | 0.0% |
| Native / Alaskan | 0 | 0.0% |
| White / Caucasian | 145 | 71.1% |
| Two or more Races | 1 | 0.5% |
| Some other Race | 0 | 0.0% |
| Total | 204 | 100.0% |
Ancestry in Allentown
The most populous ancestries reported in Allentown are American (24 | 11.8%), Irish (8 | 3.9%), Dutch (5 | 2.5%), English (5 | 2.5%), and Italian (3 | 1.5%), together accounting for 22.0% of all Allentown residents.
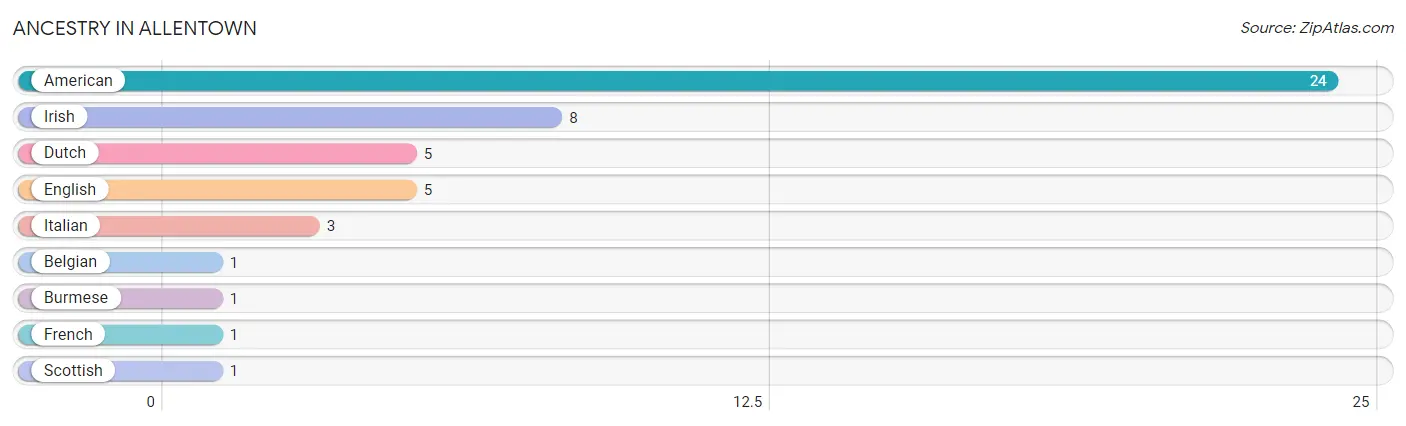
| Ancestry | # Population | % Population |
| American | 24 | 11.8% |
| Belgian | 1 | 0.5% |
| Burmese | 1 | 0.5% |
| Dutch | 5 | 2.5% |
| English | 5 | 2.5% |
| French | 1 | 0.5% |
| Irish | 8 | 3.9% |
| Italian | 3 | 1.5% |
| Scottish | 1 | 0.5% | View All 9 Rows |
Immigrants in Allentown

| Immigration Origin | # Population | % Population | View All 0 Rows |
Sex and Age in Allentown
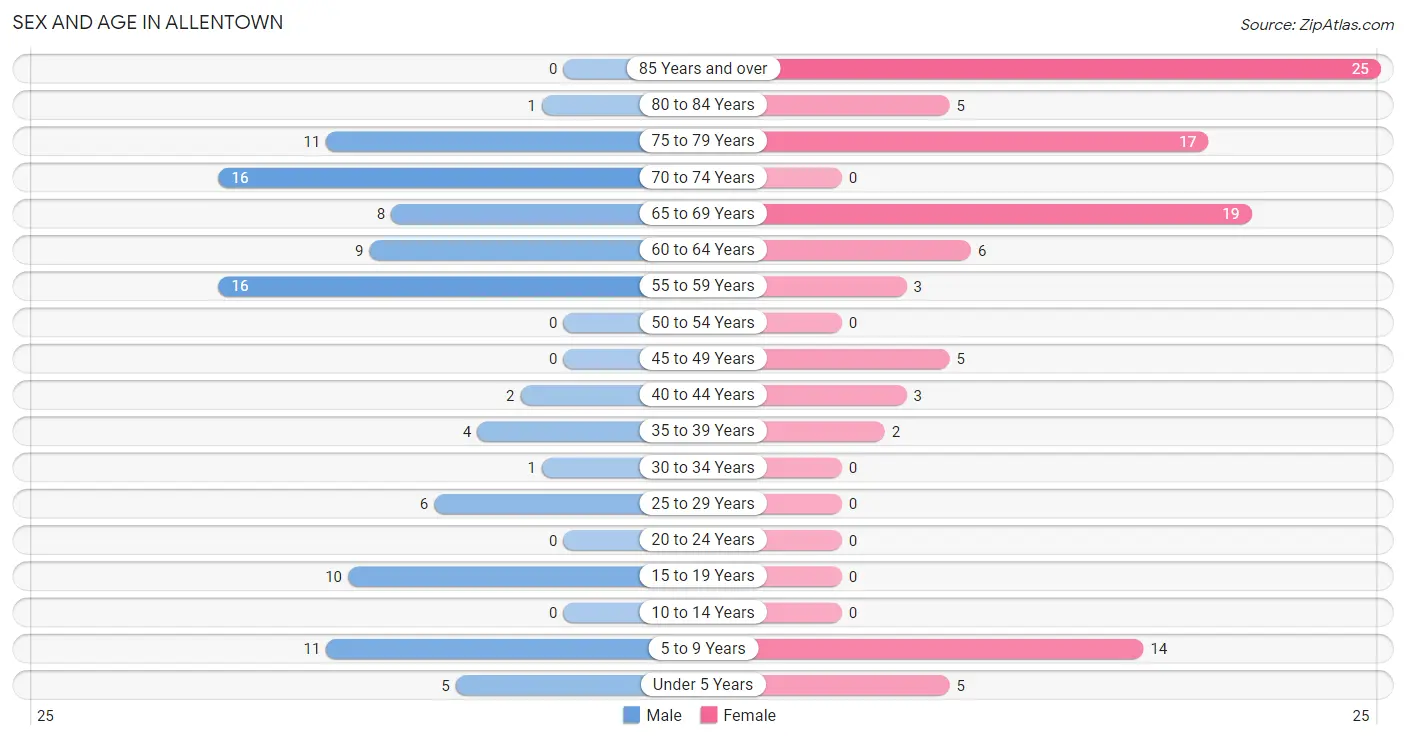
Sex and Age in Allentown
The most populous age groups in Allentown are 55 to 59 Years (16 | 16.0%) for men and 85 Years and over (25 | 24.0%) for women.
| Age Bracket | Male | Female |
| Under 5 Years | 5 (5.0%) | 5 (4.8%) |
| 5 to 9 Years | 11 (11.0%) | 14 (13.5%) |
| 10 to 14 Years | 0 (0.0%) | 0 (0.0%) |
| 15 to 19 Years | 10 (10.0%) | 0 (0.0%) |
| 20 to 24 Years | 0 (0.0%) | 0 (0.0%) |
| 25 to 29 Years | 6 (6.0%) | 0 (0.0%) |
| 30 to 34 Years | 1 (1.0%) | 0 (0.0%) |
| 35 to 39 Years | 4 (4.0%) | 2 (1.9%) |
| 40 to 44 Years | 2 (2.0%) | 3 (2.9%) |
| 45 to 49 Years | 0 (0.0%) | 5 (4.8%) |
| 50 to 54 Years | 0 (0.0%) | 0 (0.0%) |
| 55 to 59 Years | 16 (16.0%) | 3 (2.9%) |
| 60 to 64 Years | 9 (9.0%) | 6 (5.8%) |
| 65 to 69 Years | 8 (8.0%) | 19 (18.3%) |
| 70 to 74 Years | 16 (16.0%) | 0 (0.0%) |
| 75 to 79 Years | 11 (11.0%) | 17 (16.4%) |
| 80 to 84 Years | 1 (1.0%) | 5 (4.8%) |
| 85 Years and over | 0 (0.0%) | 25 (24.0%) |
| Total | 100 (100.0%) | 104 (100.0%) |
Families and Households in Allentown
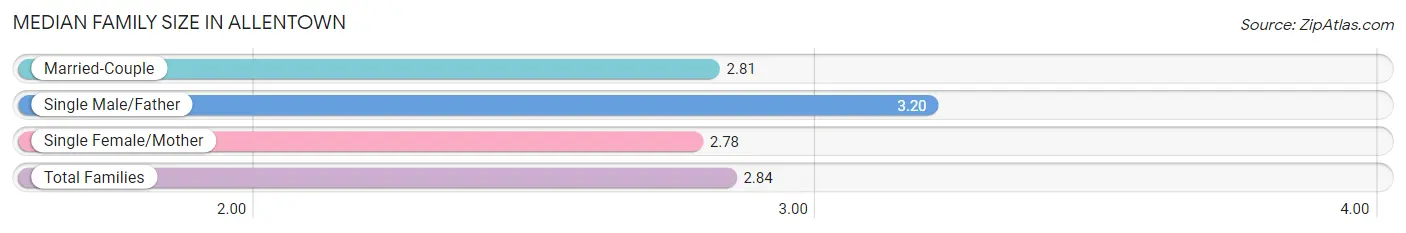
Median Family Size in Allentown
The median family size in Allentown is 2.84 persons per family, with single male/father families (5 | 10.0%) accounting for the largest median family size of 3.2 persons per family. On the other hand, single female/mother families (9 | 18.0%) represent the smallest median family size with 2.78 persons per family.
| Family Type | # Families | Family Size |
| Married-Couple | 36 (72.0%) | 2.81 |
| Single Male/Father | 5 (10.0%) | 3.20 |
| Single Female/Mother | 9 (18.0%) | 2.78 |
| Total Families | 50 (100.0%) | 2.84 |
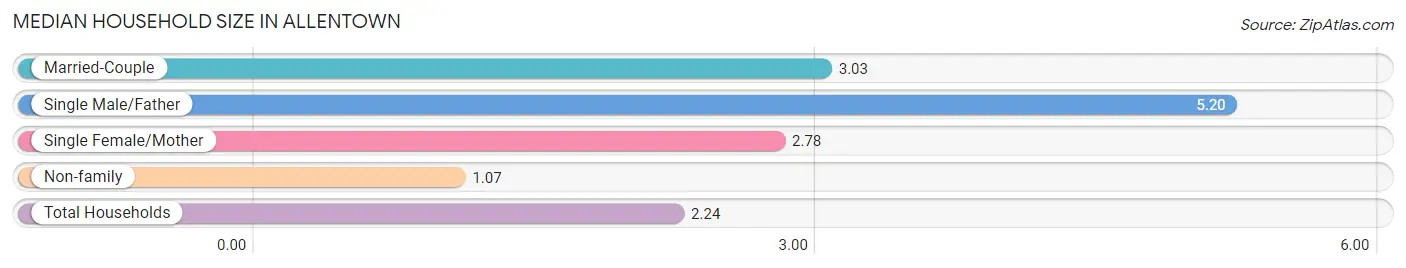
Median Household Size in Allentown
The median household size in Allentown is 2.24 persons per household, with single male/father households (5 | 5.5%) accounting for the largest median household size of 5.2 persons per household. non-family households (41 | 45.1%) represent the smallest median household size with 1.07 persons per household.
| Household Type | # Households | Household Size |
| Married-Couple | 36 (39.6%) | 3.03 |
| Single Male/Father | 5 (5.5%) | 5.20 |
| Single Female/Mother | 9 (9.9%) | 2.78 |
| Non-family | 41 (45.1%) | 1.07 |
| Total Households | 91 (100.0%) | 2.24 |
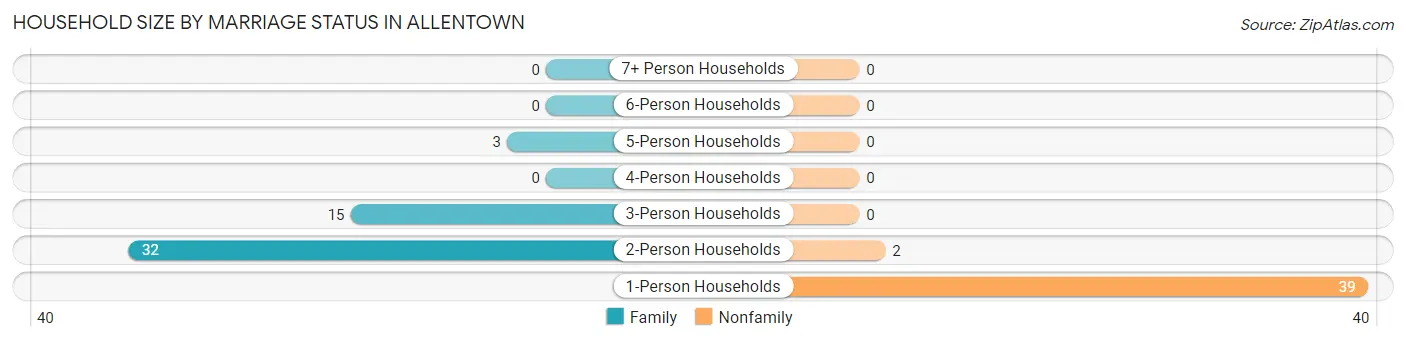
Household Size by Marriage Status in Allentown
Out of a total of 91 households in Allentown, 50 (54.9%) are family households, while 41 (45.1%) are nonfamily households. The most numerous type of family households are 2-person households, comprising 32, and the most common type of nonfamily households are 1-person households, comprising 39.
| Household Size | Family Households | Nonfamily Households |
| 1-Person Households | - | 39 (42.9%) |
| 2-Person Households | 32 (35.2%) | 2 (2.2%) |
| 3-Person Households | 15 (16.5%) | 0 (0.0%) |
| 4-Person Households | 0 (0.0%) | 0 (0.0%) |
| 5-Person Households | 3 (3.3%) | 0 (0.0%) |
| 6-Person Households | 0 (0.0%) | 0 (0.0%) |
| 7+ Person Households | 0 (0.0%) | 0 (0.0%) |
| Total | 50 (54.9%) | 41 (45.1%) |
Female Fertility in Allentown
Fertility by Age in Allentown
| Age Bracket | Women with Births | Births / 1,000 Women |
| 15 to 19 years | 0 (0.0%) | 0.0 |
| 20 to 34 years | 0 (0.0%) | 0.0 |
| 35 to 50 years | 0 (0.0%) | 0.0 |
| Total | 0 (0.0%) | 0.0 |
Fertility by Age by Marriage Status in Allentown
| Age Bracket | Married | Unmarried |
| 15 to 19 years | 0 (0.0%) | 0 (0.0%) |
| 20 to 34 years | 0 (0.0%) | 0 (0.0%) |
| 35 to 50 years | 0 (0.0%) | 0 (0.0%) |
| Total | 0 (0.0%) | 0 (0.0%) |
Fertility by Education in Allentown
| Educational Attainment | Women with Births | Births / 1,000 Women |
| Less than High School | 0 (0.0%) | 0.0 |
| High School Diploma | 0 (0.0%) | 0.0 |
| College or Associate's Degree | 0 (0.0%) | 0.0 |
| Bachelor's Degree | 0 (0.0%) | 0.0 |
| Graduate Degree | 0 (0.0%) | 0.0 |
| Total | 0 (0.0%) | 0.0 |
Fertility by Education by Marriage Status in Allentown
| Educational Attainment | Married | Unmarried |
| Less than High School | 0 (0.0%) | 0 (0.0%) |
| High School Diploma | 0 (0.0%) | 0 (0.0%) |
| College or Associate's Degree | 0 (0.0%) | 0 (0.0%) |
| Bachelor's Degree | 0 (0.0%) | 0 (0.0%) |
| Graduate Degree | 0 (0.0%) | 0 (0.0%) |
| Total | 0 (0.0%) | 0 (0.0%) |
Employment Characteristics in Allentown
Employment by Class of Employer in Allentown
Among the 62 employed individuals in Allentown, private company employees (46 | 74.2%), state government employees (11 | 17.7%), and self-employed (not incorporated) (3 | 4.8%) make up the most common classes of employment.
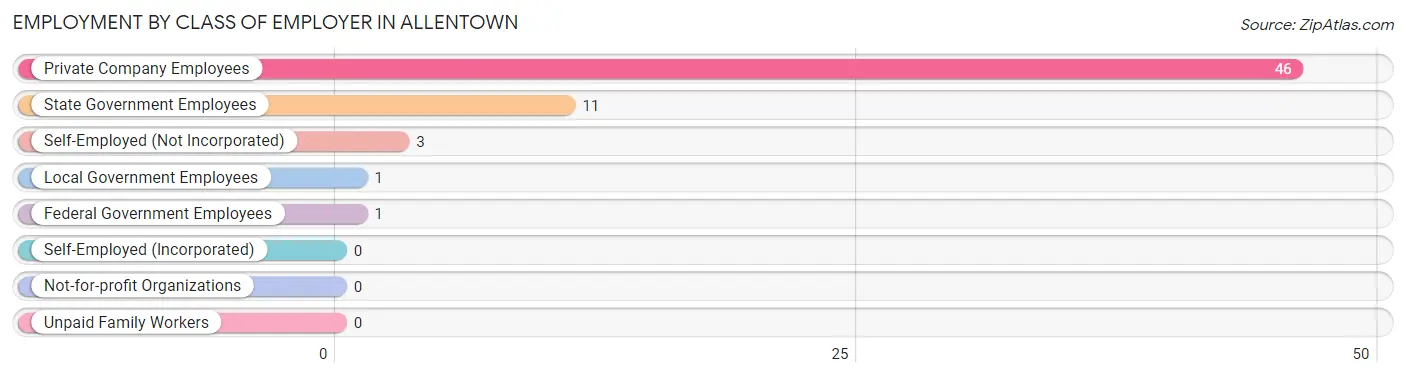
| Employer Class | # Employees | % Employees |
| Private Company Employees | 46 | 74.2% |
| Self-Employed (Incorporated) | 0 | 0.0% |
| Self-Employed (Not Incorporated) | 3 | 4.8% |
| Not-for-profit Organizations | 0 | 0.0% |
| Local Government Employees | 1 | 1.6% |
| State Government Employees | 11 | 17.7% |
| Federal Government Employees | 1 | 1.6% |
| Unpaid Family Workers | 0 | 0.0% |
| Total | 62 | 100.0% |
Employment Status by Age in Allentown
According to the labor force statistics for Allentown, out of the total population over 16 years of age (169), 37.9% or 64 individuals are in the labor force, with 3.1% or 2 of them unemployed. The age group with the highest labor force participation rate is 16 to 19 years, with 100.0% or 10 individuals in the labor force. Within the labor force, the 60 to 64 years age range has the highest percentage of unemployed individuals, with 16.7% or 2 of them being unemployed.
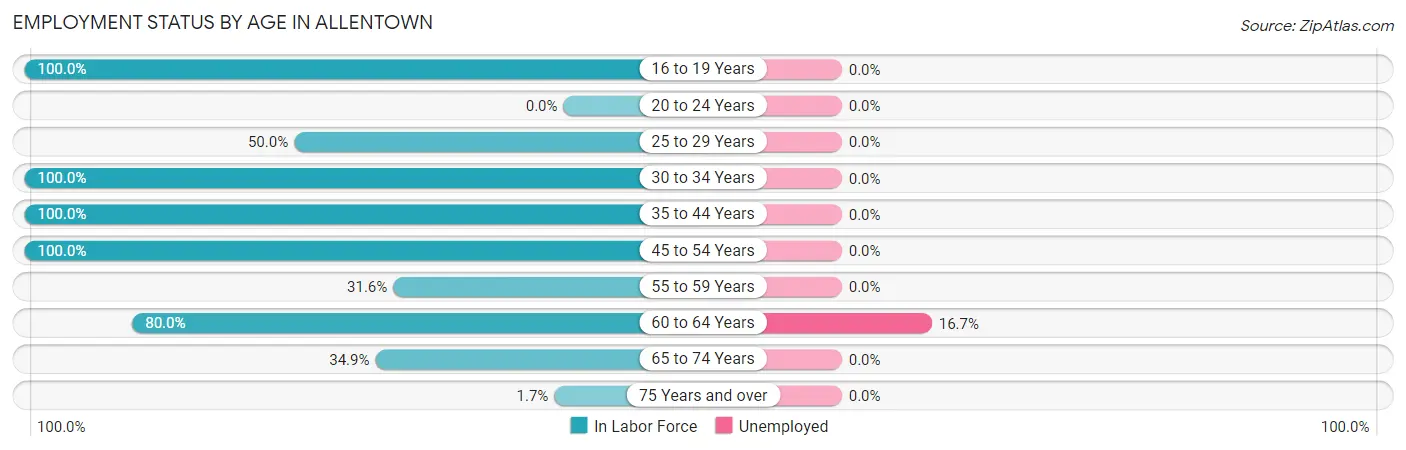
| Age Bracket | In Labor Force | Unemployed |
| 16 to 19 Years | 10 (100.0%) | 0 (0.0%) |
| 20 to 24 Years | 0 (0.0%) | 0 (0.0%) |
| 25 to 29 Years | 3 (50.0%) | 0 (0.0%) |
| 30 to 34 Years | 1 (100.0%) | 0 (0.0%) |
| 35 to 44 Years | 11 (100.0%) | 0 (0.0%) |
| 45 to 54 Years | 5 (100.0%) | 0 (0.0%) |
| 55 to 59 Years | 6 (31.6%) | 0 (0.0%) |
| 60 to 64 Years | 12 (80.0%) | 2 (16.7%) |
| 65 to 74 Years | 15 (34.9%) | 0 (0.0%) |
| 75 Years and over | 1 (1.7%) | 0 (0.0%) |
| Total | 64 (37.9%) | 2 (3.1%) |
Employment Status by Educational Attainment in Allentown
According to labor force statistics for Allentown, 66.7% of individuals (38) out of the total population between 25 and 64 years of age (57) are in the labor force, with 5.3% or 2 of them being unemployed. The group with the highest labor force participation rate are those with the educational attainment of college / associate degree, with 100.0% or 6 individuals in the labor force. Within the labor force, individuals with high school diploma education have the highest percentage of unemployment, with 10.5% or 2 of them being unemployed.
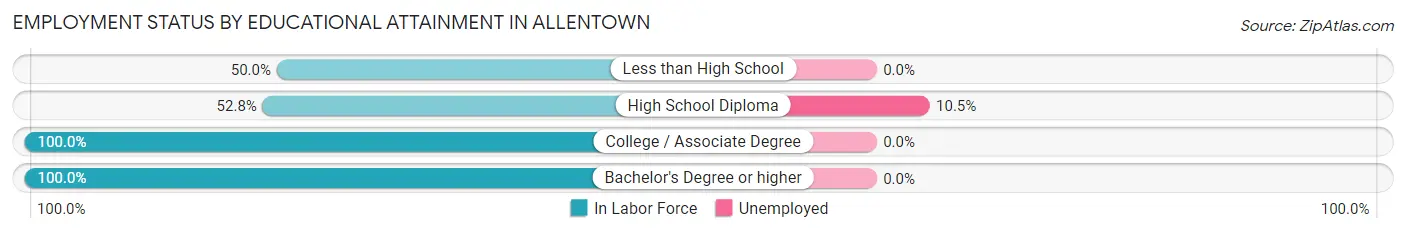
| Educational Attainment | In Labor Force | Unemployed |
| Less than High School | 2 (50.0%) | 0 (0.0%) |
| High School Diploma | 19 (52.8%) | 4 (10.5%) |
| College / Associate Degree | 6 (100.0%) | 0 (0.0%) |
| Bachelor's Degree or higher | 11 (100.0%) | 0 (0.0%) |
| Total | 38 (66.7%) | 3 (5.3%) |
Employment Occupations by Sex in Allentown
Management, Business, Science and Arts Occupations
The most common Management, Business, Science and Arts occupations in Allentown are Health Diagnosing & Treating (8 | 12.9%), Health Technologists (8 | 12.9%), Community & Social Service (7 | 11.3%), Education Instruction & Library (7 | 11.3%), and Management (3 | 4.8%).
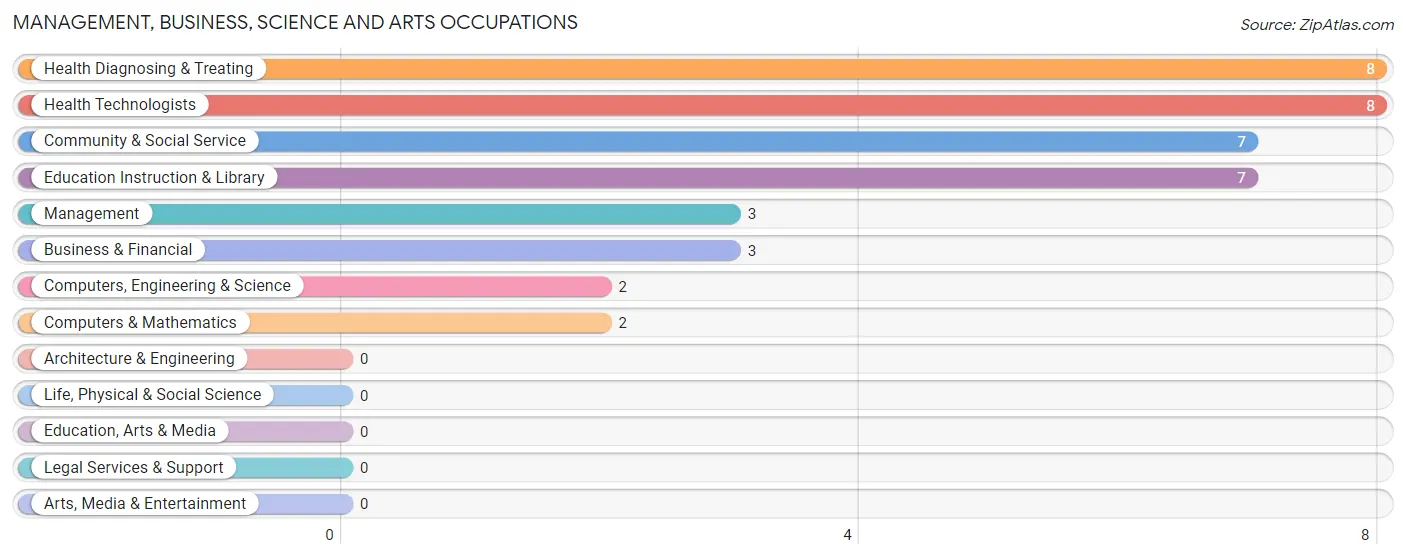
Management, Business, Science and Arts Occupations by Sex
Within the Management, Business, Science and Arts occupations in Allentown, the most male-oriented occupations are Management (100.0%), Community & Social Service (57.1%), and Education Instruction & Library (57.1%), while the most female-oriented occupations are Business & Financial (100.0%), Computers, Engineering & Science (100.0%), and Computers & Mathematics (100.0%).
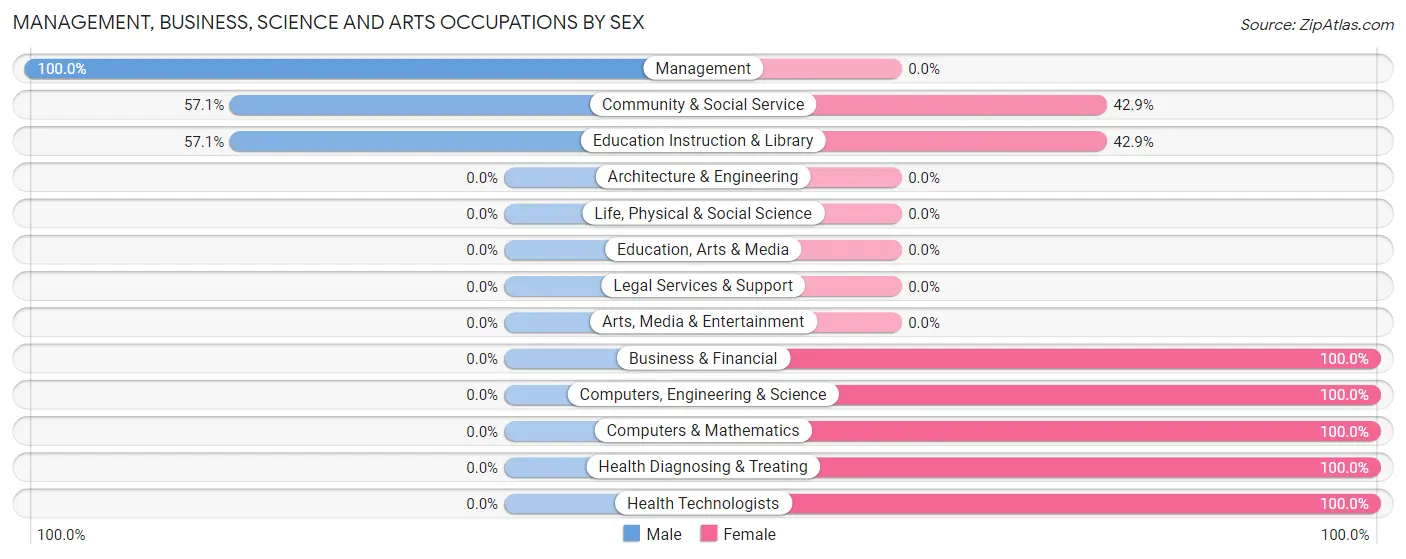
| Occupation | Male | Female |
| Management | 3 (100.0%) | 0 (0.0%) |
| Business & Financial | 0 (0.0%) | 3 (100.0%) |
| Computers, Engineering & Science | 0 (0.0%) | 2 (100.0%) |
| Computers & Mathematics | 0 (0.0%) | 2 (100.0%) |
| Architecture & Engineering | 0 (0.0%) | 0 (0.0%) |
| Life, Physical & Social Science | 0 (0.0%) | 0 (0.0%) |
| Community & Social Service | 4 (57.1%) | 3 (42.9%) |
| Education, Arts & Media | 0 (0.0%) | 0 (0.0%) |
| Legal Services & Support | 0 (0.0%) | 0 (0.0%) |
| Education Instruction & Library | 4 (57.1%) | 3 (42.9%) |
| Arts, Media & Entertainment | 0 (0.0%) | 0 (0.0%) |
| Health Diagnosing & Treating | 0 (0.0%) | 8 (100.0%) |
| Health Technologists | 0 (0.0%) | 8 (100.0%) |
| Total (Category) | 7 (30.4%) | 16 (69.6%) |
| Total (Overall) | 45 (72.6%) | 17 (27.4%) |
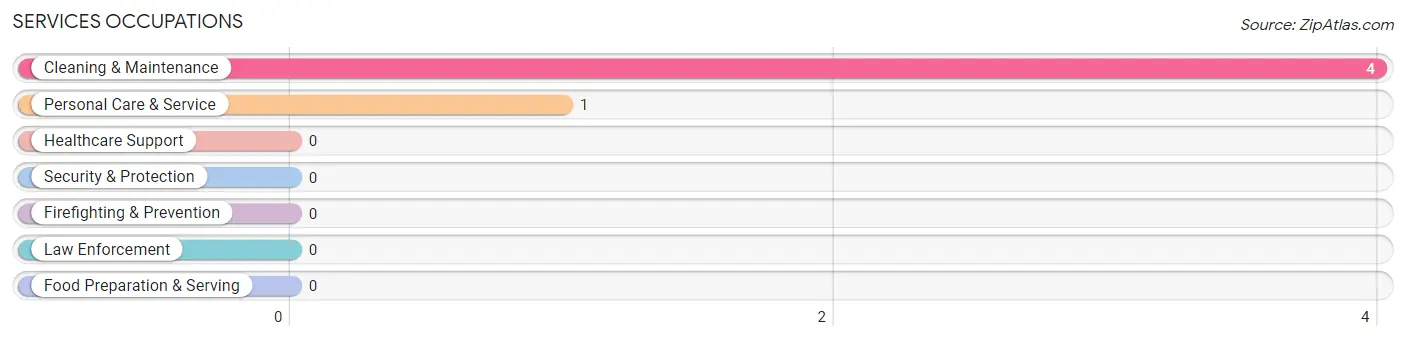
Services Occupations
The most common Services occupations in Allentown are Cleaning & Maintenance (4 | 6.5%), and Personal Care & Service (1 | 1.6%).
Services Occupations by Sex
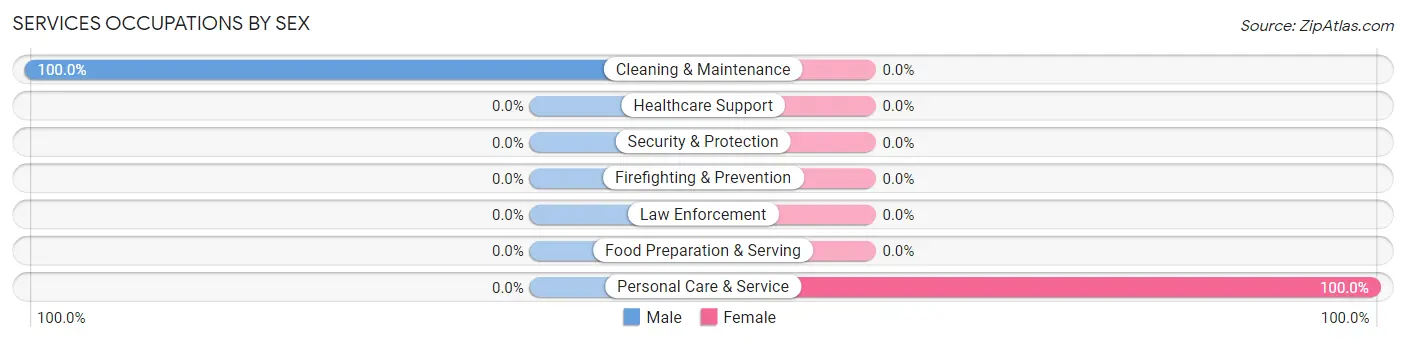
| Occupation | Male | Female |
| Healthcare Support | 0 (0.0%) | 0 (0.0%) |
| Security & Protection | 0 (0.0%) | 0 (0.0%) |
| Firefighting & Prevention | 0 (0.0%) | 0 (0.0%) |
| Law Enforcement | 0 (0.0%) | 0 (0.0%) |
| Food Preparation & Serving | 0 (0.0%) | 0 (0.0%) |
| Cleaning & Maintenance | 4 (100.0%) | 0 (0.0%) |
| Personal Care & Service | 0 (0.0%) | 1 (100.0%) |
| Total (Category) | 4 (80.0%) | 1 (20.0%) |
| Total (Overall) | 45 (72.6%) | 17 (27.4%) |
Sales and Office Occupations
The most common Sales and Office occupations in Allentown are , and Sales & Related (13 | 21.0%).

Sales and Office Occupations by Sex

| Occupation | Male | Female |
| Sales & Related | 13 (100.0%) | 0 (0.0%) |
| Office & Administration | 0 (0.0%) | 0 (0.0%) |
| Total (Category) | 13 (100.0%) | 0 (0.0%) |
| Total (Overall) | 45 (72.6%) | 17 (27.4%) |
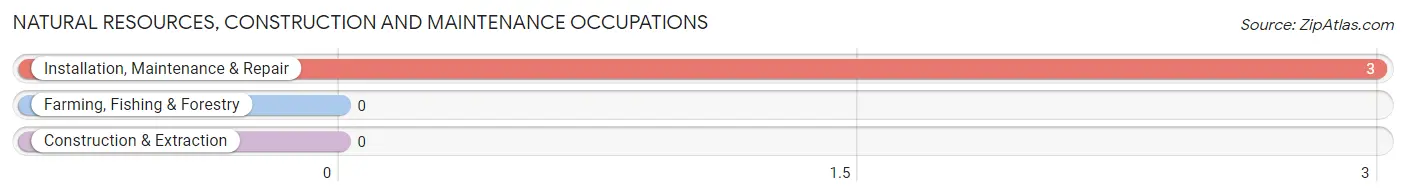
Natural Resources, Construction and Maintenance Occupations
The most common Natural Resources, Construction and Maintenance occupations in Allentown are , and Installation, Maintenance & Repair (3 | 4.8%).
Natural Resources, Construction and Maintenance Occupations by Sex

| Occupation | Male | Female |
| Farming, Fishing & Forestry | 0 (0.0%) | 0 (0.0%) |
| Construction & Extraction | 0 (0.0%) | 0 (0.0%) |
| Installation, Maintenance & Repair | 3 (100.0%) | 0 (0.0%) |
| Total (Category) | 3 (100.0%) | 0 (0.0%) |
| Total (Overall) | 45 (72.6%) | 17 (27.4%) |
Production, Transportation and Moving Occupations
The most common Production, Transportation and Moving occupations in Allentown are Production (13 | 21.0%), Material Moving (3 | 4.8%), and Transportation (2 | 3.2%).
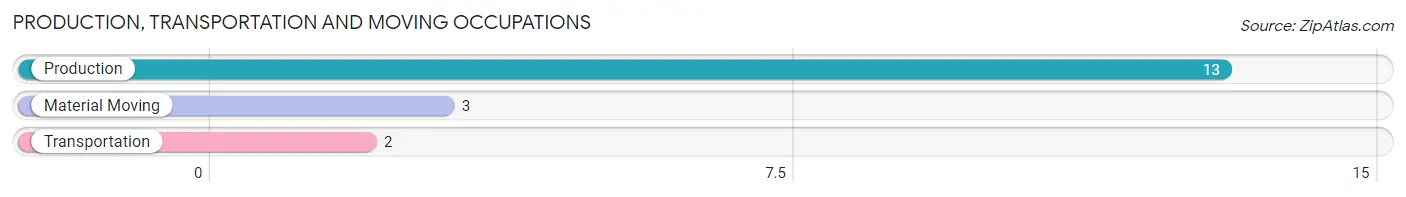
Production, Transportation and Moving Occupations by Sex
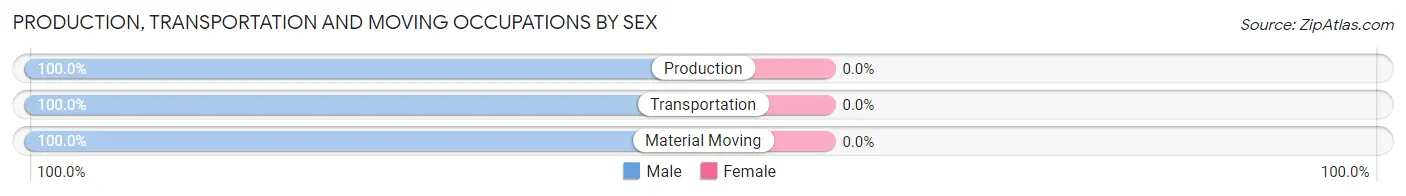
| Occupation | Male | Female |
| Production | 13 (100.0%) | 0 (0.0%) |
| Transportation | 2 (100.0%) | 0 (0.0%) |
| Material Moving | 3 (100.0%) | 0 (0.0%) |
| Total (Category) | 18 (100.0%) | 0 (0.0%) |
| Total (Overall) | 45 (72.6%) | 17 (27.4%) |
Employment Industries by Sex in Allentown
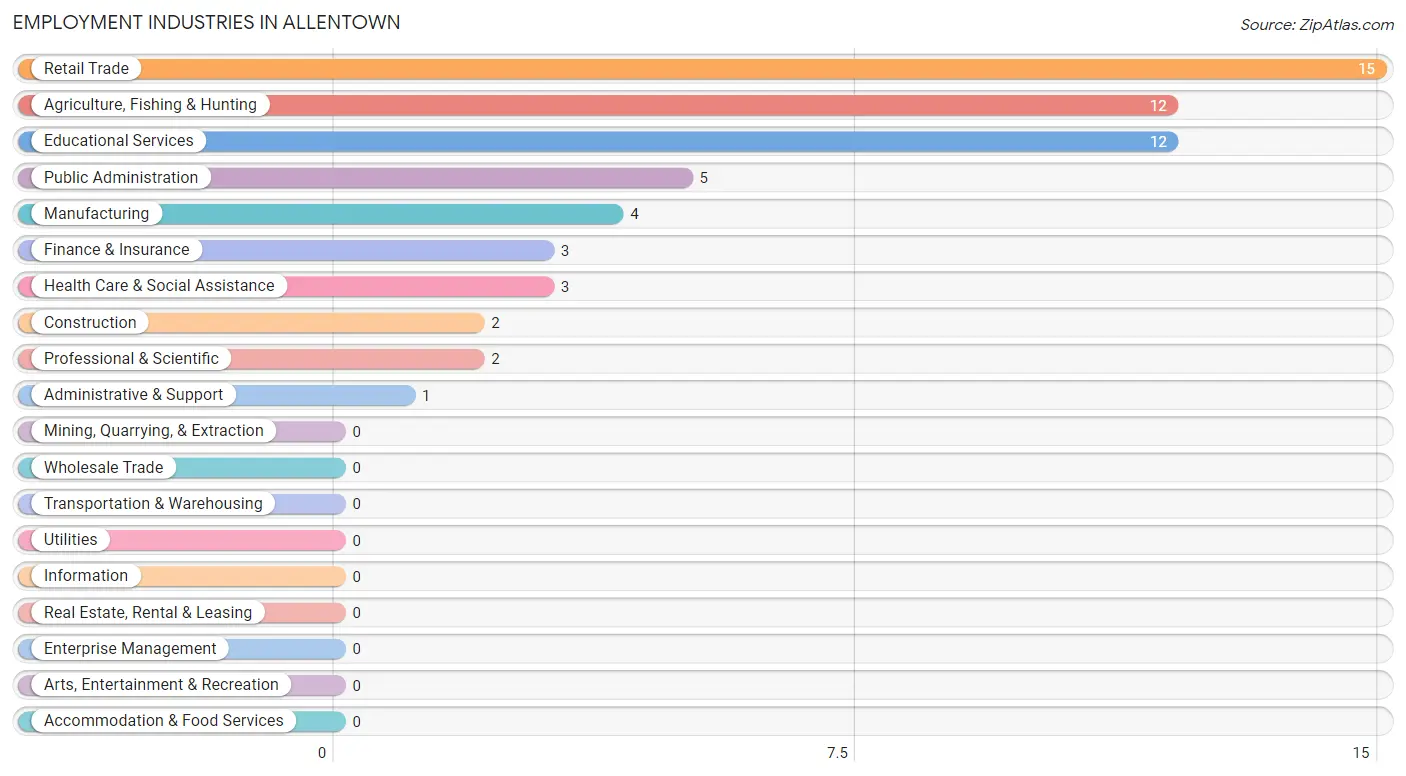
Employment Industries in Allentown
The major employment industries in Allentown include Retail Trade (15 | 24.2%), Agriculture, Fishing & Hunting (12 | 19.4%), Educational Services (12 | 19.4%), Public Administration (5 | 8.1%), and Manufacturing (4 | 6.5%).
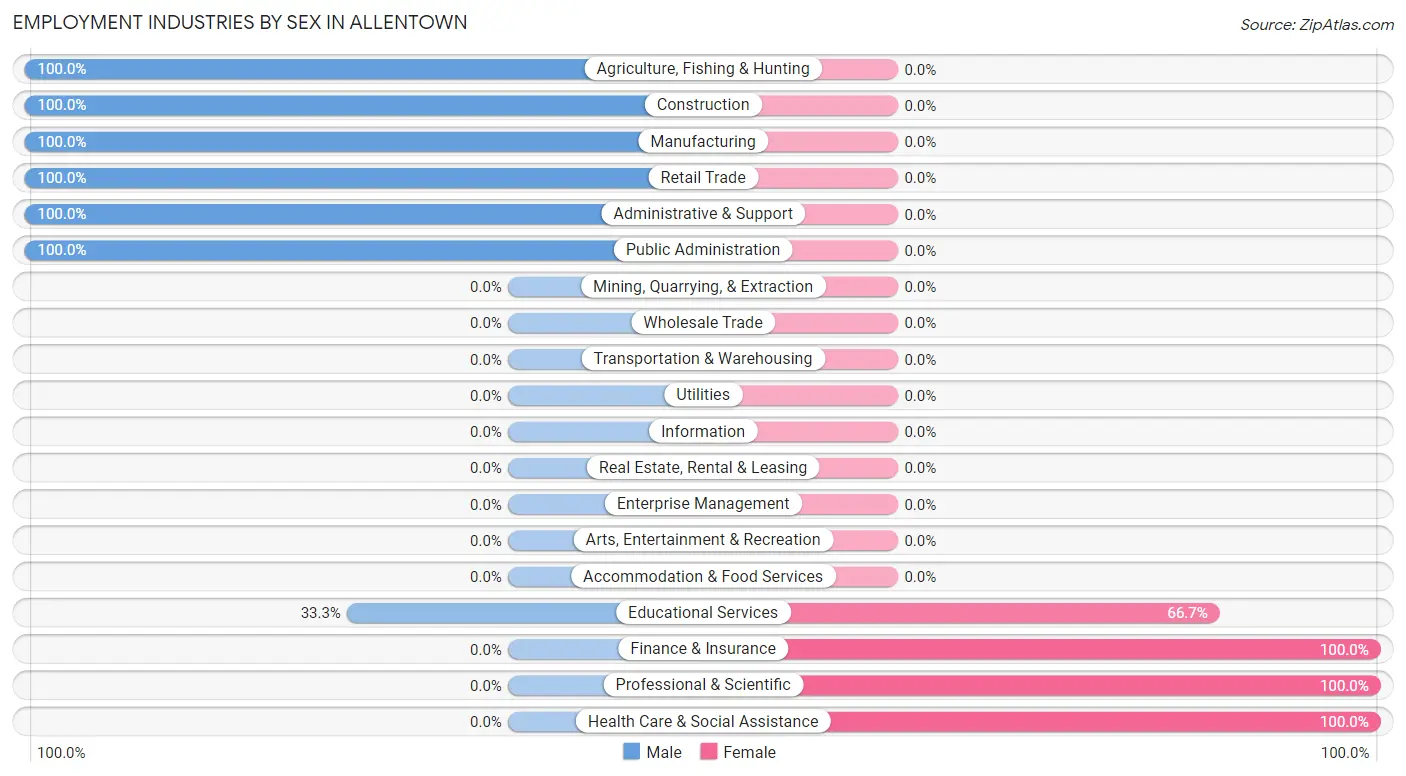
Employment Industries by Sex in Allentown
The Allentown industries that see more men than women are Agriculture, Fishing & Hunting (100.0%), Construction (100.0%), and Manufacturing (100.0%), whereas the industries that tend to have a higher number of women are Finance & Insurance (100.0%), Professional & Scientific (100.0%), and Health Care & Social Assistance (100.0%).
| Industry | Male | Female |
| Agriculture, Fishing & Hunting | 12 (100.0%) | 0 (0.0%) |
| Mining, Quarrying, & Extraction | 0 (0.0%) | 0 (0.0%) |
| Construction | 2 (100.0%) | 0 (0.0%) |
| Manufacturing | 4 (100.0%) | 0 (0.0%) |
| Wholesale Trade | 0 (0.0%) | 0 (0.0%) |
| Retail Trade | 15 (100.0%) | 0 (0.0%) |
| Transportation & Warehousing | 0 (0.0%) | 0 (0.0%) |
| Utilities | 0 (0.0%) | 0 (0.0%) |
| Information | 0 (0.0%) | 0 (0.0%) |
| Finance & Insurance | 0 (0.0%) | 3 (100.0%) |
| Real Estate, Rental & Leasing | 0 (0.0%) | 0 (0.0%) |
| Professional & Scientific | 0 (0.0%) | 2 (100.0%) |
| Enterprise Management | 0 (0.0%) | 0 (0.0%) |
| Administrative & Support | 1 (100.0%) | 0 (0.0%) |
| Educational Services | 4 (33.3%) | 8 (66.7%) |
| Health Care & Social Assistance | 0 (0.0%) | 3 (100.0%) |
| Arts, Entertainment & Recreation | 0 (0.0%) | 0 (0.0%) |
| Accommodation & Food Services | 0 (0.0%) | 0 (0.0%) |
| Public Administration | 5 (100.0%) | 0 (0.0%) |
| Total | 45 (72.6%) | 17 (27.4%) |
Education in Allentown
School Enrollment in Allentown
The most common levels of schooling among the 25 students in Allentown are elementary school (19 | 76.0%), and kindergarten (6 | 24.0%).
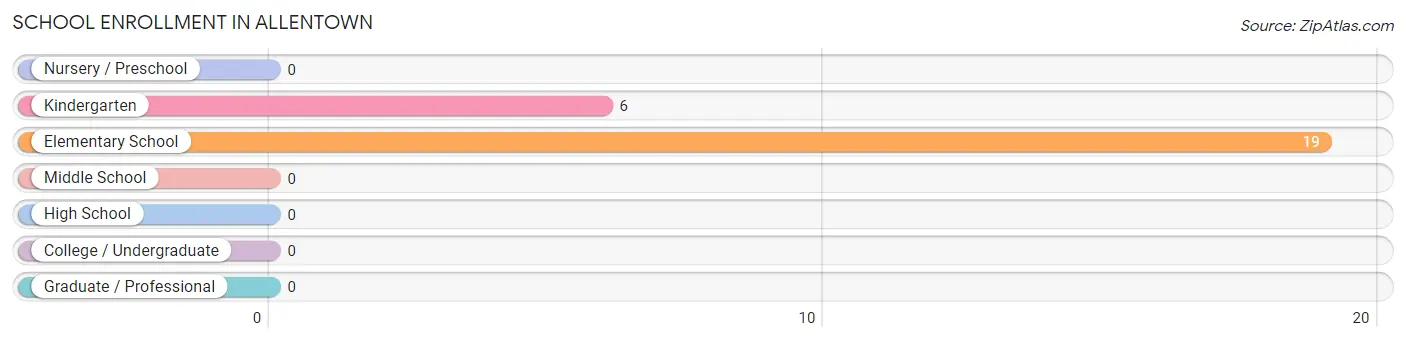
| School Level | # Students | % Students |
| Nursery / Preschool | 0 | 0.0% |
| Kindergarten | 6 | 24.0% |
| Elementary School | 19 | 76.0% |
| Middle School | 0 | 0.0% |
| High School | 0 | 0.0% |
| College / Undergraduate | 0 | 0.0% |
| Graduate / Professional | 0 | 0.0% |
| Total | 25 | 100.0% |
School Enrollment by Age by Funding Source in Allentown
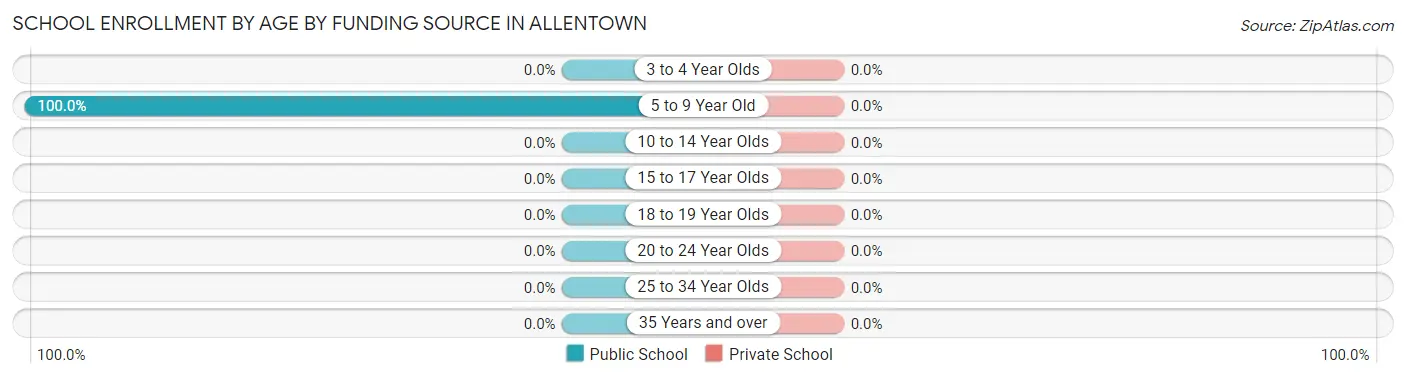
| Age Bracket | Public School | Private School |
| 3 to 4 Year Olds | 0 (0.0%) | 0 (0.0%) |
| 5 to 9 Year Old | 25 (100.0%) | 0 (0.0%) |
| 10 to 14 Year Olds | 0 (0.0%) | 0 (0.0%) |
| 15 to 17 Year Olds | 0 (0.0%) | 0 (0.0%) |
| 18 to 19 Year Olds | 0 (0.0%) | 0 (0.0%) |
| 20 to 24 Year Olds | 0 (0.0%) | 0 (0.0%) |
| 25 to 34 Year Olds | 0 (0.0%) | 0 (0.0%) |
| 35 Years and over | 0 (0.0%) | 0 (0.0%) |
| Total | 25 (100.0%) | 0 (0.0%) |
Educational Attainment by Field of Study in Allentown
Arts & humanities (11 | 57.9%), science & technology (5 | 26.3%), and psychology (3 | 15.8%) are the most common fields of study among 19 individuals in Allentown who have obtained a bachelor's degree or higher.
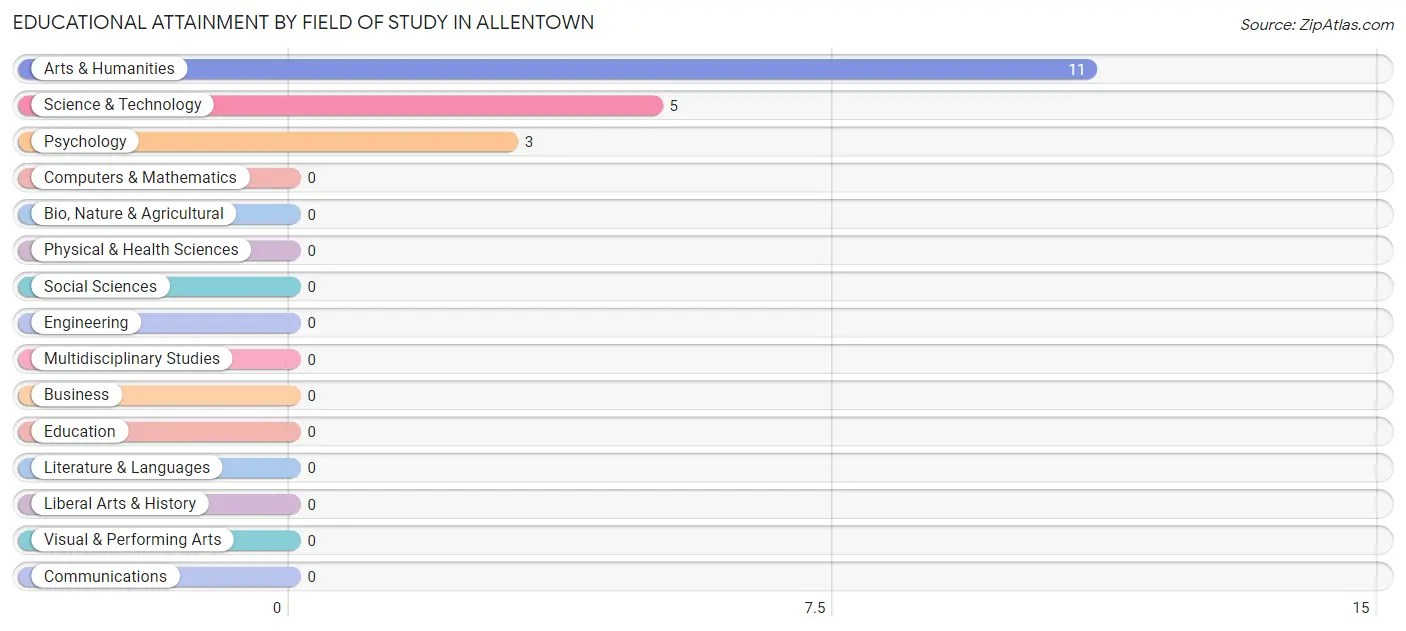
| Field of Study | # Graduates | % Graduates |
| Computers & Mathematics | 0 | 0.0% |
| Bio, Nature & Agricultural | 0 | 0.0% |
| Physical & Health Sciences | 0 | 0.0% |
| Psychology | 3 | 15.8% |
| Social Sciences | 0 | 0.0% |
| Engineering | 0 | 0.0% |
| Multidisciplinary Studies | 0 | 0.0% |
| Science & Technology | 5 | 26.3% |
| Business | 0 | 0.0% |
| Education | 0 | 0.0% |
| Literature & Languages | 0 | 0.0% |
| Liberal Arts & History | 0 | 0.0% |
| Visual & Performing Arts | 0 | 0.0% |
| Communications | 0 | 0.0% |
| Arts & Humanities | 11 | 57.9% |
| Total | 19 | 100.0% |
Transportation & Commute in Allentown
Vehicle Availability by Sex in Allentown
The most prevalent vehicle ownership categories in Allentown are males with 2 vehicles (21, accounting for 46.7%) and females with 2 vehicles (4, making up 123.5%).
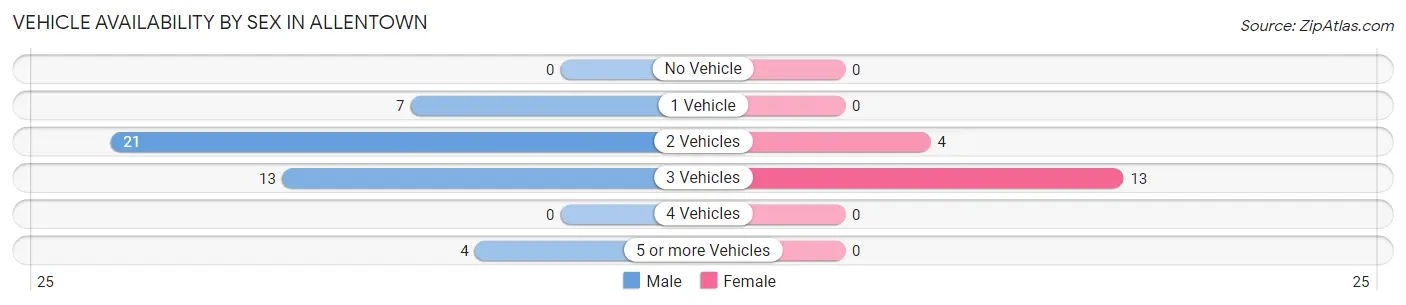
| Vehicles Available | Male | Female |
| No Vehicle | 0 (0.0%) | 0 (0.0%) |
| 1 Vehicle | 7 (15.6%) | 0 (0.0%) |
| 2 Vehicles | 21 (46.7%) | 4 (23.5%) |
| 3 Vehicles | 13 (28.9%) | 13 (76.5%) |
| 4 Vehicles | 0 (0.0%) | 0 (0.0%) |
| 5 or more Vehicles | 4 (8.9%) | 0 (0.0%) |
| Total | 45 (100.0%) | 17 (100.0%) |
Commute Time in Allentown
The most frequently occuring commute durations in Allentown are less than 5 minutes (18 commuters, 32.1%), 20 to 24 minutes (15 commuters, 26.8%), and 25 to 29 minutes (10 commuters, 17.9%).
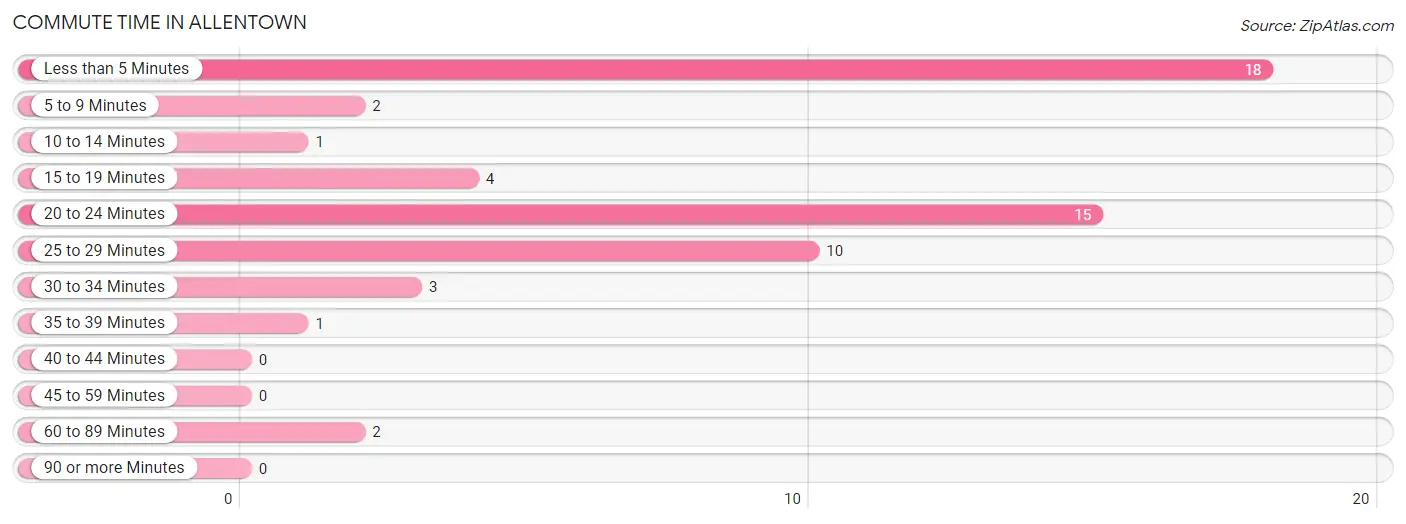
| Commute Time | # Commuters | % Commuters |
| Less than 5 Minutes | 18 | 32.1% |
| 5 to 9 Minutes | 2 | 3.6% |
| 10 to 14 Minutes | 1 | 1.8% |
| 15 to 19 Minutes | 4 | 7.1% |
| 20 to 24 Minutes | 15 | 26.8% |
| 25 to 29 Minutes | 10 | 17.9% |
| 30 to 34 Minutes | 3 | 5.4% |
| 35 to 39 Minutes | 1 | 1.8% |
| 40 to 44 Minutes | 0 | 0.0% |
| 45 to 59 Minutes | 0 | 0.0% |
| 60 to 89 Minutes | 2 | 3.6% |
| 90 or more Minutes | 0 | 0.0% |
Commute Time by Sex in Allentown
The most common commute times in Allentown are 20 to 24 minutes (15 commuters, 35.7%) for males and 25 to 29 minutes (6 commuters, 42.9%) for females.
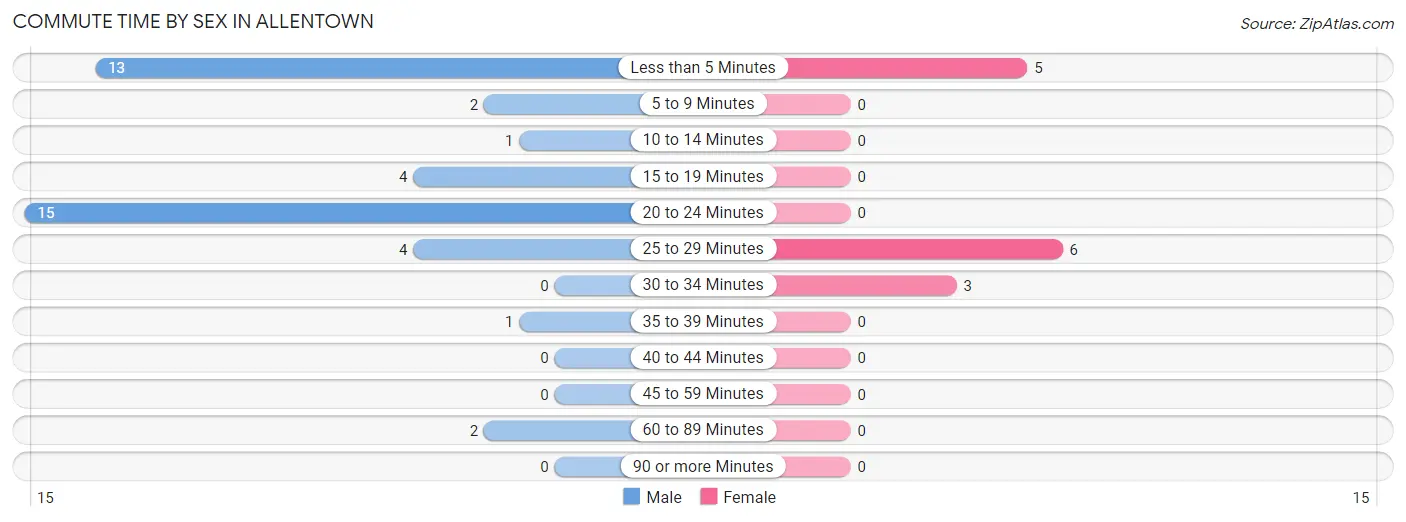
| Commute Time | Male | Female |
| Less than 5 Minutes | 13 (30.9%) | 5 (35.7%) |
| 5 to 9 Minutes | 2 (4.8%) | 0 (0.0%) |
| 10 to 14 Minutes | 1 (2.4%) | 0 (0.0%) |
| 15 to 19 Minutes | 4 (9.5%) | 0 (0.0%) |
| 20 to 24 Minutes | 15 (35.7%) | 0 (0.0%) |
| 25 to 29 Minutes | 4 (9.5%) | 6 (42.9%) |
| 30 to 34 Minutes | 0 (0.0%) | 3 (21.4%) |
| 35 to 39 Minutes | 1 (2.4%) | 0 (0.0%) |
| 40 to 44 Minutes | 0 (0.0%) | 0 (0.0%) |
| 45 to 59 Minutes | 0 (0.0%) | 0 (0.0%) |
| 60 to 89 Minutes | 2 (4.8%) | 0 (0.0%) |
| 90 or more Minutes | 0 (0.0%) | 0 (0.0%) |
Time of Departure to Work by Sex in Allentown
The most frequent times of departure to work in Allentown are 6:00 AM to 6:29 AM (12, 28.6%) for males and 7:00 AM to 7:29 AM (8, 57.1%) for females.
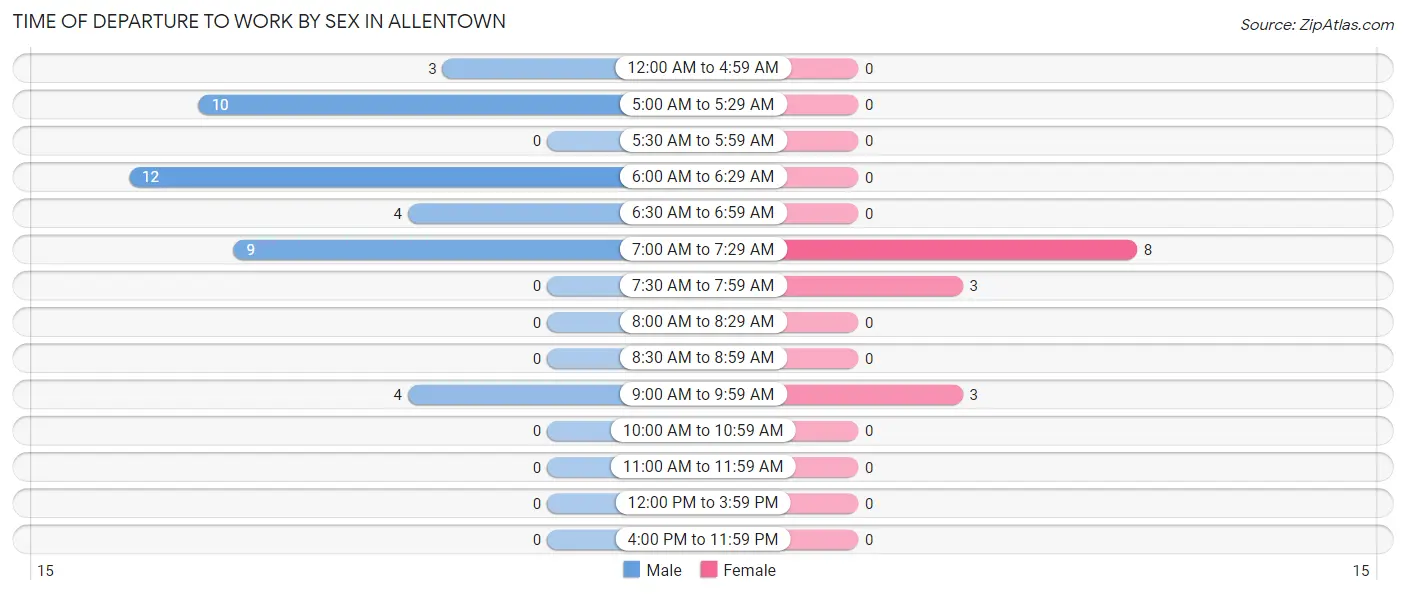
| Time of Departure | Male | Female |
| 12:00 AM to 4:59 AM | 3 (7.1%) | 0 (0.0%) |
| 5:00 AM to 5:29 AM | 10 (23.8%) | 0 (0.0%) |
| 5:30 AM to 5:59 AM | 0 (0.0%) | 0 (0.0%) |
| 6:00 AM to 6:29 AM | 12 (28.6%) | 0 (0.0%) |
| 6:30 AM to 6:59 AM | 4 (9.5%) | 0 (0.0%) |
| 7:00 AM to 7:29 AM | 9 (21.4%) | 8 (57.1%) |
| 7:30 AM to 7:59 AM | 0 (0.0%) | 3 (21.4%) |
| 8:00 AM to 8:29 AM | 0 (0.0%) | 0 (0.0%) |
| 8:30 AM to 8:59 AM | 0 (0.0%) | 0 (0.0%) |
| 9:00 AM to 9:59 AM | 4 (9.5%) | 3 (21.4%) |
| 10:00 AM to 10:59 AM | 0 (0.0%) | 0 (0.0%) |
| 11:00 AM to 11:59 AM | 0 (0.0%) | 0 (0.0%) |
| 12:00 PM to 3:59 PM | 0 (0.0%) | 0 (0.0%) |
| 4:00 PM to 11:59 PM | 0 (0.0%) | 0 (0.0%) |
| Total | 42 (100.0%) | 14 (100.0%) |
Housing Occupancy in Allentown
Occupancy by Ownership in Allentown
Of the total 91 dwellings in Allentown, owner-occupied units account for 87 (95.6%), while renter-occupied units make up 4 (4.4%).
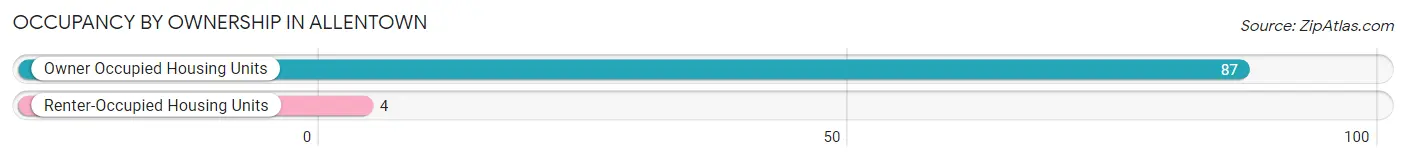
| Occupancy | # Housing Units | % Housing Units |
| Owner Occupied Housing Units | 87 | 95.6% |
| Renter-Occupied Housing Units | 4 | 4.4% |
| Total Occupied Housing Units | 91 | 100.0% |
Occupancy by Household Size in Allentown
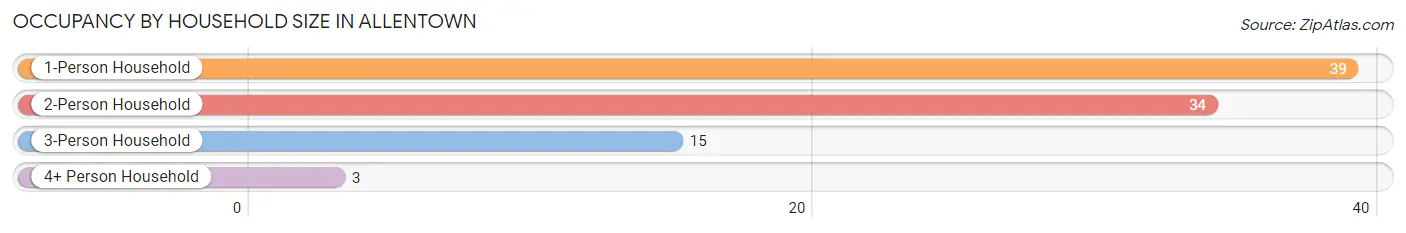
| Household Size | # Housing Units | % Housing Units |
| 1-Person Household | 39 | 42.9% |
| 2-Person Household | 34 | 37.4% |
| 3-Person Household | 15 | 16.5% |
| 4+ Person Household | 3 | 3.3% |
| Total Housing Units | 91 | 100.0% |
Occupancy by Ownership by Household Size in Allentown
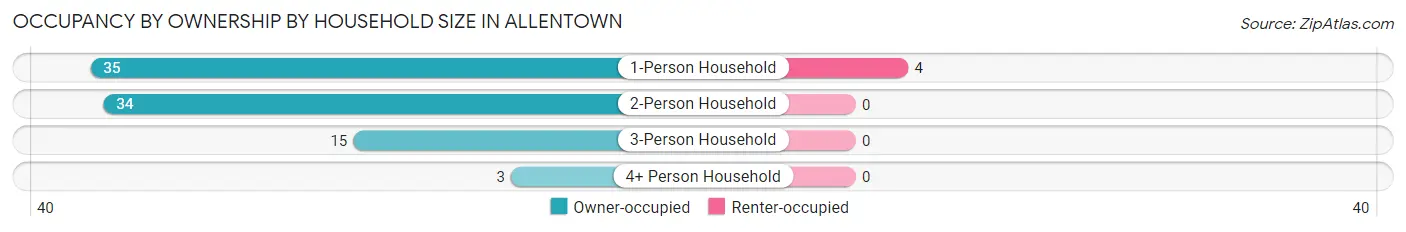
| Household Size | Owner-occupied | Renter-occupied |
| 1-Person Household | 35 (89.7%) | 4 (10.3%) |
| 2-Person Household | 34 (100.0%) | 0 (0.0%) |
| 3-Person Household | 15 (100.0%) | 0 (0.0%) |
| 4+ Person Household | 3 (100.0%) | 0 (0.0%) |
| Total Housing Units | 87 (95.6%) | 4 (4.4%) |
Occupancy by Educational Attainment in Allentown
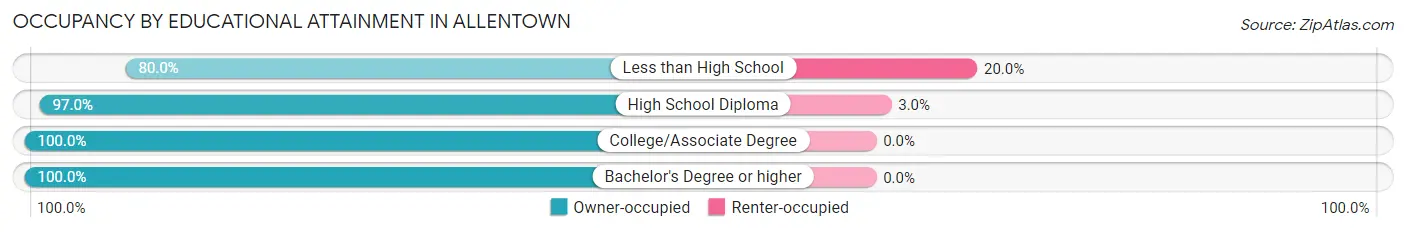
| Household Size | Owner-occupied | Renter-occupied |
| Less than High School | 8 (80.0%) | 2 (20.0%) |
| High School Diploma | 65 (97.0%) | 2 (3.0%) |
| College/Associate Degree | 6 (100.0%) | 0 (0.0%) |
| Bachelor's Degree or higher | 8 (100.0%) | 0 (0.0%) |
Occupancy by Age of Householder in Allentown
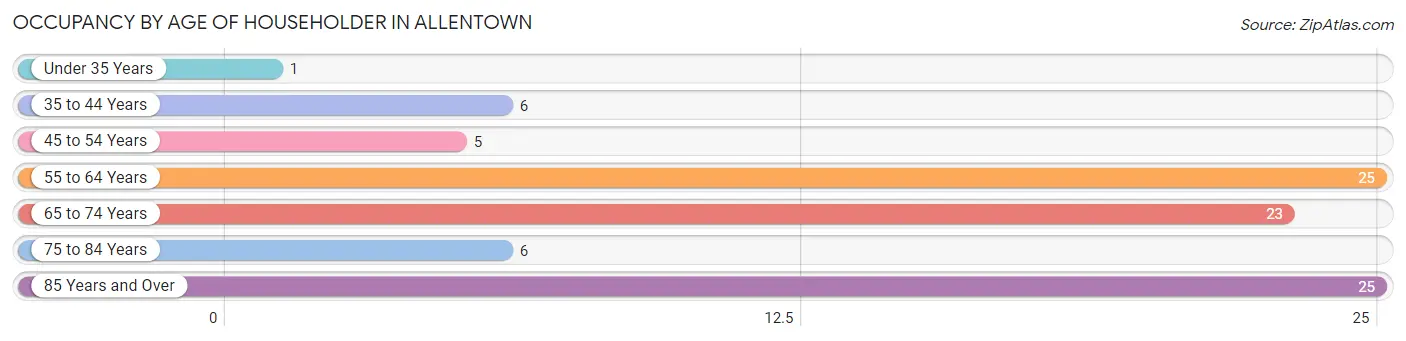
| Age Bracket | # Households | % Households |
| Under 35 Years | 1 | 1.1% |
| 35 to 44 Years | 6 | 6.6% |
| 45 to 54 Years | 5 | 5.5% |
| 55 to 64 Years | 25 | 27.5% |
| 65 to 74 Years | 23 | 25.3% |
| 75 to 84 Years | 6 | 6.6% |
| 85 Years and Over | 25 | 27.5% |
| Total | 91 | 100.0% |
Housing Finances in Allentown
Median Income by Occupancy in Allentown
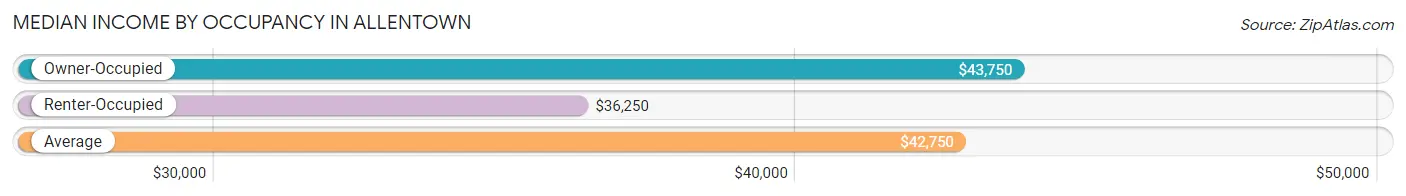
| Occupancy Type | # Households | Median Income |
| Owner-Occupied | 87 (95.6%) | $43,750 |
| Renter-Occupied | 4 (4.4%) | $36,250 |
| Average | 91 (100.0%) | $42,750 |
Occupancy by Householder Income Bracket in Allentown
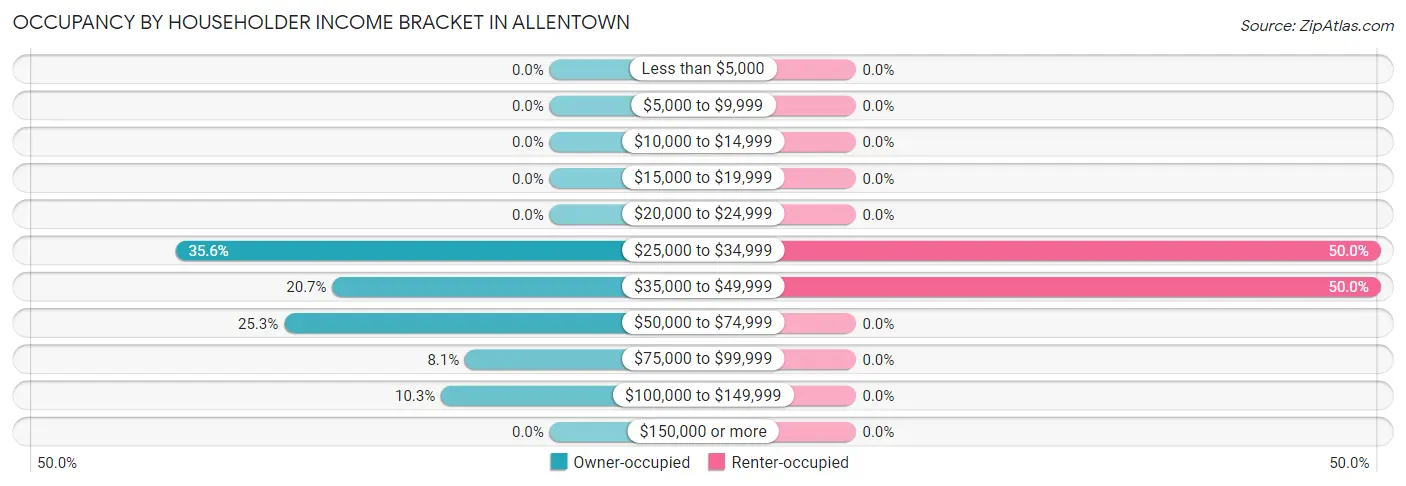
| Income Bracket | Owner-occupied | Renter-occupied |
| Less than $5,000 | 0 (0.0%) | 0 (0.0%) |
| $5,000 to $9,999 | 0 (0.0%) | 0 (0.0%) |
| $10,000 to $14,999 | 0 (0.0%) | 0 (0.0%) |
| $15,000 to $19,999 | 0 (0.0%) | 0 (0.0%) |
| $20,000 to $24,999 | 0 (0.0%) | 0 (0.0%) |
| $25,000 to $34,999 | 31 (35.6%) | 2 (50.0%) |
| $35,000 to $49,999 | 18 (20.7%) | 2 (50.0%) |
| $50,000 to $74,999 | 22 (25.3%) | 0 (0.0%) |
| $75,000 to $99,999 | 7 (8.1%) | 0 (0.0%) |
| $100,000 to $149,999 | 9 (10.3%) | 0 (0.0%) |
| $150,000 or more | 0 (0.0%) | 0 (0.0%) |
| Total | 87 (100.0%) | 4 (100.0%) |
Monthly Housing Cost Tiers in Allentown
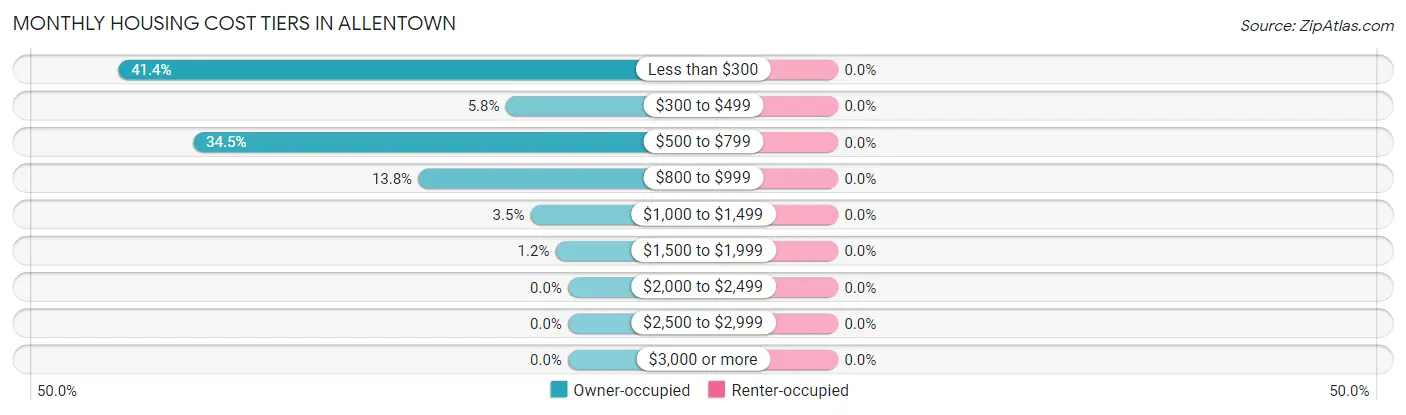
| Monthly Cost | Owner-occupied | Renter-occupied |
| Less than $300 | 36 (41.4%) | 0 (0.0%) |
| $300 to $499 | 5 (5.8%) | 0 (0.0%) |
| $500 to $799 | 30 (34.5%) | 0 (0.0%) |
| $800 to $999 | 12 (13.8%) | 0 (0.0%) |
| $1,000 to $1,499 | 3 (3.5%) | 0 (0.0%) |
| $1,500 to $1,999 | 1 (1.1%) | 0 (0.0%) |
| $2,000 to $2,499 | 0 (0.0%) | 0 (0.0%) |
| $2,500 to $2,999 | 0 (0.0%) | 0 (0.0%) |
| $3,000 or more | 0 (0.0%) | 0 (0.0%) |
| Total | 87 (100.0%) | 4 (100.0%) |
Physical Housing Characteristics in Allentown
Housing Structures in Allentown
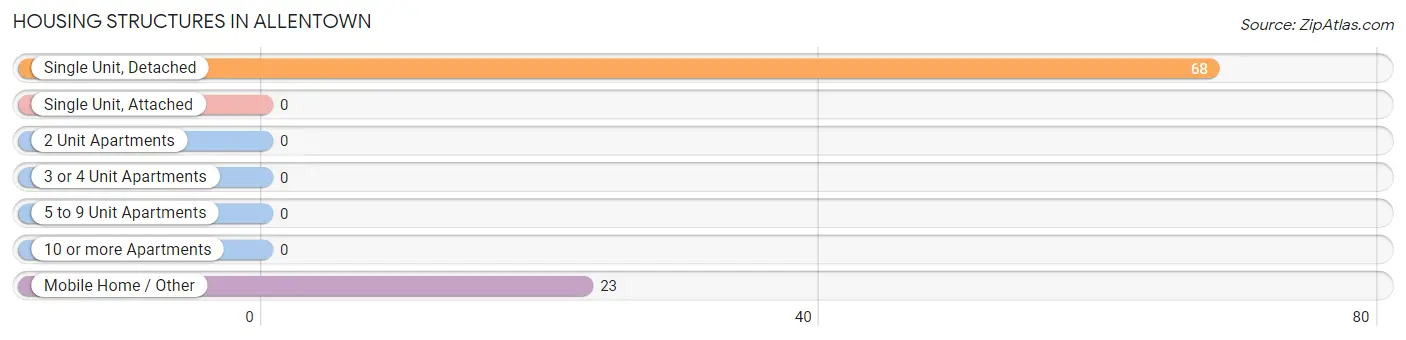
| Structure Type | # Housing Units | % Housing Units |
| Single Unit, Detached | 68 | 74.7% |
| Single Unit, Attached | 0 | 0.0% |
| 2 Unit Apartments | 0 | 0.0% |
| 3 or 4 Unit Apartments | 0 | 0.0% |
| 5 to 9 Unit Apartments | 0 | 0.0% |
| 10 or more Apartments | 0 | 0.0% |
| Mobile Home / Other | 23 | 25.3% |
| Total | 91 | 100.0% |
Housing Structures by Occupancy in Allentown
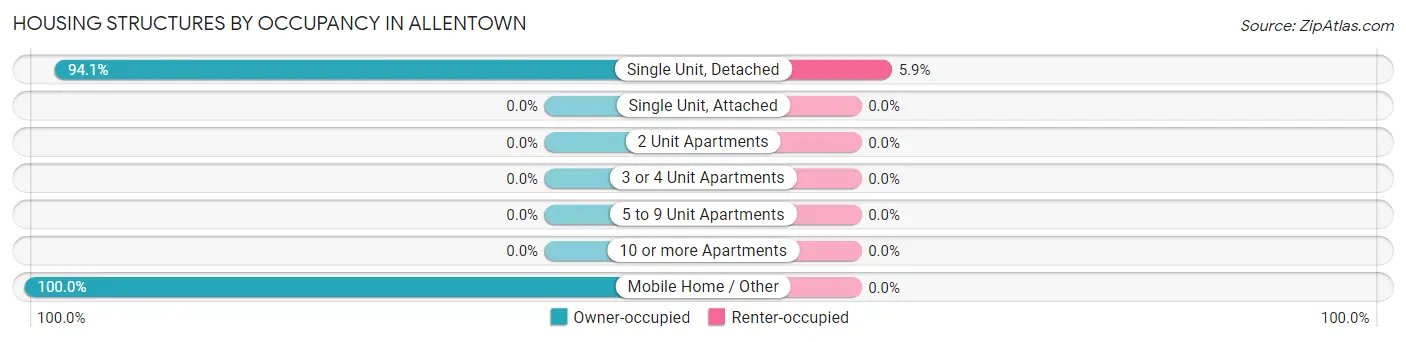
| Structure Type | Owner-occupied | Renter-occupied |
| Single Unit, Detached | 64 (94.1%) | 4 (5.9%) |
| Single Unit, Attached | 0 (0.0%) | 0 (0.0%) |
| 2 Unit Apartments | 0 (0.0%) | 0 (0.0%) |
| 3 or 4 Unit Apartments | 0 (0.0%) | 0 (0.0%) |
| 5 to 9 Unit Apartments | 0 (0.0%) | 0 (0.0%) |
| 10 or more Apartments | 0 (0.0%) | 0 (0.0%) |
| Mobile Home / Other | 23 (100.0%) | 0 (0.0%) |
| Total | 87 (95.6%) | 4 (4.4%) |
Housing Structures by Number of Rooms in Allentown
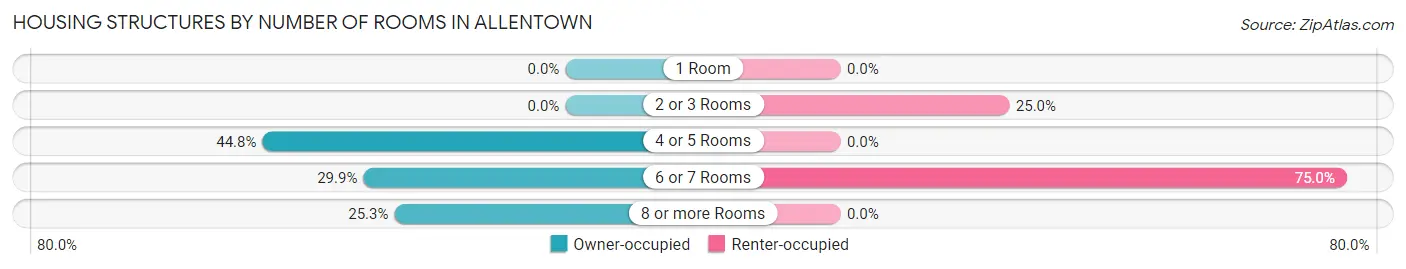
| Number of Rooms | Owner-occupied | Renter-occupied |
| 1 Room | 0 (0.0%) | 0 (0.0%) |
| 2 or 3 Rooms | 0 (0.0%) | 1 (25.0%) |
| 4 or 5 Rooms | 39 (44.8%) | 0 (0.0%) |
| 6 or 7 Rooms | 26 (29.9%) | 3 (75.0%) |
| 8 or more Rooms | 22 (25.3%) | 0 (0.0%) |
| Total | 87 (100.0%) | 4 (100.0%) |
Housing Structure by Heating Type in Allentown
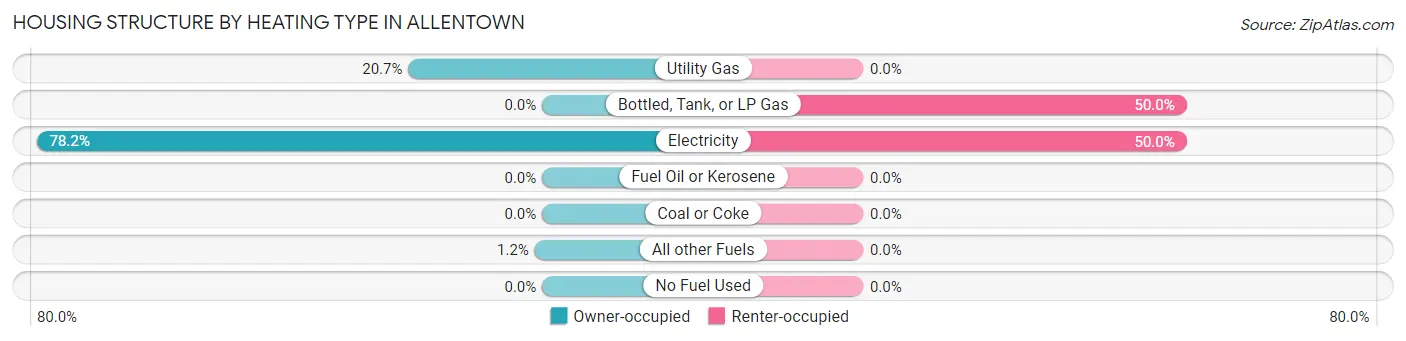
| Heating Type | Owner-occupied | Renter-occupied |
| Utility Gas | 18 (20.7%) | 0 (0.0%) |
| Bottled, Tank, or LP Gas | 0 (0.0%) | 2 (50.0%) |
| Electricity | 68 (78.2%) | 2 (50.0%) |
| Fuel Oil or Kerosene | 0 (0.0%) | 0 (0.0%) |
| Coal or Coke | 0 (0.0%) | 0 (0.0%) |
| All other Fuels | 1 (1.1%) | 0 (0.0%) |
| No Fuel Used | 0 (0.0%) | 0 (0.0%) |
| Total | 87 (100.0%) | 4 (100.0%) |
Household Vehicle Usage in Allentown
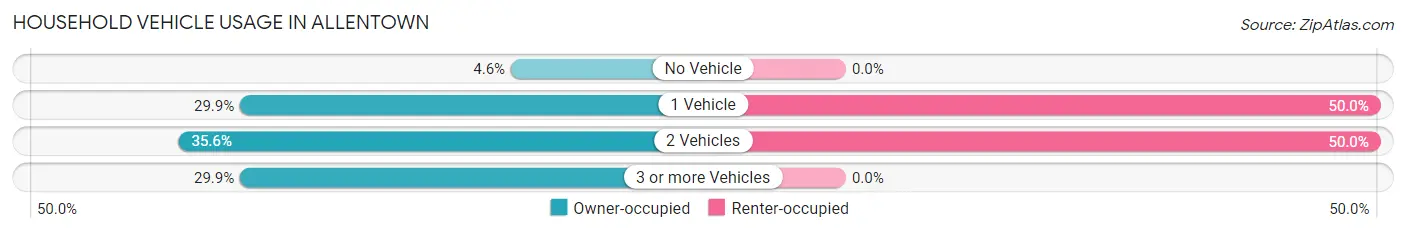
| Vehicles per Household | Owner-occupied | Renter-occupied |
| No Vehicle | 4 (4.6%) | 0 (0.0%) |
| 1 Vehicle | 26 (29.9%) | 2 (50.0%) |
| 2 Vehicles | 31 (35.6%) | 2 (50.0%) |
| 3 or more Vehicles | 26 (29.9%) | 0 (0.0%) |
| Total | 87 (100.0%) | 4 (100.0%) |
Real Estate & Mortgages in Allentown
Real Estate and Mortgage Overview in Allentown
| Characteristic | Without Mortgage | With Mortgage |
| Housing Units | 74 | 13 |
| Median Property Value | - | - |
| Median Household Income | $41,250 | $0 |
| Monthly Housing Costs | $400 | $0 |
| Real Estate Taxes | - | - |
Property Value by Mortgage Status in Allentown
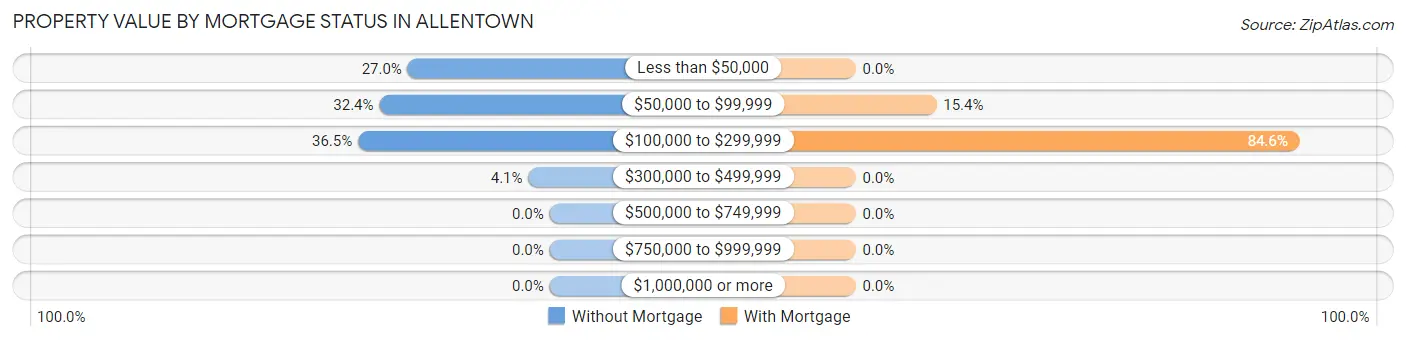
| Property Value | Without Mortgage | With Mortgage |
| Less than $50,000 | 20 (27.0%) | 0 (0.0%) |
| $50,000 to $99,999 | 24 (32.4%) | 2 (15.4%) |
| $100,000 to $299,999 | 27 (36.5%) | 11 (84.6%) |
| $300,000 to $499,999 | 3 (4.1%) | 0 (0.0%) |
| $500,000 to $749,999 | 0 (0.0%) | 0 (0.0%) |
| $750,000 to $999,999 | 0 (0.0%) | 0 (0.0%) |
| $1,000,000 or more | 0 (0.0%) | 0 (0.0%) |
| Total | 74 (100.0%) | 13 (100.0%) |
Household Income by Mortgage Status in Allentown
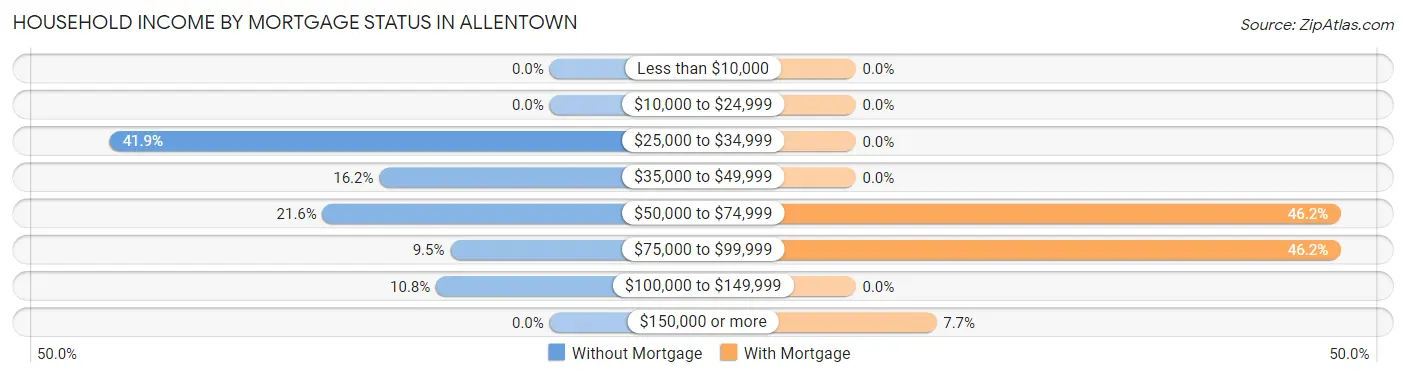
| Household Income | Without Mortgage | With Mortgage |
| Less than $10,000 | 0 (0.0%) | 0 (0.0%) |
| $10,000 to $24,999 | 0 (0.0%) | 0 (0.0%) |
| $25,000 to $34,999 | 31 (41.9%) | 0 (0.0%) |
| $35,000 to $49,999 | 12 (16.2%) | 0 (0.0%) |
| $50,000 to $74,999 | 16 (21.6%) | 6 (46.2%) |
| $75,000 to $99,999 | 7 (9.5%) | 6 (46.2%) |
| $100,000 to $149,999 | 8 (10.8%) | 0 (0.0%) |
| $150,000 or more | 0 (0.0%) | 1 (7.7%) |
| Total | 74 (100.0%) | 13 (100.0%) |
Property Value to Household Income Ratio in Allentown
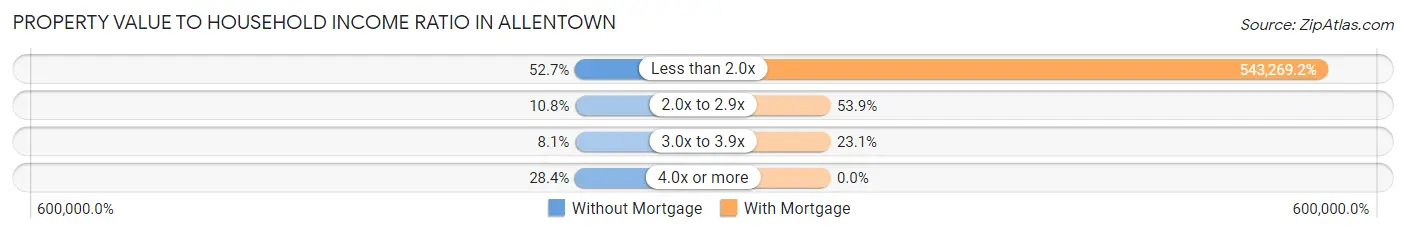
| Value-to-Income Ratio | Without Mortgage | With Mortgage |
| Less than 2.0x | 39 (52.7%) | 70,625 (543,269.2%) |
| 2.0x to 2.9x | 8 (10.8%) | 7 (53.8%) |
| 3.0x to 3.9x | 6 (8.1%) | 3 (23.1%) |
| 4.0x or more | 21 (28.4%) | 0 (0.0%) |
| Total | 74 (100.0%) | 13 (100.0%) |
Real Estate Taxes by Mortgage Status in Allentown
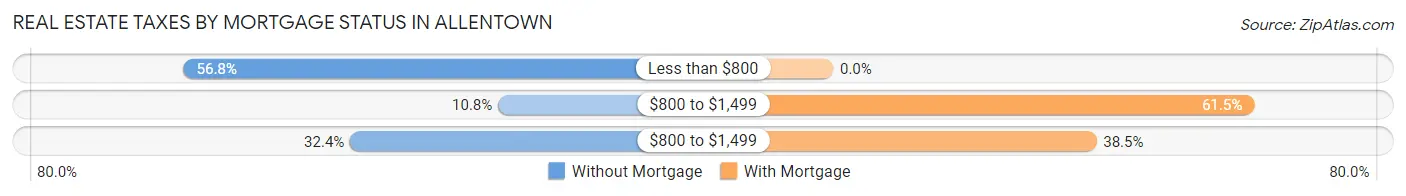
| Property Taxes | Without Mortgage | With Mortgage |
| Less than $800 | 42 (56.8%) | 0 (0.0%) |
| $800 to $1,499 | 8 (10.8%) | 8 (61.5%) |
| $800 to $1,499 | 24 (32.4%) | 5 (38.5%) |
| Total | 74 (100.0%) | 13 (100.0%) |
Health & Disability in Allentown
Health Insurance Coverage by Age in Allentown
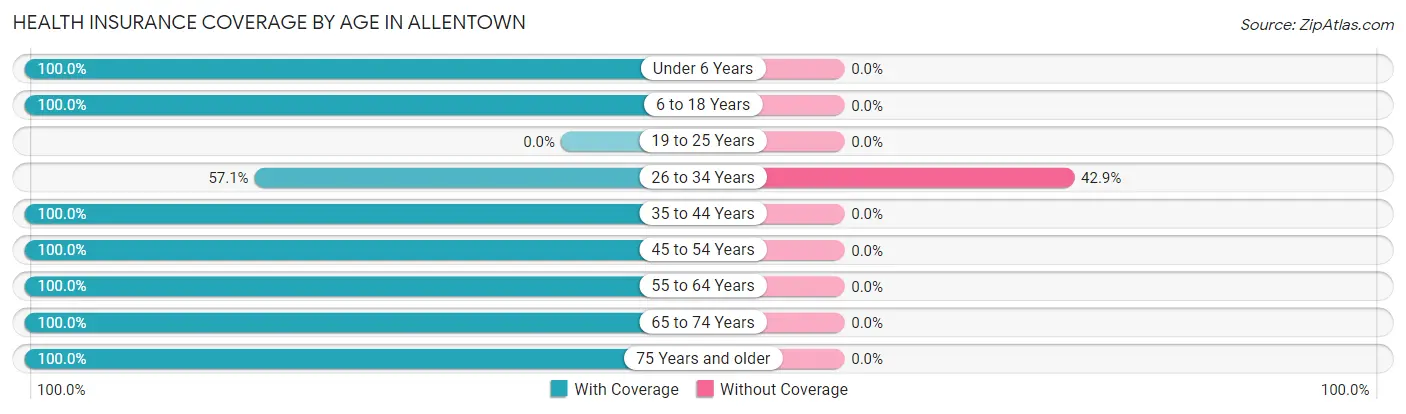
| Age Bracket | With Coverage | Without Coverage |
| Under 6 Years | 10 (100.0%) | 0 (0.0%) |
| 6 to 18 Years | 35 (100.0%) | 0 (0.0%) |
| 19 to 25 Years | 0 (0.0%) | 0 (0.0%) |
| 26 to 34 Years | 4 (57.1%) | 3 (42.9%) |
| 35 to 44 Years | 11 (100.0%) | 0 (0.0%) |
| 45 to 54 Years | 5 (100.0%) | 0 (0.0%) |
| 55 to 64 Years | 34 (100.0%) | 0 (0.0%) |
| 65 to 74 Years | 43 (100.0%) | 0 (0.0%) |
| 75 Years and older | 59 (100.0%) | 0 (0.0%) |
| Total | 201 (98.5%) | 3 (1.5%) |
Health Insurance Coverage by Citizenship Status in Allentown

| Citizenship Status | With Coverage | Without Coverage |
| Native Born | 10 (100.0%) | 0 (0.0%) |
| Foreign Born, Citizen | 35 (100.0%) | 0 (0.0%) |
| Foreign Born, not a Citizen | 0 (0.0%) | 0 (0.0%) |
Health Insurance Coverage by Household Income in Allentown
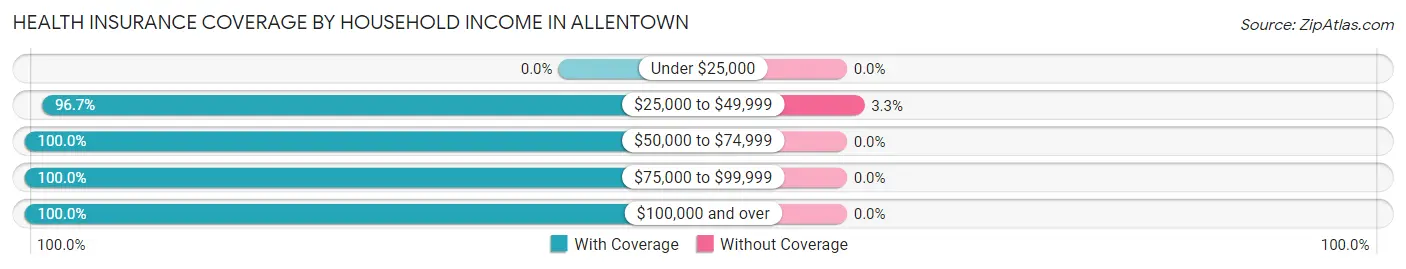
| Household Income | With Coverage | Without Coverage |
| Under $25,000 | 0 (0.0%) | 0 (0.0%) |
| $25,000 to $49,999 | 89 (96.7%) | 3 (3.3%) |
| $50,000 to $74,999 | 47 (100.0%) | 0 (0.0%) |
| $75,000 to $99,999 | 29 (100.0%) | 0 (0.0%) |
| $100,000 and over | 36 (100.0%) | 0 (0.0%) |
Public vs Private Health Insurance Coverage by Age in Allentown
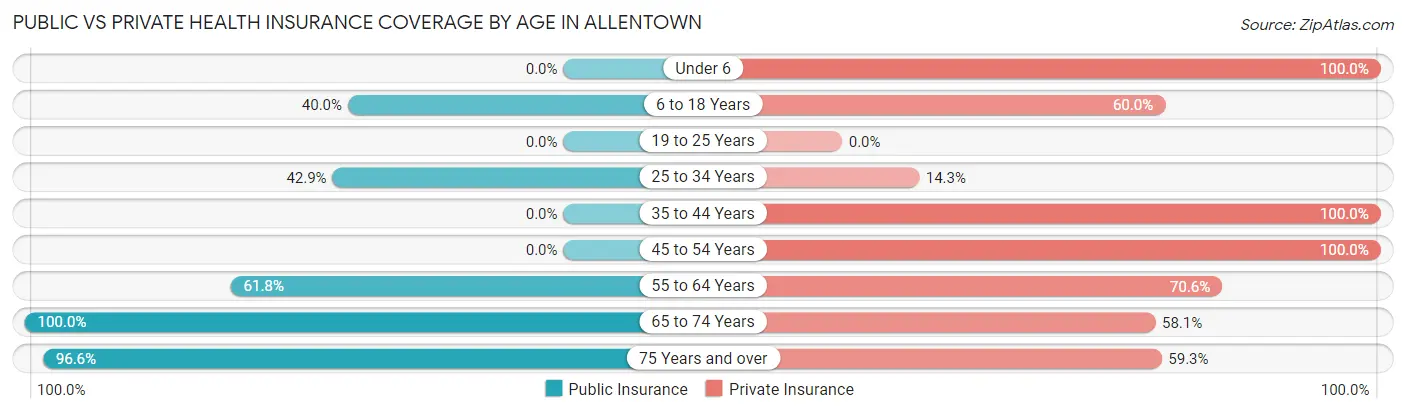
| Age Bracket | Public Insurance | Private Insurance |
| Under 6 | 0 (0.0%) | 10 (100.0%) |
| 6 to 18 Years | 14 (40.0%) | 21 (60.0%) |
| 19 to 25 Years | 0 (0.0%) | 0 (0.0%) |
| 25 to 34 Years | 3 (42.9%) | 1 (14.3%) |
| 35 to 44 Years | 0 (0.0%) | 11 (100.0%) |
| 45 to 54 Years | 0 (0.0%) | 5 (100.0%) |
| 55 to 64 Years | 21 (61.8%) | 24 (70.6%) |
| 65 to 74 Years | 43 (100.0%) | 25 (58.1%) |
| 75 Years and over | 57 (96.6%) | 35 (59.3%) |
| Total | 138 (67.6%) | 132 (64.7%) |
Disability Status by Sex by Age in Allentown
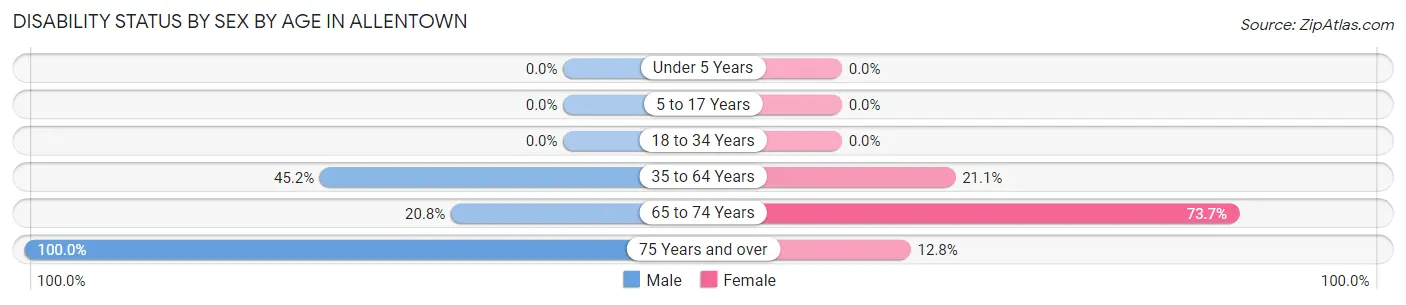
| Age Bracket | Male | Female |
| Under 5 Years | 0 (0.0%) | 0 (0.0%) |
| 5 to 17 Years | 0 (0.0%) | 0 (0.0%) |
| 18 to 34 Years | 0 (0.0%) | 0 (0.0%) |
| 35 to 64 Years | 14 (45.2%) | 4 (21.0%) |
| 65 to 74 Years | 5 (20.8%) | 14 (73.7%) |
| 75 Years and over | 12 (100.0%) | 6 (12.8%) |
Disability Class by Sex by Age in Allentown
Disability Class: Hearing Difficulty
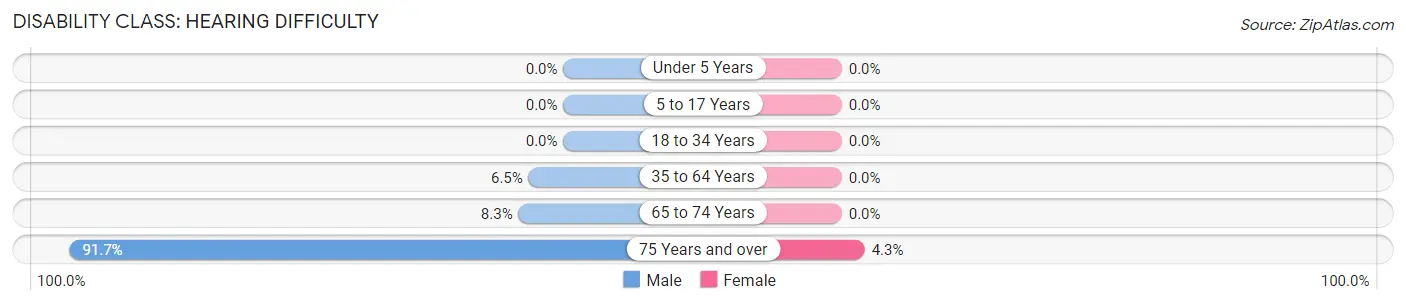
| Age Bracket | Male | Female |
| Under 5 Years | 0 (0.0%) | 0 (0.0%) |
| 5 to 17 Years | 0 (0.0%) | 0 (0.0%) |
| 18 to 34 Years | 0 (0.0%) | 0 (0.0%) |
| 35 to 64 Years | 2 (6.5%) | 0 (0.0%) |
| 65 to 74 Years | 2 (8.3%) | 0 (0.0%) |
| 75 Years and over | 11 (91.7%) | 2 (4.3%) |
Disability Class: Vision Difficulty
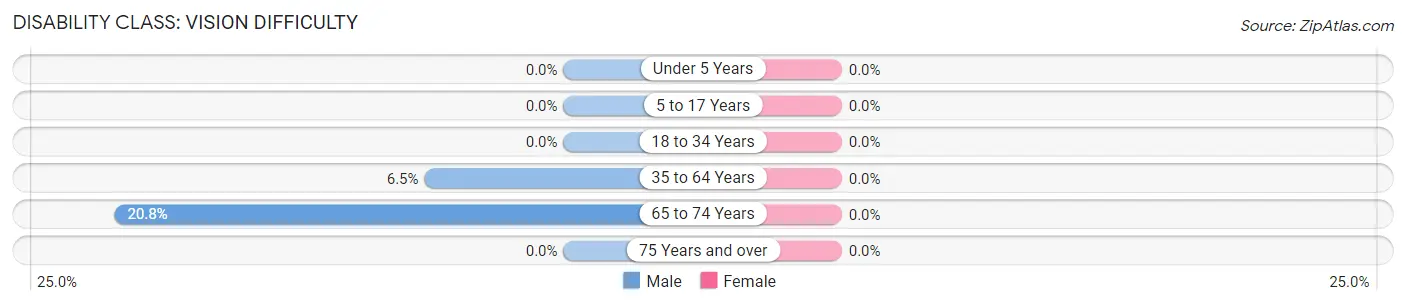
| Age Bracket | Male | Female |
| Under 5 Years | 0 (0.0%) | 0 (0.0%) |
| 5 to 17 Years | 0 (0.0%) | 0 (0.0%) |
| 18 to 34 Years | 0 (0.0%) | 0 (0.0%) |
| 35 to 64 Years | 2 (6.5%) | 0 (0.0%) |
| 65 to 74 Years | 5 (20.8%) | 0 (0.0%) |
| 75 Years and over | 0 (0.0%) | 0 (0.0%) |
Disability Class: Cognitive Difficulty
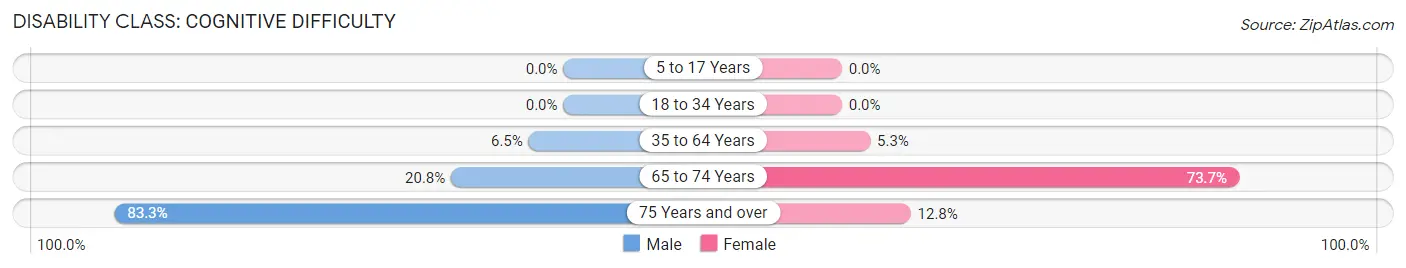
| Age Bracket | Male | Female |
| 5 to 17 Years | 0 (0.0%) | 0 (0.0%) |
| 18 to 34 Years | 0 (0.0%) | 0 (0.0%) |
| 35 to 64 Years | 2 (6.5%) | 1 (5.3%) |
| 65 to 74 Years | 5 (20.8%) | 14 (73.7%) |
| 75 Years and over | 10 (83.3%) | 6 (12.8%) |
Disability Class: Ambulatory Difficulty
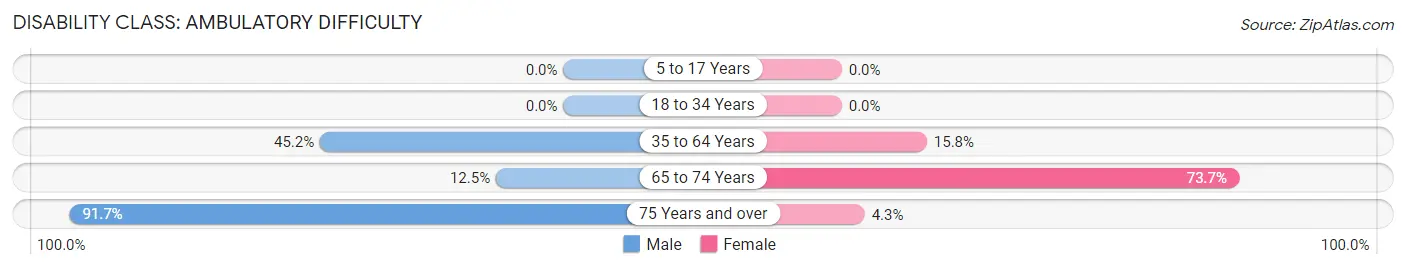
| Age Bracket | Male | Female |
| 5 to 17 Years | 0 (0.0%) | 0 (0.0%) |
| 18 to 34 Years | 0 (0.0%) | 0 (0.0%) |
| 35 to 64 Years | 14 (45.2%) | 3 (15.8%) |
| 65 to 74 Years | 3 (12.5%) | 14 (73.7%) |
| 75 Years and over | 11 (91.7%) | 2 (4.3%) |
Disability Class: Self-Care Difficulty
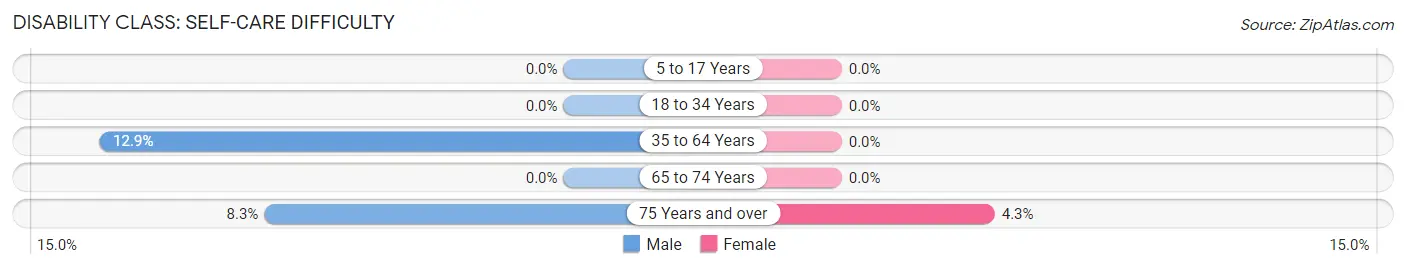
| Age Bracket | Male | Female |
| 5 to 17 Years | 0 (0.0%) | 0 (0.0%) |
| 18 to 34 Years | 0 (0.0%) | 0 (0.0%) |
| 35 to 64 Years | 4 (12.9%) | 0 (0.0%) |
| 65 to 74 Years | 0 (0.0%) | 0 (0.0%) |
| 75 Years and over | 1 (8.3%) | 2 (4.3%) |
Technology Access in Allentown
Computing Device Access in Allentown
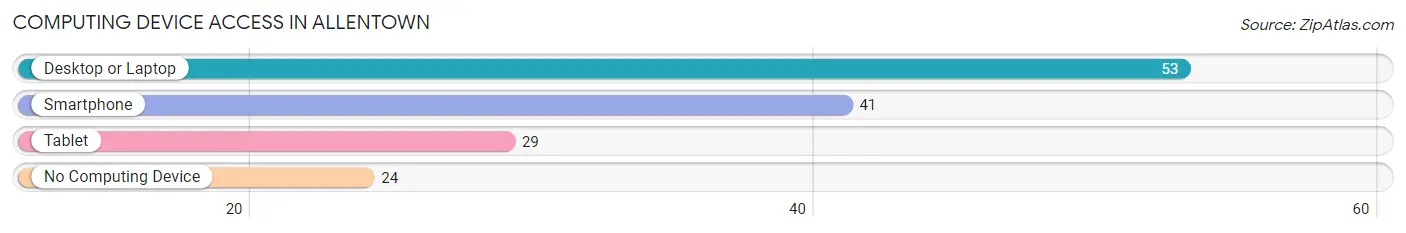
| Device Type | # Households | % Households |
| Desktop or Laptop | 53 | 58.2% |
| Smartphone | 41 | 45.1% |
| Tablet | 29 | 31.9% |
| No Computing Device | 24 | 26.4% |
| Total | 91 | 100.0% |
Internet Access in Allentown
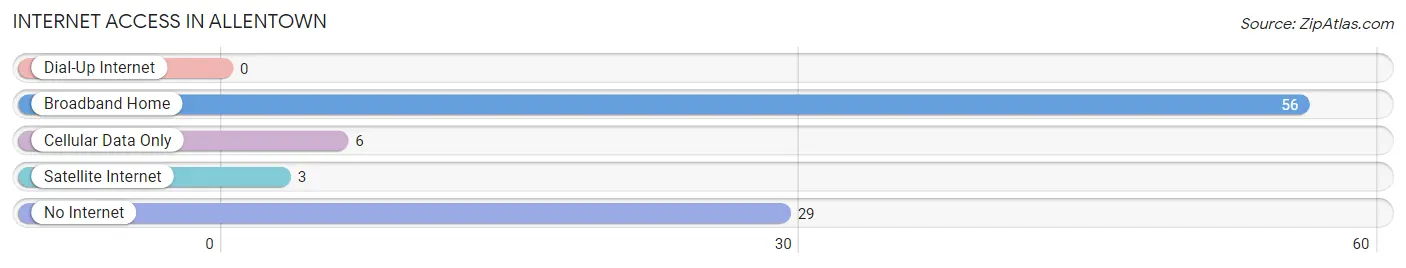
| Internet Type | # Households | % Households |
| Dial-Up Internet | 0 | 0.0% |
| Broadband Home | 56 | 61.5% |
| Cellular Data Only | 6 | 6.6% |
| Satellite Internet | 3 | 3.3% |
| No Internet | 29 | 31.9% |
| Total | 91 | 100.0% |
Allentown Summary
Allentown, Georgia is a small town located in the southeastern corner of the state, in Bulloch County. It is situated on the banks of the Ogeechee River, and is home to a population of just over 1,000 people. Allentown is a rural community, with a strong agricultural heritage. The town is known for its small-town charm and friendly atmosphere, and is a popular destination for visitors looking to explore the area’s natural beauty.
History
Allentown was founded in 1820 by a group of settlers from South Carolina. The town was named after the Allens, a prominent family in the area. The town was originally a farming community, and the main crops grown were cotton, corn, and tobacco. In the late 19th century, the town began to grow and develop, and by the early 20th century, it had become a thriving commercial center.
In the early 1900s, Allentown was home to several businesses, including a cotton gin, a sawmill, a grist mill, and a general store. The town also had a post office, a bank, and a hotel. In the 1920s, the town was connected to the rest of the state by a railroad line, which allowed for increased trade and commerce.
Geography
Allentown is located in the southeastern corner of Bulloch County, Georgia. It is situated on the banks of the Ogeechee River, and is surrounded by a number of small towns and villages. The town is located approximately 30 miles from Savannah, Georgia, and is about an hour’s drive from the Georgia coast.
The town is situated in a rural area, and is surrounded by farmland and woodlands. The area is known for its natural beauty, and is home to a variety of wildlife, including deer, wild turkeys, and a variety of birds. The town is also home to a number of historic sites, including the Allentown Cemetery, which dates back to the early 1800s.
Economy
Allentown’s economy is largely based on agriculture. The town is home to a number of farms, which produce a variety of crops, including cotton, corn, and tobacco. The town also has a number of small businesses, including a general store, a hardware store, and a few restaurants.
The town is also home to a number of manufacturing companies, which produce a variety of products, including furniture, clothing, and textiles. The town is also home to a number of small businesses, including a gas station, a grocery store, and a few other retail stores.
Demographics
As of the 2010 census, Allentown had a population of 1,072 people. The town is predominantly white, with a small African American population. The median household income in the town is $37,500, and the median age is 39. The town has a high rate of poverty, with nearly 30% of the population living below the poverty line.
Allentown is a small town with a strong sense of community. The town is known for its friendly atmosphere and its commitment to preserving its rural heritage. The town is a popular destination for visitors looking to explore the area’s natural beauty, and is home to a number of historic sites. Allentown is a great place to live, work, and raise a family.
Common Questions
What is Per Capita Income in Allentown?
Per Capita income in Allentown is $25,092.
What is the Median Family Income in Allentown?
Median Family Income in Allentown is $56,429.
What is the Median Household income in Allentown?
Median Household Income in Allentown is $42,750.
What is Income or Wage Gap in Allentown?
Income or Wage Gap in Allentown is 46.1%.
Women in Allentown earn 53.9 cents for every dollar earned by a man.
What is Inequality or Gini Index in Allentown?
Inequality or Gini Index in Allentown is 0.29.
What is the Total Population of Allentown?
Total Population of Allentown is 204.
What is the Total Male Population of Allentown?
Total Male Population of Allentown is 100.
What is the Total Female Population of Allentown?
Total Female Population of Allentown is 104.
What is the Ratio of Males per 100 Females in Allentown?
There are 96.15 Males per 100 Females in Allentown.
What is the Ratio of Females per 100 Males in Allentown?
There are 104.00 Females per 100 Males in Allentown.
What is the Median Population Age in Allentown?
Median Population Age in Allentown is 65.0 Years.
What is the Average Family Size in Allentown
Average Family Size in Allentown is 2.8 People.
What is the Average Household Size in Allentown
Average Household Size in Allentown is 2.2 People.
How Large is the Labor Force in Allentown?
There are 64 People in the Labor Forcein in Allentown.
What is the Percentage of People in the Labor Force in Allentown?
37.9% of People are in the Labor Force in Allentown.
What is the Unemployment Rate in Allentown?
Unemployment Rate in Allentown is 3.1%.