Zip Codes with the Highest Percentage of Households with Income Above $100,000 in Lehigh Acres, FL

RELATED REPORTS & OPTIONS

Household Income | $100k+
Population
Families and Households
Female Fertility
Female Fertility (Unmarried)
Race (Community Size)
Race (Percentage)
Ancestry (Community Size)
AfricanAmericanArabArgentineanArmenianAustrianBahamianBarbadianBelgianBhutaneseBlackfeetBolivianBrazilianBritishBritish West IndianBurmeseCanadianCentral AmericanCentral American IndianCherokeeChileanChoctawColombianCosta RicanCroatianCubanCzechCzechoslovakianDanishDominicanDutchEastern EuropeanEcuadorianEnglishEuropeanFinnishFrenchFrench CanadianGermanGreekGuatemalanGuyaneseHaitianHonduranHungarianIndian (Asian)IrishItalianJamaicanKoreanLebaneseLithuanianMexicanMexican American IndianMoroccanNavajoNicaraguanNigerianNorwegianPakistaniPanamanianPennsylvania GermanPeruvianPolishPortuguesePuerto RicanRomanianRussianSalvadoranSamoanScandinavianScotch-IrishScottishSlavicSlovakSloveneSouth AmericanSpaniardSpanishSri LankanSubsaharan AfricanSwedishSwissThaiTrinidadian and TobagonianUkrainianUruguayanVenezuelanWelshWest Indian
Ancestry (Percentage)
AfricanAmericanArabArgentineanArmenianAustrianBahamianBarbadianBelgianBhutaneseBlackfeetBolivianBrazilianBritishBritish West IndianBurmeseCanadianCentral AmericanCentral American IndianCherokeeChileanChoctawColombianCosta RicanCroatianCubanCzechCzechoslovakianDanishDominicanDutchEastern EuropeanEcuadorianEnglishEuropeanFinnishFrenchFrench CanadianGermanGreekGuatemalanGuyaneseHaitianHonduranHungarianIndian (Asian)IrishItalianJamaicanKoreanLebaneseLithuanianMexicanMexican American IndianMoroccanNavajoNicaraguanNigerianNorwegianPakistaniPanamanianPennsylvania GermanPeruvianPolishPortuguesePuerto RicanRomanianRussianSalvadoranSamoanScandinavianScotch-IrishScottishSlavicSlovakSloveneSouth AmericanSpaniardSpanishSri LankanSubsaharan AfricanSwedishSwissThaiTrinidadian and TobagonianUkrainianUruguayanVenezuelanWelshWest Indian
Immigrant Origin (Total)
Immigrant Origin (Percentage)
Income
Income (Families)
Income (Households)
Poverty
Poverty (Families)
Unemployment
Employment Occupations
Employment Industries
Employer Class
Commute Time
Commute Means
School Enrollment
Education by Degree Field
Occupancy
Finances
Physical Characteristics
Lehigh Acres
States
Florida Cities
Altamonte SpringsApopkaArcadiaBoca RatonBonita SpringsBoynton BeachBradentonBrandonBrooksvilleCape CoralCasselberryClearwaterClermontCocoaCoral SpringsCrestviewCrystal RiverDade CityDavenportDaytona BeachDeerfield BeachDefuniak SpringsDelandDelray BeachDeltonaDunnellonEdgewaterEnglewoodEustisFort LauderdaleFort MyersFort PierceFort Walton BeachGainesvilleGulf BreezeHialeahHolidayHollywoodHomesteadHomosassaHudsonInvernessJacksonvilleJupiterKissimmeeLake CityLake WalesLake WorthLakelandLand O LakesLargoLeesburgLehigh AcresLive OakLongwoodLutzMariannaMelbourneMerritt IslandMiamiMiami BeachMiltonNaplesNew Port RicheyNew Smyrna BeachNorth Fort MyersNorth PortOcalaOkeechobeeOpa LockaOrange ParkOrlandoOrmond BeachOviedoPalm BayPalm Beach GardensPalm CoastPalm HarborPanama CityPanama City BeachPensacolaPerryPinellas ParkPlant CityPompano BeachPort CharlottePort OrangePort Saint LuciePunta GordaQuincyRiverviewSaint AugustineSaint CloudSaint PetersburgSanfordSarasotaSebastianSebringSeminoleSpring HillStuartTallahasseeTampaTarpon SpringsThe VillagesTitusvilleValricoVeniceVero BeachWesley ChapelWest Palm BeachWewahitchkaWinter HavenWinter ParkZephyrhills
Compare Zip Codes
Comparison Subject

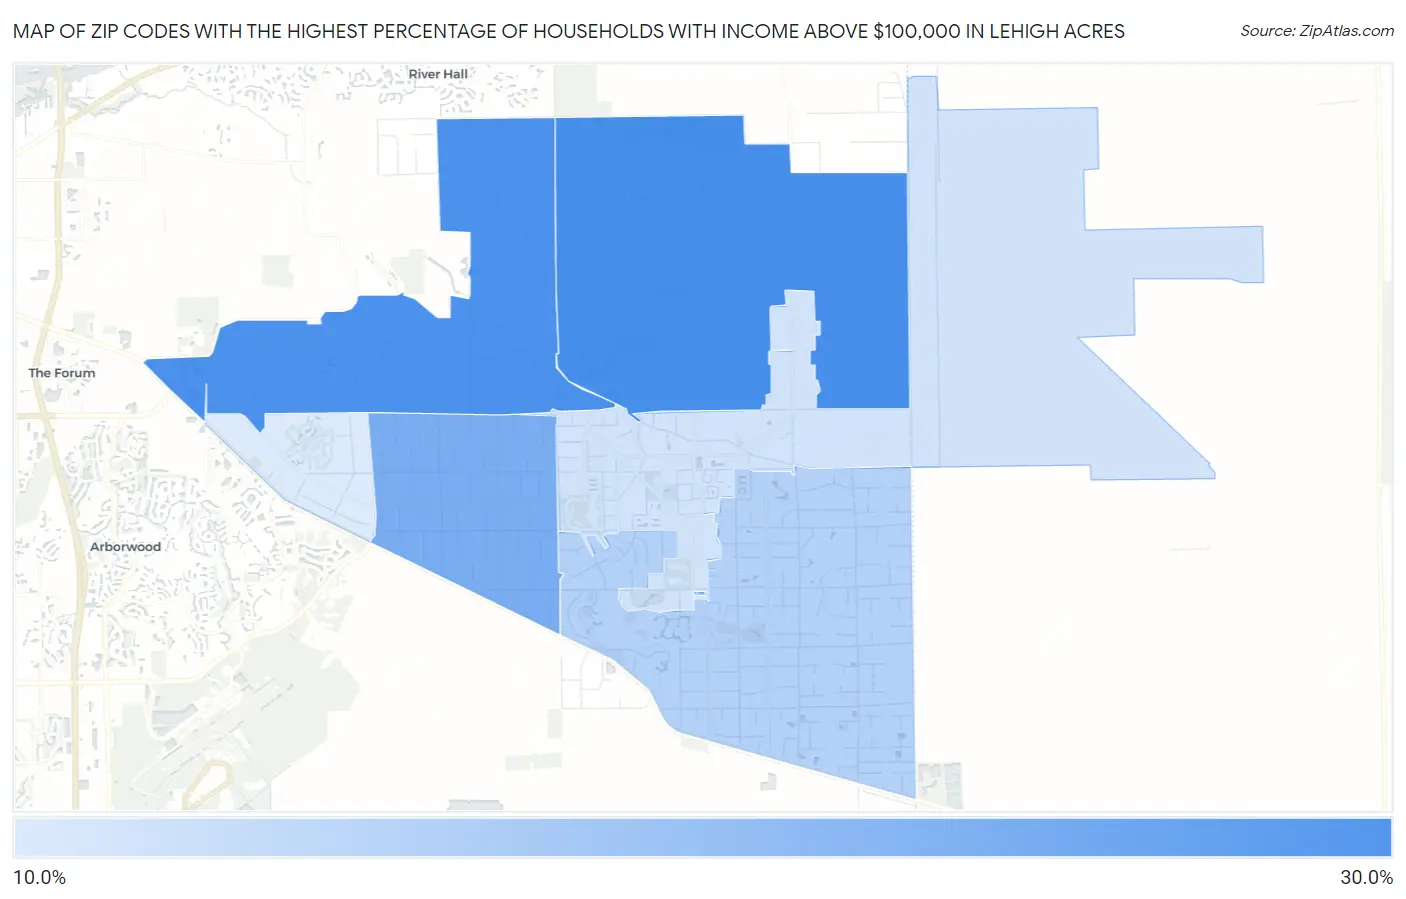
Map of Zip Codes with the Highest Percentage of Households with Income Above $100,000 in Lehigh Acres

0.0%
30.0%
Zip Codes with the Highest Percentage of Households with Income Above $100,000 in Lehigh Acres Map

Zip Codes with the Highest Percentage of Households with Income Above $100,000 in Lehigh Acres, FL

Zip Code Households with Income > $100k vs State vs National
1.3397228.0%32.4%(-4.40)#52937.3%(-9.30)#17,119
2.3397127.6%32.4%(-4.80)#54137.3%(-9.70)#17,456
3.3397623.1%32.4%(-9.30)#66637.3%(-14.2)#21,485
4.3397417.5%32.4%(-14.9)#80337.3%(-19.8)#25,905
5.3393614.8%32.4%(-17.6)#85537.3%(-22.5)#27,653
6.3397313.8%32.4%(-18.6)#87537.3%(-23.5)#28,205

Common Questions

What are the Top 5 Zip Codes with the Highest Percentage of Households with Income Above $100,000 in Lehigh Acres, FL?
Top 5 Zip Codes with the Highest Percentage of Households with Income Above $100,000 in Lehigh Acres, FL are:
#1
28.0%
#2
27.6%
#3
23.1%
#4
17.5%
#5
14.8%
What zip code has the Highest Percentage of Households with Income Above $100,000 in Lehigh Acres, FL?
33972 has the Highest Percentage of Households with Income Above $100,000 in Lehigh Acres, FL with 28.0%.
What is the Percentage of Households with Income Above $100,000 in Lehigh Acres, FL?
Percentage of Households with Income Above $100,000 in Lehigh Acres is 20.9%.
What is the Percentage of Households with Income Above $100,000 in Florida?
Percentage of Households with Income Above $100,000 in Florida is 32.4%.
What is the Percentage of Households with Income Above $100,000 in the United States?
Percentage of Households with Income Above $100,000 in the United States is 37.3%.