Zip Codes with the Highest Percentage of Households Heated by Bottled Gas / Liquid Propane in Lehigh Acres, FL

RELATED REPORTS & OPTIONS

Bottled Gas / LP Heating
Population
Families and Households
Female Fertility
Female Fertility (Unmarried)
Race (Community Size)
Race (Percentage)
Ancestry (Community Size)
AfricanAmericanArabArgentineanArmenianAustrianBahamianBarbadianBelgianBhutaneseBlackfeetBolivianBrazilianBritishBritish West IndianBurmeseCanadianCentral AmericanCentral American IndianCherokeeChileanChoctawColombianCosta RicanCroatianCubanCzechCzechoslovakianDanishDominicanDutchEastern EuropeanEcuadorianEnglishEuropeanFinnishFrenchFrench CanadianGermanGreekGuatemalanGuyaneseHaitianHonduranHungarianIndian (Asian)IrishItalianJamaicanKoreanLebaneseLithuanianMexicanMexican American IndianMoroccanNavajoNicaraguanNigerianNorwegianPakistaniPanamanianPennsylvania GermanPeruvianPolishPortuguesePuerto RicanRomanianRussianSalvadoranSamoanScandinavianScotch-IrishScottishSlavicSlovakSloveneSouth AmericanSpaniardSpanishSri LankanSubsaharan AfricanSwedishSwissThaiTrinidadian and TobagonianUkrainianUruguayanVenezuelanWelshWest Indian
Ancestry (Percentage)
AfricanAmericanArabArgentineanArmenianAustrianBahamianBarbadianBelgianBhutaneseBlackfeetBolivianBrazilianBritishBritish West IndianBurmeseCanadianCentral AmericanCentral American IndianCherokeeChileanChoctawColombianCosta RicanCroatianCubanCzechCzechoslovakianDanishDominicanDutchEastern EuropeanEcuadorianEnglishEuropeanFinnishFrenchFrench CanadianGermanGreekGuatemalanGuyaneseHaitianHonduranHungarianIndian (Asian)IrishItalianJamaicanKoreanLebaneseLithuanianMexicanMexican American IndianMoroccanNavajoNicaraguanNigerianNorwegianPakistaniPanamanianPennsylvania GermanPeruvianPolishPortuguesePuerto RicanRomanianRussianSalvadoranSamoanScandinavianScotch-IrishScottishSlavicSlovakSloveneSouth AmericanSpaniardSpanishSri LankanSubsaharan AfricanSwedishSwissThaiTrinidadian and TobagonianUkrainianUruguayanVenezuelanWelshWest Indian
Immigrant Origin (Total)
Immigrant Origin (Percentage)
Income
Income (Families)
Income (Households)
Poverty
Poverty (Families)
Unemployment
Employment Occupations
Employment Industries
Employer Class
Commute Time
Commute Means
School Enrollment
Education by Degree Field
Occupancy
Finances
Physical Characteristics
Lehigh Acres
States
Florida Cities
AlachuaAltamonte SpringsApopkaArcadiaBoca RatonBonita SpringsBoynton BeachBradentonBrandonBrooksvilleCape CoralClearwaterClermontCocoaCoral SpringsCrestviewCrystal RiverDade CityDavenportDaytona BeachDeerfield BeachDefuniak SpringsDelandDelray BeachDeltonaDunnellonEdgewaterEnglewoodEustisFort LauderdaleFort MyersFort PierceFort Walton BeachGainesvilleHialeahHolidayHollywoodHomesteadHomosassaHudsonInvernessJacksonvilleJupiterKissimmeeLake CityLake WalesLake WorthLakelandLand O LakesLargoLeesburgLehigh AcresLive OakLongwoodLutzMariannaMelbourneMerritt IslandMiamiMiami BeachMiltonNaplesNew Port RicheyNew Smyrna BeachNorth Fort MyersNorth PortOcalaOkeechobeeOrlandoOrmond BeachOviedoPalm BayPalm Beach GardensPalm CoastPalm HarborPanama CityPanama City BeachPensacolaPerryPlant CityPompano BeachPort CharlottePort OrangePort Saint LuciePunta GordaQuincyRiverviewSaint AugustineSaint CloudSaint PetersburgSanfordSarasotaSebastianSebringSeminoleSpring HillStuartTallahasseeTampaTarpon SpringsThe VillagesTitusvilleValricoVeniceVero BeachWesley ChapelWest Palm BeachWewahitchkaWinter HavenWinter ParkZephyrhills
Compare Zip Codes
Comparison Subject

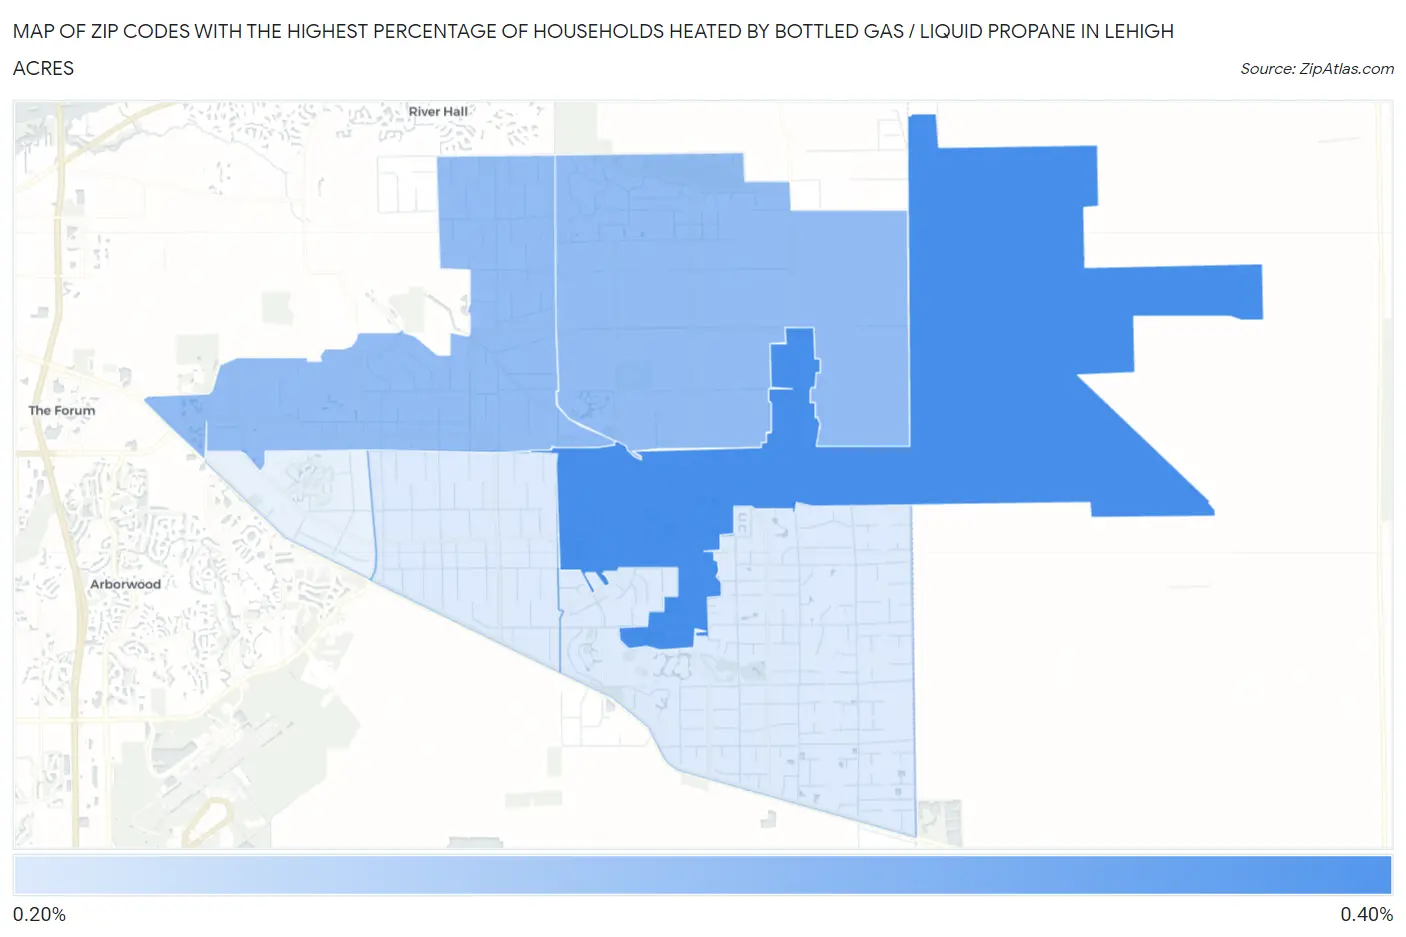
Map of Zip Codes with the Highest Percentage of Households Heated by Bottled Gas / Liquid Propane in Lehigh Acres

0.0%
0.40%
Zip Codes with the Highest Percentage of Households Heated by Bottled Gas / Liquid Propane in Lehigh Acres Map

Zip Codes with the Highest Percentage of Households Heated by Bottled Gas / Liquid Propane in Lehigh Acres, FL

Zip Code Bottled Gas / LP Heating vs State vs National
1.339360.40%0.90%(-0.500)#6614.9%(-4.50)#28,913
2.339710.30%0.90%(-0.600)#7104.9%(-4.60)#29,145
3.339720.30%0.90%(-0.600)#7404.9%(-4.60)#29,233
4.339740.20%0.90%(-0.700)#7904.9%(-4.70)#29,419
5.339760.20%0.90%(-0.700)#7924.9%(-4.70)#29,424

Common Questions

What are the Top 5 Zip Codes with the Highest Percentage of Households Heated by Bottled Gas / Liquid Propane in Lehigh Acres, FL?
Top 5 Zip Codes with the Highest Percentage of Households Heated by Bottled Gas / Liquid Propane in Lehigh Acres, FL are:
#1
0.40%
#2
0.30%
#3
0.30%
#4
0.20%
#5
0.20%
What zip code has the Highest Percentage of Households Heated by Bottled Gas / Liquid Propane in Lehigh Acres, FL?
33936 has the Highest Percentage of Households Heated by Bottled Gas / Liquid Propane in Lehigh Acres, FL with 0.40%.
What is the Percentage of Households Heated by Bottled Gas / Liquid Propane in Lehigh Acres, FL?
Percentage of Households Heated by Bottled Gas / Liquid Propane in Lehigh Acres is 0.20%.
What is the Percentage of Households Heated by Bottled Gas / Liquid Propane in Florida?
Percentage of Households Heated by Bottled Gas / Liquid Propane in Florida is 0.90%.
What is the Percentage of Households Heated by Bottled Gas / Liquid Propane in the United States?
Percentage of Households Heated by Bottled Gas / Liquid Propane in the United States is 4.9%.