Zip Codes with the Highest Percentage of Households with Income Above $100,000 in Ocala, FL

RELATED REPORTS & OPTIONS

Household Income | $100k+
Population
Families and Households
Female Fertility
Female Fertility (Unmarried)
Race (Community Size)
Race (Percentage)
Ancestry (Community Size)
AfricanAmericanApacheArabArgentineanArmenianAustralianAustrianBahamianBarbadianBelgianBhutaneseBlackfeetBolivianBrazilianBritishBritish West IndianBurmeseCanadianCentral AmericanCentral American IndianCherokeeChickasawChileanChippewaChoctawColombianCosta RicanCreekCroatianCrowCubanCzechCzechoslovakianDanishDominicanDutchEastern EuropeanEcuadorianEgyptianEnglishEstonianEuropeanFinnishFrenchFrench CanadianGermanGerman RussianGreekGuamanian / ChamorroGuatemalanGuyaneseHaitianHonduranHungarianIcelanderIndian (Asian)IrishIroquoisIsraeliItalianJamaicanJapaneseKoreanLaotianLatvianLebaneseLithuanianMalaysianMexicanMoroccanNicaraguanNigerianNorthern EuropeanNorwegianPakistaniPanamanianPennsylvania GermanPeruvianPolishPortuguesePuerto RicanRomanianRussianSalvadoranScandinavianScotch-IrishScottishSerbianSiouxSlavicSlovakSloveneSouth AfricanSouth AmericanSouth American IndianSpaniardSpanishSri LankanSubsaharan AfricanSwedishSwissSyrianThaiTrinidadian and TobagonianTurkishU.S. Virgin IslanderUkrainianUruguayanVenezuelanWelshWest IndianYugoslavian
Ancestry (Percentage)
AfricanAmericanApacheArabArgentineanArmenianAustralianAustrianBahamianBarbadianBelgianBhutaneseBlackfeetBolivianBrazilianBritishBritish West IndianBurmeseCanadianCentral AmericanCentral American IndianCherokeeChickasawChileanChippewaChoctawColombianCosta RicanCreekCroatianCrowCubanCzechCzechoslovakianDanishDominicanDutchEastern EuropeanEcuadorianEgyptianEnglishEstonianEuropeanFinnishFrenchFrench CanadianGermanGerman RussianGreekGuamanian / ChamorroGuatemalanGuyaneseHaitianHonduranHungarianIcelanderIndian (Asian)IrishIroquoisIsraeliItalianJamaicanJapaneseKoreanLaotianLatvianLebaneseLithuanianMalaysianMexicanMoroccanNicaraguanNigerianNorthern EuropeanNorwegianPakistaniPanamanianPennsylvania GermanPeruvianPolishPortuguesePuerto RicanRomanianRussianSalvadoranScandinavianScotch-IrishScottishSerbianSiouxSlavicSlovakSloveneSouth AfricanSouth AmericanSouth American IndianSpaniardSpanishSri LankanSubsaharan AfricanSwedishSwissSyrianThaiTrinidadian and TobagonianTurkishU.S. Virgin IslanderUkrainianUruguayanVenezuelanWelshWest IndianYugoslavian
Immigrant Origin (Total)
Immigrant Origin (Percentage)
Income
Income (Families)
Income (Households)
Poverty
Poverty (Families)
Unemployment
Employment Occupations
Employment Industries
Employer Class
Commute Time
Commute Means
School Enrollment
Education by Degree Field
Occupancy
Finances
Physical Characteristics
Ocala
States
Florida Cities
Altamonte SpringsApopkaArcadiaBoca RatonBonita SpringsBoynton BeachBradentonBrandonBrooksvilleCape CoralCasselberryClearwaterClermontCocoaCoral SpringsCrestviewCrystal RiverDade CityDavenportDaytona BeachDeerfield BeachDefuniak SpringsDelandDelray BeachDeltonaDunnellonEdgewaterEnglewoodEustisFort LauderdaleFort MyersFort PierceFort Walton BeachGainesvilleGulf BreezeHialeahHolidayHollywoodHomesteadHomosassaHudsonInvernessJacksonvilleJupiterKissimmeeLake CityLake WalesLake WorthLakelandLand O LakesLargoLeesburgLehigh AcresLive OakLongwoodLutzMariannaMelbourneMerritt IslandMiamiMiami BeachMiltonNaplesNew Port RicheyNew Smyrna BeachNorth Fort MyersNorth PortOcalaOkeechobeeOpa LockaOrange ParkOrlandoOrmond BeachOviedoPalm BayPalm Beach GardensPalm CoastPalm HarborPanama CityPanama City BeachPensacolaPerryPinellas ParkPlant CityPompano BeachPort CharlottePort OrangePort Saint LuciePunta GordaQuincyRiverviewSaint AugustineSaint CloudSaint PetersburgSanfordSarasotaSebastianSebringSeminoleSpring HillStuartTallahasseeTampaTarpon SpringsThe VillagesTitusvilleValricoVeniceVero BeachWesley ChapelWest Palm BeachWewahitchkaWinter HavenWinter ParkZephyrhills
Compare Zip Codes
Comparison Subject

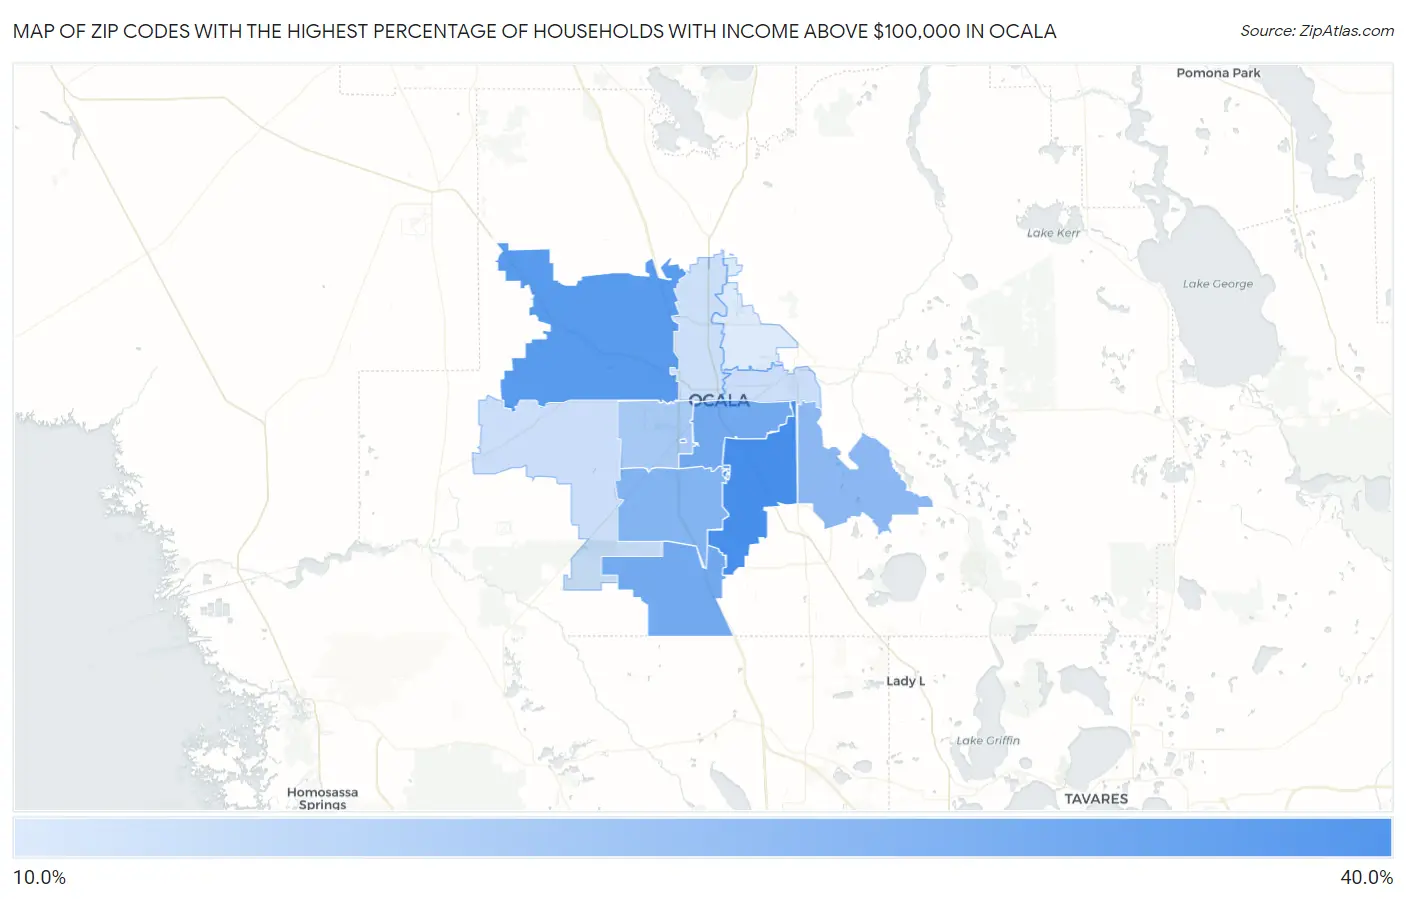
Map of Zip Codes with the Highest Percentage of Households with Income Above $100,000 in Ocala

0.0%
40.0%
Zip Codes with the Highest Percentage of Households with Income Above $100,000 in Ocala Map

Zip Codes with the Highest Percentage of Households with Income Above $100,000 in Ocala, FL

Zip Code Households with Income > $100k vs State vs National
1.3448033.5%32.4%(+1.10)#38837.3%(-3.80)#12,771
2.3448231.7%32.4%(-0.700)#42637.3%(-5.60)#14,096
3.3447128.4%32.4%(-4.00)#51737.3%(-8.90)#16,775
4.3447328.4%32.4%(-4.00)#51837.3%(-8.90)#16,778
5.3447626.6%32.4%(-5.80)#57337.3%(-10.7)#18,337
6.3447225.6%32.4%(-6.80)#59937.3%(-11.7)#19,209
7.3447422.4%32.4%(-10.0)#68337.3%(-14.9)#22,056
8.3448118.8%32.4%(-13.6)#76837.3%(-18.5)#24,971
9.3447018.7%32.4%(-13.7)#77337.3%(-18.6)#25,041
10.3447518.6%32.4%(-13.8)#77537.3%(-18.7)#25,105
11.3447916.8%32.4%(-15.6)#81437.3%(-20.5)#26,368

Common Questions

What are the Top 10 Zip Codes with the Highest Percentage of Households with Income Above $100,000 in Ocala, FL?
Top 10 Zip Codes with the Highest Percentage of Households with Income Above $100,000 in Ocala, FL are:
#1
33.5%
#2
31.7%
#3
28.4%
#4
28.4%
#5
26.6%
#6
25.6%
#7
22.4%
#8
18.8%
#9
18.7%
#10
18.6%
What zip code has the Highest Percentage of Households with Income Above $100,000 in Ocala, FL?
34480 has the Highest Percentage of Households with Income Above $100,000 in Ocala, FL with 33.5%.
What is the Percentage of Households with Income Above $100,000 in Ocala, FL?
Percentage of Households with Income Above $100,000 in Ocala is 22.7%.
What is the Percentage of Households with Income Above $100,000 in Florida?
Percentage of Households with Income Above $100,000 in Florida is 32.4%.
What is the Percentage of Households with Income Above $100,000 in the United States?
Percentage of Households with Income Above $100,000 in the United States is 37.3%.