Zimbabwean vs Soviet Union Currently Married
COMPARE
Zimbabwean
Soviet Union
Currently Married
Currently Married Comparison
Zimbabweans
Soviet Union
47.0%
CURRENTLY MARRIED
70.1/ 100
METRIC RATING
149th/ 347
METRIC RANK
46.2%
CURRENTLY MARRIED
25.7/ 100
METRIC RATING
192nd/ 347
METRIC RANK
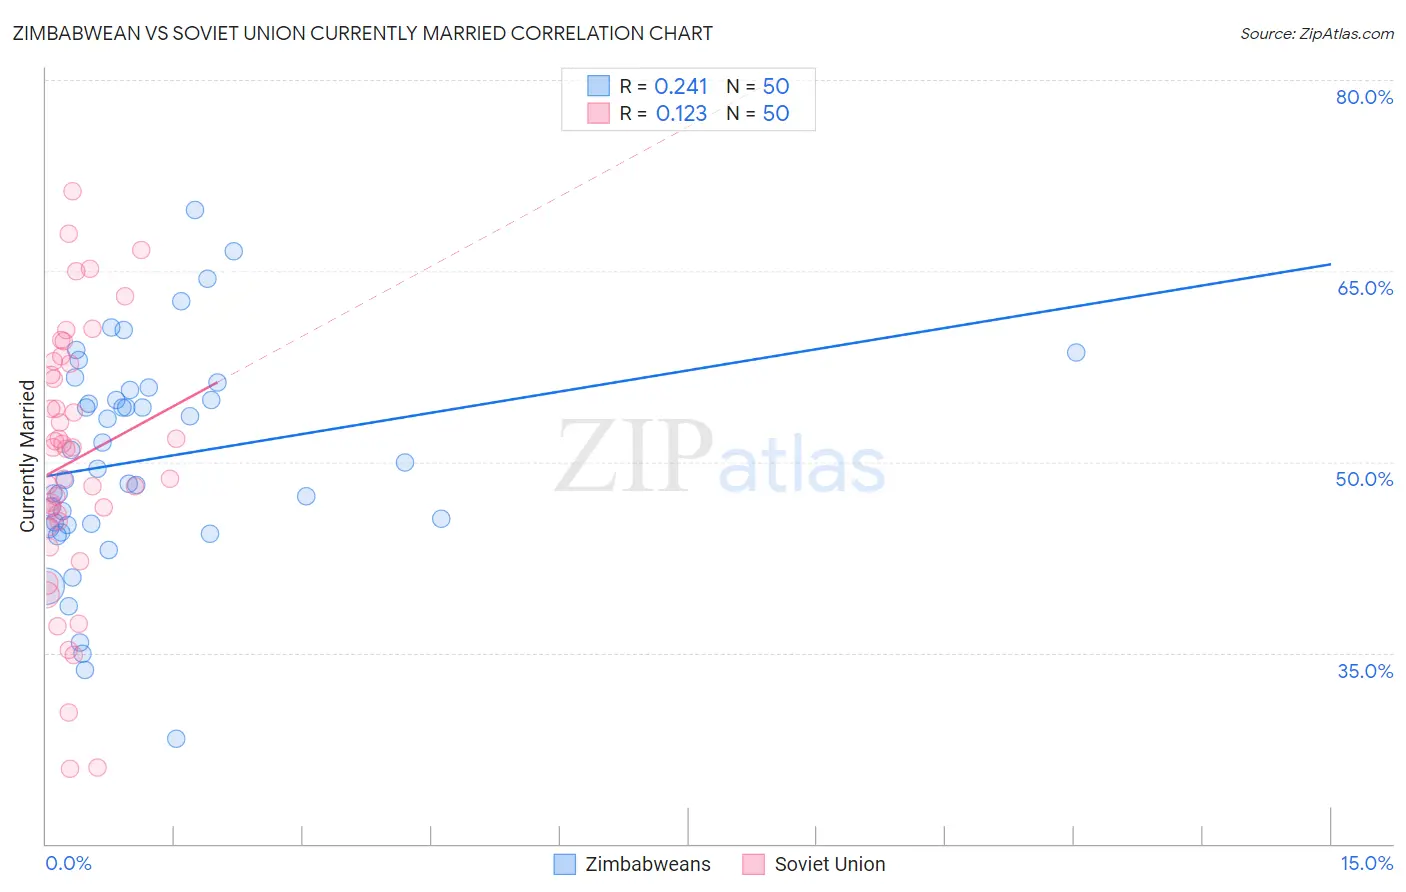
Zimbabwean vs Soviet Union Currently Married Correlation Chart
The statistical analysis conducted on geographies consisting of 69,204,681 people shows a weak positive correlation between the proportion of Zimbabweans and percentage of population currently married in the United States with a correlation coefficient (R) of 0.241 and weighted average of 47.0%. Similarly, the statistical analysis conducted on geographies consisting of 43,514,626 people shows a poor positive correlation between the proportion of Soviet Union and percentage of population currently married in the United States with a correlation coefficient (R) of 0.123 and weighted average of 46.2%, a difference of 1.8%.
Currently Married Correlation Summary
| Measurement | Zimbabwean | Soviet Union |
| Minimum | 28.2% | 25.9% |
| Maximum | 69.8% | 71.3% |
| Range | 41.6% | 45.4% |
| Mean | 50.2% | 50.1% |
| Median | 49.7% | 51.1% |
| Interquartile 25% (IQ1) | 45.1% | 45.4% |
| Interquartile 75% (IQ3) | 55.6% | 57.7% |
| Interquartile Range (IQR) | 10.5% | 12.3% |
| Standard Deviation (Sample) | 8.5% | 10.3% |
| Standard Deviation (Population) | 8.5% | 10.2% |
Similar Demographics by Currently Married
Demographics Similar to Zimbabweans by Currently Married
In terms of currently married, the demographic groups most similar to Zimbabweans are Immigrants from Turkey (47.0%, a difference of 0.0%), Cambodian (47.0%, a difference of 0.010%), Chilean (47.0%, a difference of 0.010%), Immigrants from Serbia (47.0%, a difference of 0.060%), and Immigrants from Venezuela (47.0%, a difference of 0.060%).
| Demographics | Rating | Rank | Currently Married |
| Argentineans | 74.4 /100 | #142 | Good 47.1% |
| Guamanians/Chamorros | 74.2 /100 | #143 | Good 47.1% |
| Hmong | 73.4 /100 | #144 | Good 47.1% |
| Immigrants | South Eastern Asia | 72.9 /100 | #145 | Good 47.1% |
| Carpatho Rusyns | 72.6 /100 | #146 | Good 47.0% |
| Immigrants | Argentina | 72.0 /100 | #147 | Good 47.0% |
| Cambodians | 70.4 /100 | #148 | Good 47.0% |
| Zimbabweans | 70.1 /100 | #149 | Good 47.0% |
| Immigrants | Turkey | 70.0 /100 | #150 | Good 47.0% |
| Chileans | 69.8 /100 | #151 | Good 47.0% |
| Immigrants | Serbia | 68.8 /100 | #152 | Good 47.0% |
| Immigrants | Venezuela | 68.6 /100 | #153 | Good 47.0% |
| Albanians | 68.6 /100 | #154 | Good 47.0% |
| Arabs | 68.6 /100 | #155 | Good 47.0% |
| Spanish | 68.1 /100 | #156 | Good 47.0% |
Demographics Similar to Soviet Union by Currently Married
In terms of currently married, the demographic groups most similar to Soviet Union are Immigrants from Fiji (46.2%, a difference of 0.040%), Immigrants from France (46.2%, a difference of 0.090%), South American (46.1%, a difference of 0.10%), Immigrants from Nepal (46.1%, a difference of 0.10%), and Choctaw (46.3%, a difference of 0.16%).
| Demographics | Rating | Rank | Currently Married |
| Mongolians | 37.6 /100 | #185 | Fair 46.4% |
| Immigrants | Chile | 36.8 /100 | #186 | Fair 46.4% |
| Immigrants | Peru | 35.3 /100 | #187 | Fair 46.4% |
| Colombians | 31.8 /100 | #188 | Fair 46.3% |
| Fijians | 30.3 /100 | #189 | Fair 46.3% |
| Choctaw | 29.1 /100 | #190 | Fair 46.3% |
| Immigrants | France | 27.7 /100 | #191 | Fair 46.2% |
| Soviet Union | 25.7 /100 | #192 | Fair 46.2% |
| Immigrants | Fiji | 25.0 /100 | #193 | Fair 46.2% |
| South Americans | 23.8 /100 | #194 | Fair 46.1% |
| Immigrants | Nepal | 23.7 /100 | #195 | Fair 46.1% |
| Immigrants | Bosnia and Herzegovina | 22.2 /100 | #196 | Fair 46.1% |
| Immigrants | Kuwait | 21.7 /100 | #197 | Fair 46.1% |
| Immigrants | Colombia | 21.0 /100 | #198 | Fair 46.1% |
| Immigrants | Costa Rica | 19.6 /100 | #199 | Poor 46.0% |