Zimbabwean vs Lebanese Births to Unmarried Women
COMPARE
Zimbabwean
Lebanese
Births to Unmarried Women
Births to Unmarried Women Comparison
Zimbabweans
Lebanese
28.7%
BIRTHS TO UNMARRIED WOMEN
98.2/ 100
METRIC RATING
78th/ 347
METRIC RANK
29.5%
BIRTHS TO UNMARRIED WOMEN
94.4/ 100
METRIC RATING
103rd/ 347
METRIC RANK
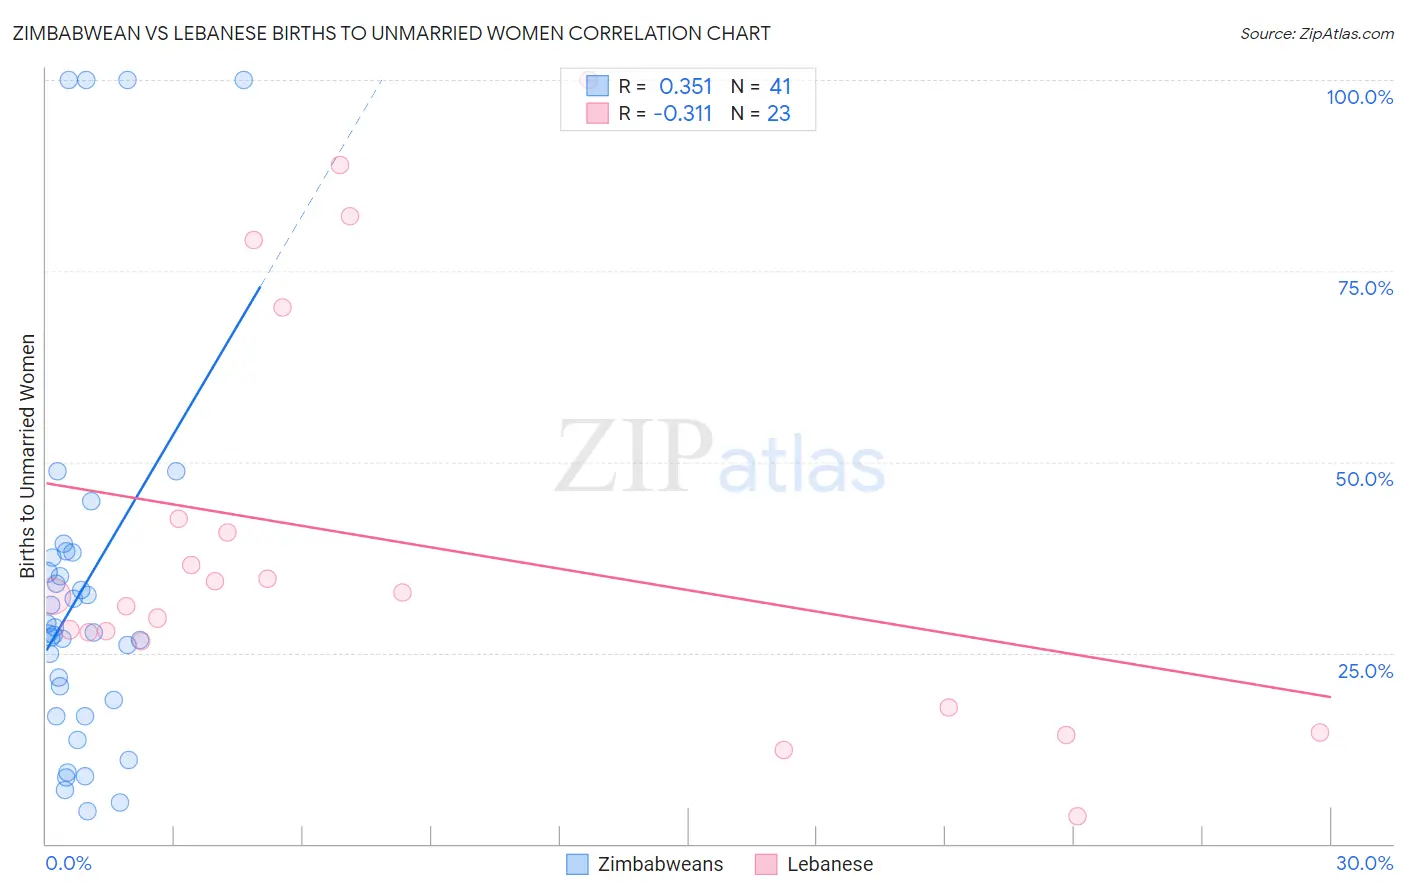
Zimbabwean vs Lebanese Births to Unmarried Women Correlation Chart
The statistical analysis conducted on geographies consisting of 68,374,099 people shows a mild positive correlation between the proportion of Zimbabweans and percentage of births to unmarried women in the United States with a correlation coefficient (R) of 0.351 and weighted average of 28.7%. Similarly, the statistical analysis conducted on geographies consisting of 372,610,698 people shows a mild negative correlation between the proportion of Lebanese and percentage of births to unmarried women in the United States with a correlation coefficient (R) of -0.311 and weighted average of 29.5%, a difference of 3.0%.
Births to Unmarried Women Correlation Summary
| Measurement | Zimbabwean | Lebanese |
| Minimum | 4.3% | 3.6% |
| Maximum | 100.0% | 100.0% |
| Range | 95.7% | 96.4% |
| Mean | 33.3% | 39.5% |
| Median | 27.6% | 32.4% |
| Interquartile 25% (IQ1) | 17.8% | 26.4% |
| Interquartile 75% (IQ3) | 37.9% | 42.6% |
| Interquartile Range (IQR) | 20.1% | 16.2% |
| Standard Deviation (Sample) | 25.0% | 26.2% |
| Standard Deviation (Population) | 24.7% | 25.6% |
Similar Demographics by Births to Unmarried Women
Demographics Similar to Zimbabweans by Births to Unmarried Women
In terms of births to unmarried women, the demographic groups most similar to Zimbabweans are Danish (28.7%, a difference of 0.020%), Immigrants from Afghanistan (28.7%, a difference of 0.050%), Immigrants from Austria (28.7%, a difference of 0.090%), Immigrants from Northern Europe (28.6%, a difference of 0.16%), and Romanian (28.7%, a difference of 0.20%).
| Demographics | Rating | Rank | Births to Unmarried Women |
| Jordanians | 98.5 /100 | #71 | Exceptional 28.5% |
| Immigrants | Sweden | 98.5 /100 | #72 | Exceptional 28.5% |
| Albanians | 98.5 /100 | #73 | Exceptional 28.5% |
| Immigrants | Bolivia | 98.5 /100 | #74 | Exceptional 28.6% |
| Immigrants | Switzerland | 98.4 /100 | #75 | Exceptional 28.6% |
| Israelis | 98.4 /100 | #76 | Exceptional 28.6% |
| Immigrants | Northern Europe | 98.3 /100 | #77 | Exceptional 28.6% |
| Zimbabweans | 98.2 /100 | #78 | Exceptional 28.7% |
| Danes | 98.2 /100 | #79 | Exceptional 28.7% |
| Immigrants | Afghanistan | 98.1 /100 | #80 | Exceptional 28.7% |
| Immigrants | Austria | 98.1 /100 | #81 | Exceptional 28.7% |
| Romanians | 98.0 /100 | #82 | Exceptional 28.7% |
| Immigrants | Kuwait | 98.0 /100 | #83 | Exceptional 28.8% |
| Immigrants | Poland | 97.6 /100 | #84 | Exceptional 28.9% |
| Sri Lankans | 97.5 /100 | #85 | Exceptional 28.9% |
Demographics Similar to Lebanese by Births to Unmarried Women
In terms of births to unmarried women, the demographic groups most similar to Lebanese are Lithuanian (29.6%, a difference of 0.010%), Australian (29.5%, a difference of 0.050%), Immigrants from Nepal (29.6%, a difference of 0.060%), Immigrants from Northern Africa (29.5%, a difference of 0.13%), and Swedish (29.6%, a difference of 0.32%).
| Demographics | Rating | Rank | Births to Unmarried Women |
| Norwegians | 95.8 /100 | #96 | Exceptional 29.3% |
| Immigrants | South Africa | 95.7 /100 | #97 | Exceptional 29.3% |
| Immigrants | Syria | 95.7 /100 | #98 | Exceptional 29.4% |
| Immigrants | Denmark | 95.3 /100 | #99 | Exceptional 29.4% |
| Luxembourgers | 95.2 /100 | #100 | Exceptional 29.4% |
| Immigrants | Northern Africa | 94.7 /100 | #101 | Exceptional 29.5% |
| Australians | 94.6 /100 | #102 | Exceptional 29.5% |
| Lebanese | 94.4 /100 | #103 | Exceptional 29.5% |
| Lithuanians | 94.4 /100 | #104 | Exceptional 29.6% |
| Immigrants | Nepal | 94.3 /100 | #105 | Exceptional 29.6% |
| Swedes | 93.8 /100 | #106 | Exceptional 29.6% |
| Immigrants | Brazil | 93.7 /100 | #107 | Exceptional 29.6% |
| Paraguayans | 93.5 /100 | #108 | Exceptional 29.7% |
| Greeks | 93.4 /100 | #109 | Exceptional 29.7% |
| Immigrants | Ethiopia | 93.4 /100 | #110 | Exceptional 29.7% |