Zimbabwean vs Immigrants from Turkey Births to Unmarried Women
COMPARE
Zimbabwean
Immigrants from Turkey
Births to Unmarried Women
Births to Unmarried Women Comparison
Zimbabweans
Immigrants from Turkey
28.7%
BIRTHS TO UNMARRIED WOMEN
98.2/ 100
METRIC RATING
78th/ 347
METRIC RANK
28.1%
BIRTHS TO UNMARRIED WOMEN
99.1/ 100
METRIC RATING
60th/ 347
METRIC RANK
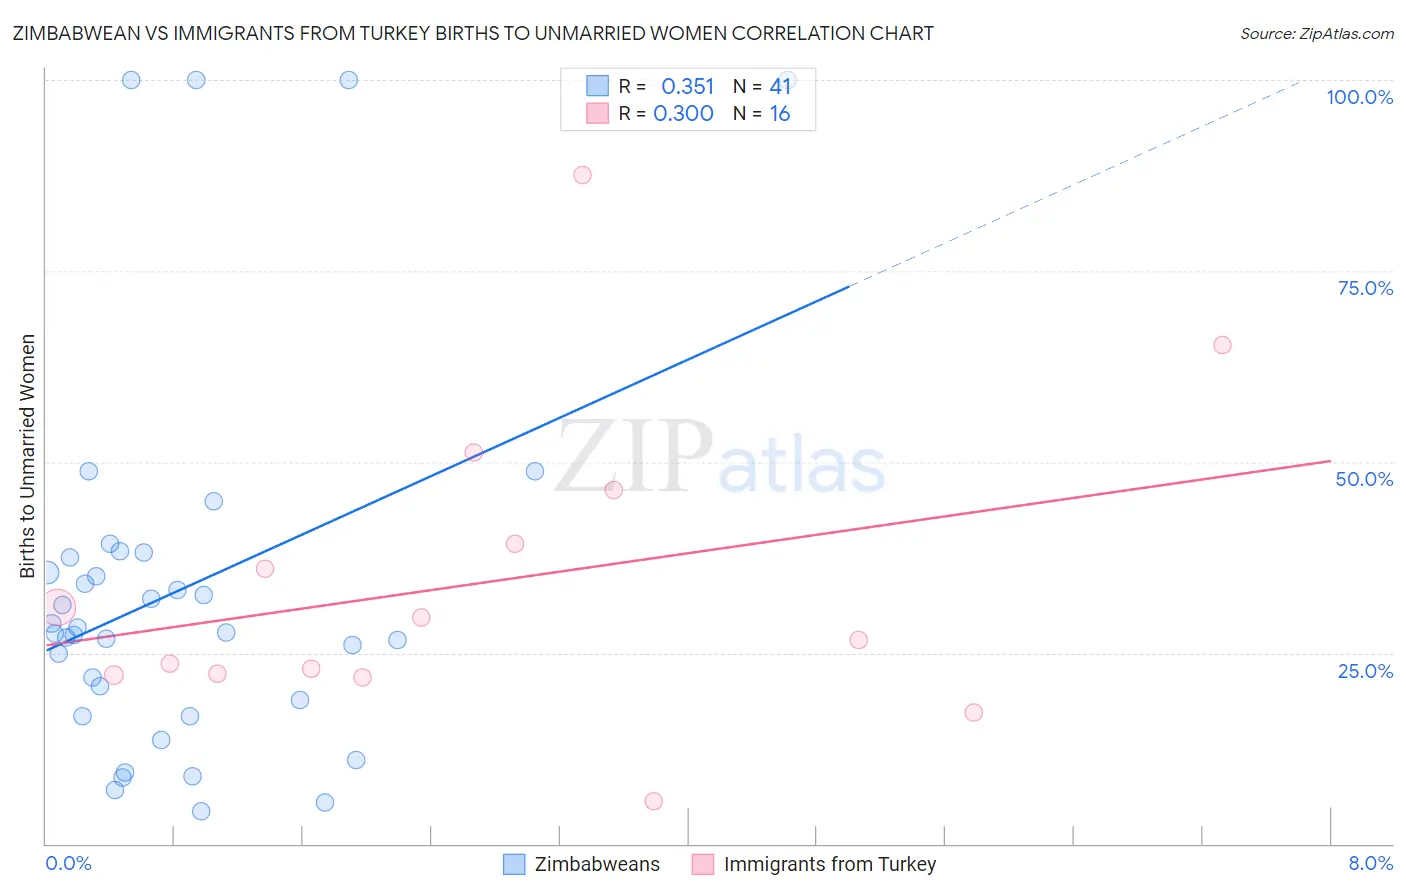
Zimbabwean vs Immigrants from Turkey Births to Unmarried Women Correlation Chart
The statistical analysis conducted on geographies consisting of 68,374,099 people shows a mild positive correlation between the proportion of Zimbabweans and percentage of births to unmarried women in the United States with a correlation coefficient (R) of 0.351 and weighted average of 28.7%. Similarly, the statistical analysis conducted on geographies consisting of 210,131,924 people shows a weak positive correlation between the proportion of Immigrants from Turkey and percentage of births to unmarried women in the United States with a correlation coefficient (R) of 0.300 and weighted average of 28.1%, a difference of 2.0%.
Births to Unmarried Women Correlation Summary
| Measurement | Zimbabwean | Immigrants from Turkey |
| Minimum | 4.3% | 5.6% |
| Maximum | 100.0% | 87.5% |
| Range | 95.7% | 81.9% |
| Mean | 33.3% | 34.3% |
| Median | 27.6% | 28.2% |
| Interquartile 25% (IQ1) | 17.8% | 22.2% |
| Interquartile 75% (IQ3) | 37.9% | 42.8% |
| Interquartile Range (IQR) | 20.1% | 20.6% |
| Standard Deviation (Sample) | 25.0% | 20.2% |
| Standard Deviation (Population) | 24.7% | 19.6% |
Demographics Similar to Zimbabweans and Immigrants from Turkey by Births to Unmarried Women
In terms of births to unmarried women, the demographic groups most similar to Zimbabweans are Danish (28.7%, a difference of 0.020%), Immigrants from Northern Europe (28.6%, a difference of 0.16%), Israeli (28.6%, a difference of 0.36%), Immigrants from Switzerland (28.6%, a difference of 0.37%), and Immigrants from Bolivia (28.6%, a difference of 0.46%). Similarly, the demographic groups most similar to Immigrants from Turkey are Immigrants from Kazakhstan (28.1%, a difference of 0.040%), Immigrants from North Macedonia (28.1%, a difference of 0.040%), Egyptian (28.2%, a difference of 0.36%), Immigrants from Serbia (28.3%, a difference of 0.51%), and Tongan (28.4%, a difference of 0.89%).
| Demographics | Rating | Rank | Births to Unmarried Women |
| Immigrants | Kazakhstan | 99.1 /100 | #59 | Exceptional 28.1% |
| Immigrants | Turkey | 99.1 /100 | #60 | Exceptional 28.1% |
| Immigrants | North Macedonia | 99.1 /100 | #61 | Exceptional 28.1% |
| Egyptians | 99.0 /100 | #62 | Exceptional 28.2% |
| Immigrants | Serbia | 98.9 /100 | #63 | Exceptional 28.3% |
| Tongans | 98.8 /100 | #64 | Exceptional 28.4% |
| Immigrants | Czechoslovakia | 98.8 /100 | #65 | Exceptional 28.4% |
| Immigrants | Egypt | 98.8 /100 | #66 | Exceptional 28.4% |
| Palestinians | 98.7 /100 | #67 | Exceptional 28.4% |
| Immigrants | Europe | 98.7 /100 | #68 | Exceptional 28.4% |
| Bolivians | 98.7 /100 | #69 | Exceptional 28.5% |
| Laotians | 98.6 /100 | #70 | Exceptional 28.5% |
| Jordanians | 98.5 /100 | #71 | Exceptional 28.5% |
| Immigrants | Sweden | 98.5 /100 | #72 | Exceptional 28.5% |
| Albanians | 98.5 /100 | #73 | Exceptional 28.5% |
| Immigrants | Bolivia | 98.5 /100 | #74 | Exceptional 28.6% |
| Immigrants | Switzerland | 98.4 /100 | #75 | Exceptional 28.6% |
| Israelis | 98.4 /100 | #76 | Exceptional 28.6% |
| Immigrants | Northern Europe | 98.3 /100 | #77 | Exceptional 28.6% |
| Zimbabweans | 98.2 /100 | #78 | Exceptional 28.7% |
| Danes | 98.2 /100 | #79 | Exceptional 28.7% |