Yup'ik vs Immigrants from Northern Africa Single Mother Households
COMPARE
Yup'ik
Immigrants from Northern Africa
Single Mother Households
Single Mother Households Comparison
Yup'ik
Immigrants from Northern Africa
10.0%
SINGLE MOTHER HOUSEHOLDS
0.0/ 100
METRIC RATING
347th/ 347
METRIC RANK
6.2%
SINGLE MOTHER HOUSEHOLDS
68.0/ 100
METRIC RATING
164th/ 347
METRIC RANK
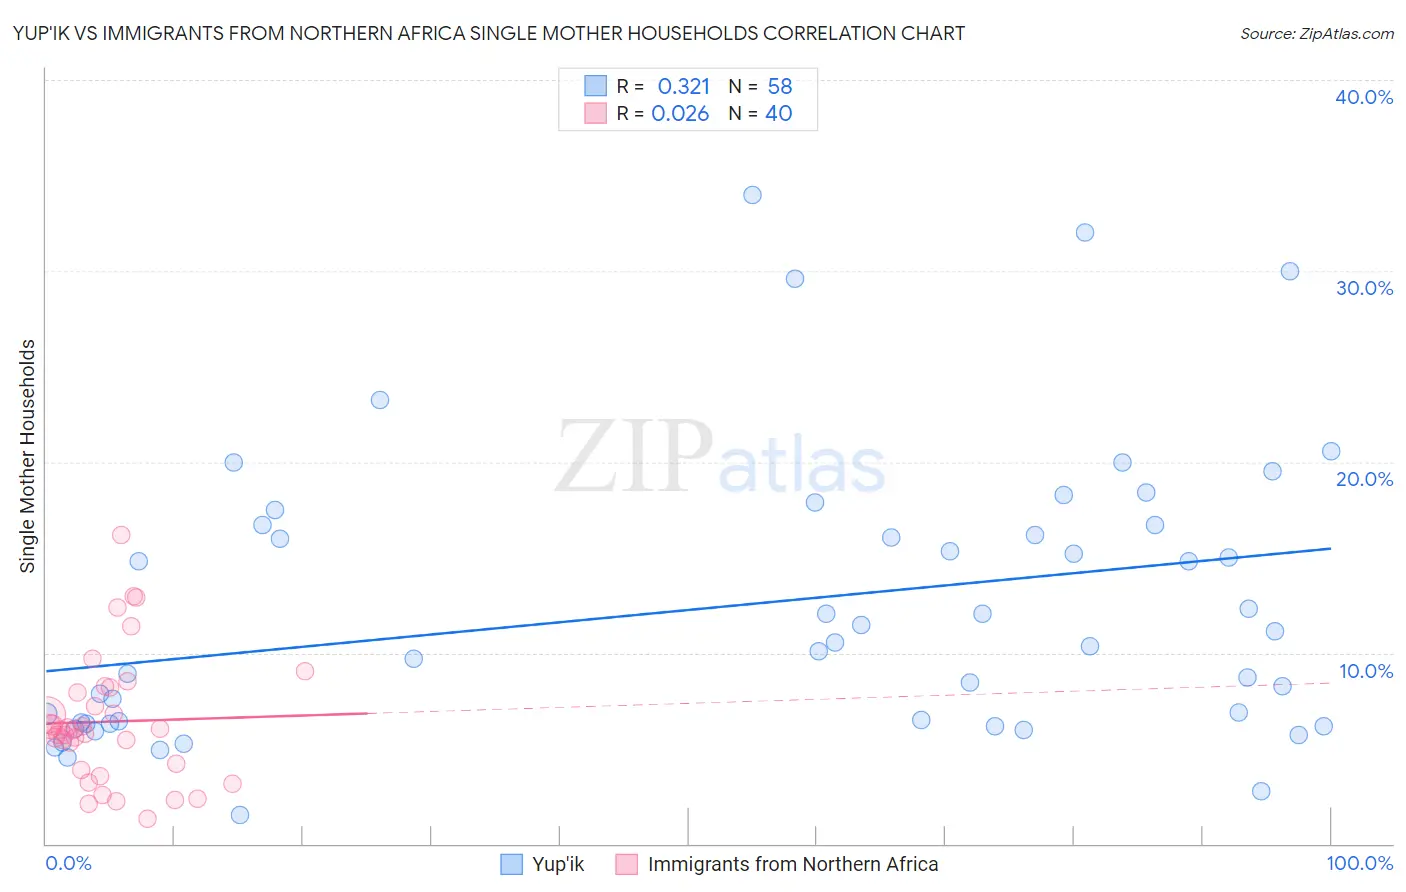
Yup'ik vs Immigrants from Northern Africa Single Mother Households Correlation Chart
The statistical analysis conducted on geographies consisting of 39,868,433 people shows a mild positive correlation between the proportion of Yup'ik and percentage of single mother households in the United States with a correlation coefficient (R) of 0.321 and weighted average of 10.0%. Similarly, the statistical analysis conducted on geographies consisting of 320,525,361 people shows no correlation between the proportion of Immigrants from Northern Africa and percentage of single mother households in the United States with a correlation coefficient (R) of 0.026 and weighted average of 6.2%, a difference of 61.8%.
Single Mother Households Correlation Summary
| Measurement | Yup'ik | Immigrants from Northern Africa |
| Minimum | 1.5% | 1.3% |
| Maximum | 34.0% | 16.1% |
| Range | 32.5% | 14.8% |
| Mean | 12.4% | 6.4% |
| Median | 10.4% | 6.0% |
| Interquartile 25% (IQ1) | 6.3% | 4.0% |
| Interquartile 75% (IQ3) | 16.7% | 8.0% |
| Interquartile Range (IQR) | 10.4% | 4.0% |
| Standard Deviation (Sample) | 7.4% | 3.3% |
| Standard Deviation (Population) | 7.4% | 3.3% |
Similar Demographics by Single Mother Households
Demographics Similar to Yup'ik by Single Mother Households
In terms of single mother households, the demographic groups most similar to Yup'ik are Yuman (9.6%, a difference of 3.8%), Immigrants from Cabo Verde (9.6%, a difference of 4.4%), Immigrants from Dominican Republic (9.5%, a difference of 5.2%), Dominican (9.2%, a difference of 8.9%), and Menominee (9.2%, a difference of 9.2%).
| Demographics | Rating | Rank | Single Mother Households |
| Liberians | 0.0 /100 | #333 | Tragic 8.6% |
| Immigrants | Liberia | 0.0 /100 | #334 | Tragic 8.7% |
| Immigrants | Dominica | 0.0 /100 | #335 | Tragic 8.7% |
| Puerto Ricans | 0.0 /100 | #336 | Tragic 8.7% |
| Navajo | 0.0 /100 | #337 | Tragic 8.8% |
| Cape Verdeans | 0.0 /100 | #338 | Tragic 8.9% |
| Blacks/African Americans | 0.0 /100 | #339 | Tragic 9.0% |
| Lumbee | 0.0 /100 | #340 | Tragic 9.1% |
| Tohono O'odham | 0.0 /100 | #341 | Tragic 9.1% |
| Menominee | 0.0 /100 | #342 | Tragic 9.2% |
| Dominicans | 0.0 /100 | #343 | Tragic 9.2% |
| Immigrants | Dominican Republic | 0.0 /100 | #344 | Tragic 9.5% |
| Immigrants | Cabo Verde | 0.0 /100 | #345 | Tragic 9.6% |
| Yuman | 0.0 /100 | #346 | Tragic 9.6% |
| Yup'ik | 0.0 /100 | #347 | Tragic 10.0% |
Demographics Similar to Immigrants from Northern Africa by Single Mother Households
In terms of single mother households, the demographic groups most similar to Immigrants from Northern Africa are Immigrants from Syria (6.2%, a difference of 0.070%), Alsatian (6.2%, a difference of 0.090%), Immigrants from Zimbabwe (6.2%, a difference of 0.25%), Sri Lankan (6.2%, a difference of 0.50%), and Immigrants from Germany (6.1%, a difference of 0.60%).
| Demographics | Rating | Rank | Single Mother Households |
| Chileans | 74.2 /100 | #157 | Good 6.1% |
| Celtics | 73.3 /100 | #158 | Good 6.1% |
| Yugoslavians | 73.1 /100 | #159 | Good 6.1% |
| Iraqis | 73.0 /100 | #160 | Good 6.1% |
| Immigrants | Germany | 72.4 /100 | #161 | Good 6.1% |
| Immigrants | Zimbabwe | 69.9 /100 | #162 | Good 6.2% |
| Alsatians | 68.7 /100 | #163 | Good 6.2% |
| Immigrants | Northern Africa | 68.0 /100 | #164 | Good 6.2% |
| Immigrants | Syria | 67.4 /100 | #165 | Good 6.2% |
| Sri Lankans | 63.9 /100 | #166 | Good 6.2% |
| Brazilians | 59.1 /100 | #167 | Average 6.2% |
| Immigrants | Chile | 58.3 /100 | #168 | Average 6.3% |
| Puget Sound Salish | 58.1 /100 | #169 | Average 6.3% |
| Immigrants | Oceania | 54.6 /100 | #170 | Average 6.3% |
| Afghans | 52.5 /100 | #171 | Average 6.3% |