Yup'ik vs Dutch West Indian Single Mother Households
COMPARE
Yup'ik
Dutch West Indian
Single Mother Households
Single Mother Households Comparison
Yup'ik
Dutch West Indians
10.0%
SINGLE MOTHER HOUSEHOLDS
0.0/ 100
METRIC RATING
347th/ 347
METRIC RANK
7.3%
SINGLE MOTHER HOUSEHOLDS
0.4/ 100
METRIC RATING
247th/ 347
METRIC RANK
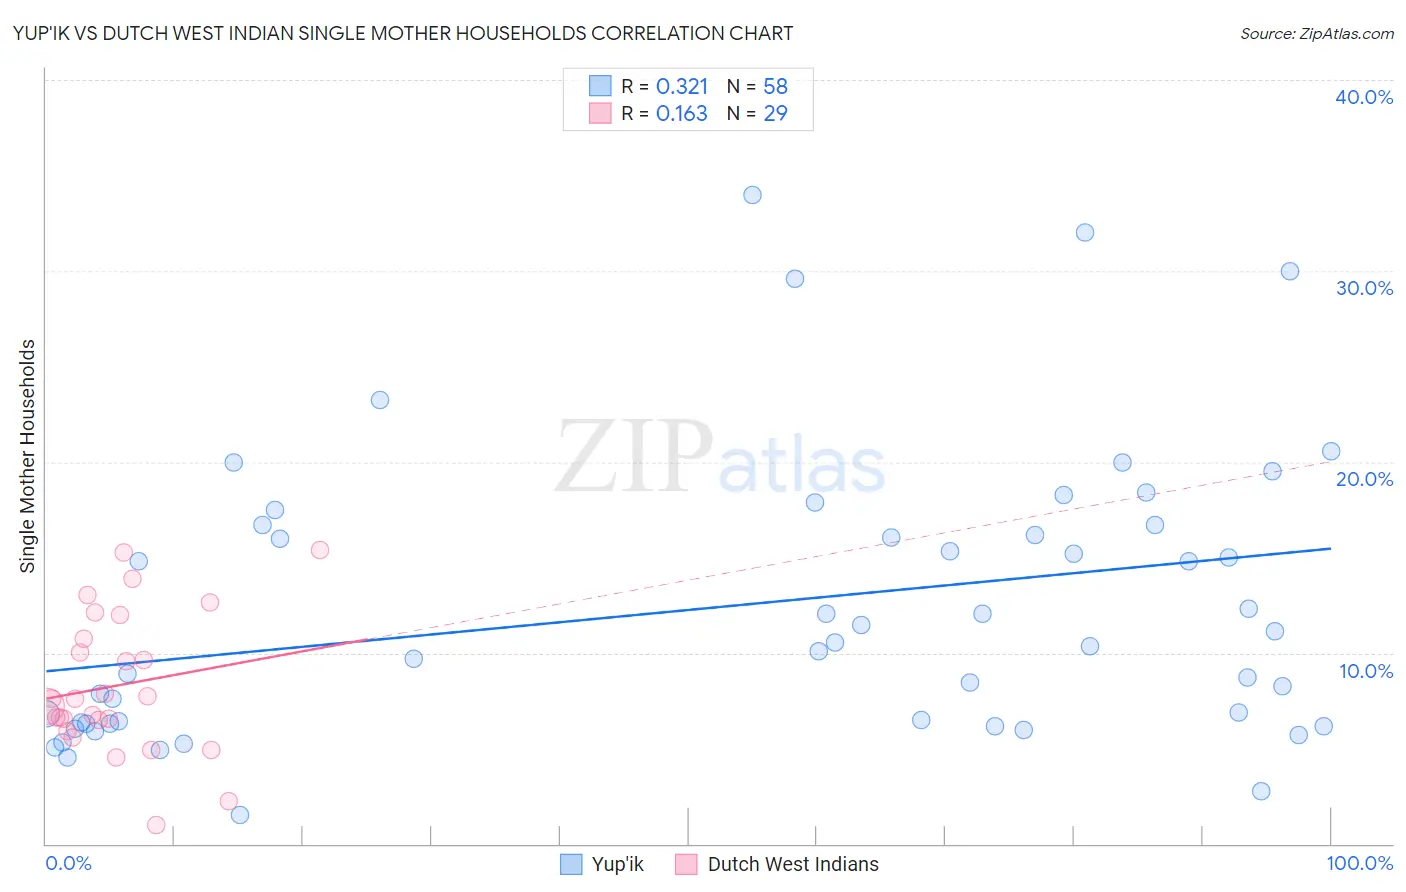
Yup'ik vs Dutch West Indian Single Mother Households Correlation Chart
The statistical analysis conducted on geographies consisting of 39,868,433 people shows a mild positive correlation between the proportion of Yup'ik and percentage of single mother households in the United States with a correlation coefficient (R) of 0.321 and weighted average of 10.0%. Similarly, the statistical analysis conducted on geographies consisting of 85,708,147 people shows a poor positive correlation between the proportion of Dutch West Indians and percentage of single mother households in the United States with a correlation coefficient (R) of 0.163 and weighted average of 7.3%, a difference of 37.8%.
Single Mother Households Correlation Summary
| Measurement | Yup'ik | Dutch West Indian |
| Minimum | 1.5% | 0.97% |
| Maximum | 34.0% | 15.4% |
| Range | 32.5% | 14.4% |
| Mean | 12.4% | 8.3% |
| Median | 10.4% | 7.6% |
| Interquartile 25% (IQ1) | 6.3% | 6.2% |
| Interquartile 75% (IQ3) | 16.7% | 11.3% |
| Interquartile Range (IQR) | 10.4% | 5.2% |
| Standard Deviation (Sample) | 7.4% | 3.6% |
| Standard Deviation (Population) | 7.4% | 3.6% |
Similar Demographics by Single Mother Households
Demographics Similar to Yup'ik by Single Mother Households
In terms of single mother households, the demographic groups most similar to Yup'ik are Yuman (9.6%, a difference of 3.8%), Immigrants from Cabo Verde (9.6%, a difference of 4.4%), Immigrants from Dominican Republic (9.5%, a difference of 5.2%), Dominican (9.2%, a difference of 8.9%), and Menominee (9.2%, a difference of 9.2%).
| Demographics | Rating | Rank | Single Mother Households |
| Liberians | 0.0 /100 | #333 | Tragic 8.6% |
| Immigrants | Liberia | 0.0 /100 | #334 | Tragic 8.7% |
| Immigrants | Dominica | 0.0 /100 | #335 | Tragic 8.7% |
| Puerto Ricans | 0.0 /100 | #336 | Tragic 8.7% |
| Navajo | 0.0 /100 | #337 | Tragic 8.8% |
| Cape Verdeans | 0.0 /100 | #338 | Tragic 8.9% |
| Blacks/African Americans | 0.0 /100 | #339 | Tragic 9.0% |
| Lumbee | 0.0 /100 | #340 | Tragic 9.1% |
| Tohono O'odham | 0.0 /100 | #341 | Tragic 9.1% |
| Menominee | 0.0 /100 | #342 | Tragic 9.2% |
| Dominicans | 0.0 /100 | #343 | Tragic 9.2% |
| Immigrants | Dominican Republic | 0.0 /100 | #344 | Tragic 9.5% |
| Immigrants | Cabo Verde | 0.0 /100 | #345 | Tragic 9.6% |
| Yuman | 0.0 /100 | #346 | Tragic 9.6% |
| Yup'ik | 0.0 /100 | #347 | Tragic 10.0% |
Demographics Similar to Dutch West Indians by Single Mother Households
In terms of single mother households, the demographic groups most similar to Dutch West Indians are Spanish American Indian (7.3%, a difference of 0.030%), Nicaraguan (7.2%, a difference of 0.25%), Bermudan (7.3%, a difference of 0.32%), Immigrants from Africa (7.3%, a difference of 0.33%), and Immigrants from Cambodia (7.2%, a difference of 0.43%).
| Demographics | Rating | Rank | Single Mother Households |
| Immigrants | Panama | 0.7 /100 | #240 | Tragic 7.2% |
| Immigrants | Portugal | 0.6 /100 | #241 | Tragic 7.2% |
| Fijians | 0.6 /100 | #242 | Tragic 7.2% |
| Ecuadorians | 0.6 /100 | #243 | Tragic 7.2% |
| Cubans | 0.6 /100 | #244 | Tragic 7.2% |
| Immigrants | Cambodia | 0.5 /100 | #245 | Tragic 7.2% |
| Nicaraguans | 0.5 /100 | #246 | Tragic 7.2% |
| Dutch West Indians | 0.4 /100 | #247 | Tragic 7.3% |
| Spanish American Indians | 0.4 /100 | #248 | Tragic 7.3% |
| Bermudans | 0.4 /100 | #249 | Tragic 7.3% |
| Immigrants | Africa | 0.4 /100 | #250 | Tragic 7.3% |
| Malaysians | 0.3 /100 | #251 | Tragic 7.3% |
| Alaskan Athabascans | 0.3 /100 | #252 | Tragic 7.3% |
| Cajuns | 0.3 /100 | #253 | Tragic 7.3% |
| Immigrants | Ecuador | 0.3 /100 | #254 | Tragic 7.3% |