Yugoslavian vs Latvian Family Households
COMPARE
Yugoslavian
Latvian
Family Households
Family Households Comparison
Yugoslavians
Latvians
63.1%
FAMILY HOUSEHOLDS
0.4/ 100
METRIC RATING
269th/ 347
METRIC RANK
62.8%
FAMILY HOUSEHOLDS
0.1/ 100
METRIC RATING
287th/ 347
METRIC RANK
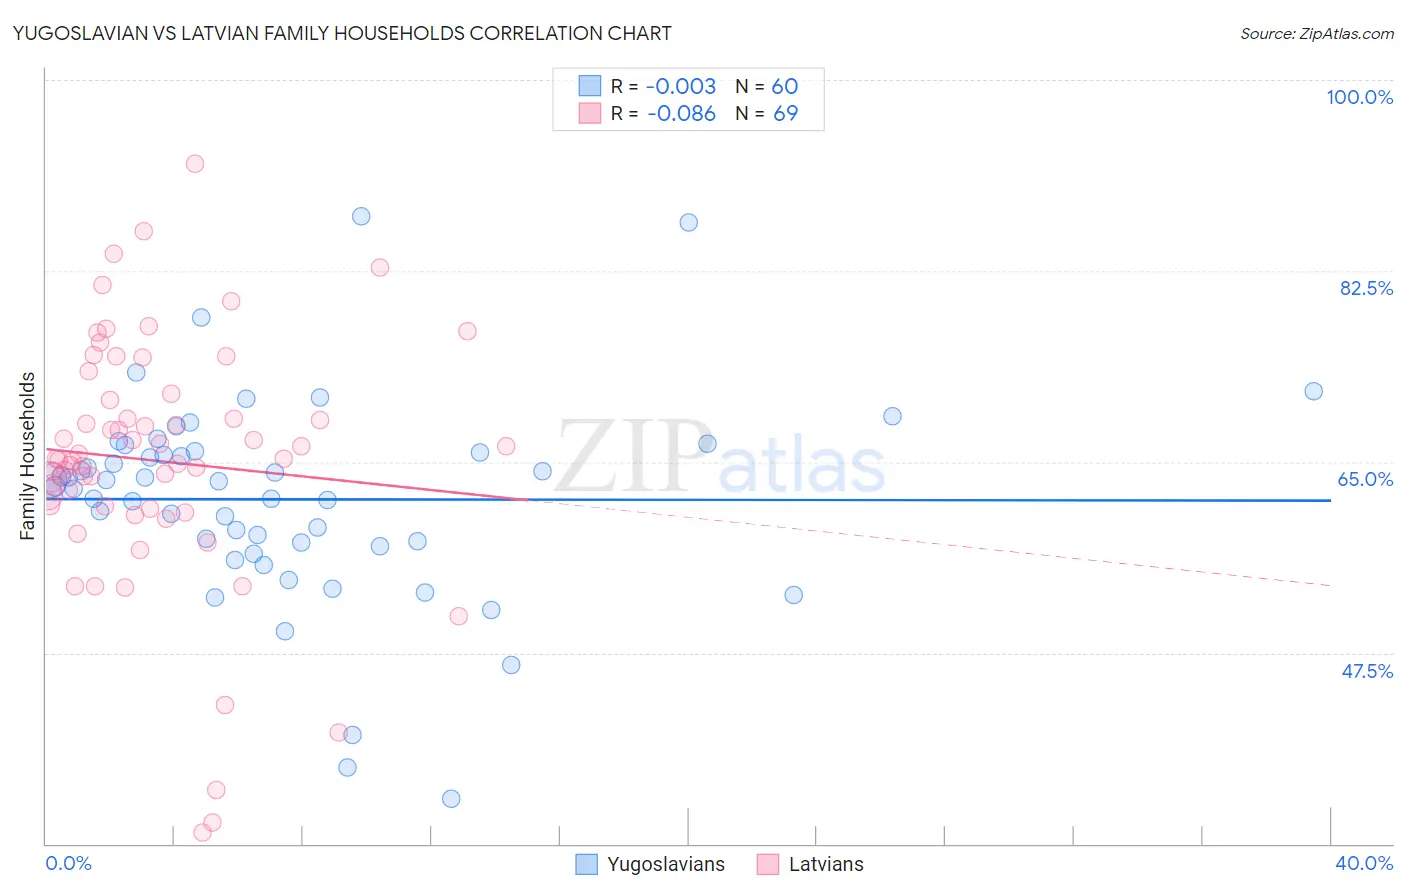
Yugoslavian vs Latvian Family Households Correlation Chart
The statistical analysis conducted on geographies consisting of 285,640,029 people shows no correlation between the proportion of Yugoslavians and percentage of family households in the United States with a correlation coefficient (R) of -0.003 and weighted average of 63.1%. Similarly, the statistical analysis conducted on geographies consisting of 220,652,081 people shows a slight negative correlation between the proportion of Latvians and percentage of family households in the United States with a correlation coefficient (R) of -0.086 and weighted average of 62.8%, a difference of 0.52%.
Family Households Correlation Summary
| Measurement | Yugoslavian | Latvian |
| Minimum | 34.1% | 31.0% |
| Maximum | 87.5% | 92.3% |
| Range | 53.4% | 61.3% |
| Mean | 61.6% | 65.1% |
| Median | 62.9% | 65.3% |
| Interquartile 25% (IQ1) | 57.5% | 60.8% |
| Interquartile 75% (IQ3) | 65.9% | 70.9% |
| Interquartile Range (IQR) | 8.5% | 10.1% |
| Standard Deviation (Sample) | 9.4% | 11.5% |
| Standard Deviation (Population) | 9.4% | 11.4% |
Demographics Similar to Yugoslavians and Latvians by Family Households
In terms of family households, the demographic groups most similar to Yugoslavians are Immigrants from Singapore (63.1%, a difference of 0.0%), Immigrants from Austria (63.1%, a difference of 0.020%), Immigrants from Croatia (63.1%, a difference of 0.030%), Immigrants from Turkey (63.1%, a difference of 0.030%), and Immigrants from Kazakhstan (63.1%, a difference of 0.040%). Similarly, the demographic groups most similar to Latvians are British West Indian (62.8%, a difference of 0.0%), Immigrants from Uganda (62.7%, a difference of 0.020%), Mongolian (62.8%, a difference of 0.030%), Australian (62.8%, a difference of 0.14%), and Immigrants from Denmark (62.9%, a difference of 0.18%).
| Demographics | Rating | Rank | Family Households |
| Immigrants | Singapore | 0.4 /100 | #268 | Tragic 63.1% |
| Yugoslavians | 0.4 /100 | #269 | Tragic 63.1% |
| Immigrants | Austria | 0.3 /100 | #270 | Tragic 63.1% |
| Immigrants | Croatia | 0.3 /100 | #271 | Tragic 63.1% |
| Immigrants | Turkey | 0.3 /100 | #272 | Tragic 63.1% |
| Immigrants | Kazakhstan | 0.3 /100 | #273 | Tragic 63.1% |
| Lumbee | 0.3 /100 | #274 | Tragic 63.1% |
| West Indians | 0.3 /100 | #275 | Tragic 63.1% |
| Serbians | 0.3 /100 | #276 | Tragic 63.0% |
| Ottawa | 0.3 /100 | #277 | Tragic 63.0% |
| Immigrants | Belgium | 0.2 /100 | #278 | Tragic 63.0% |
| Immigrants | Yemen | 0.2 /100 | #279 | Tragic 63.0% |
| Immigrants | Bulgaria | 0.2 /100 | #280 | Tragic 63.0% |
| Estonians | 0.2 /100 | #281 | Tragic 62.9% |
| New Zealanders | 0.1 /100 | #282 | Tragic 62.9% |
| Immigrants | Denmark | 0.1 /100 | #283 | Tragic 62.9% |
| Australians | 0.1 /100 | #284 | Tragic 62.8% |
| Mongolians | 0.1 /100 | #285 | Tragic 62.8% |
| British West Indians | 0.1 /100 | #286 | Tragic 62.8% |
| Latvians | 0.1 /100 | #287 | Tragic 62.8% |
| Immigrants | Uganda | 0.1 /100 | #288 | Tragic 62.7% |