White/Caucasian vs South African Single Father Households
COMPARE
White/Caucasian
South African
Single Father Households
Single Father Households Comparison
Whites/Caucasians
South Africans
2.4%
SINGLE FATHER HOUSEHOLDS
22.6/ 100
METRIC RATING
207th/ 347
METRIC RANK
2.1%
SINGLE FATHER HOUSEHOLDS
99.1/ 100
METRIC RATING
99th/ 347
METRIC RANK
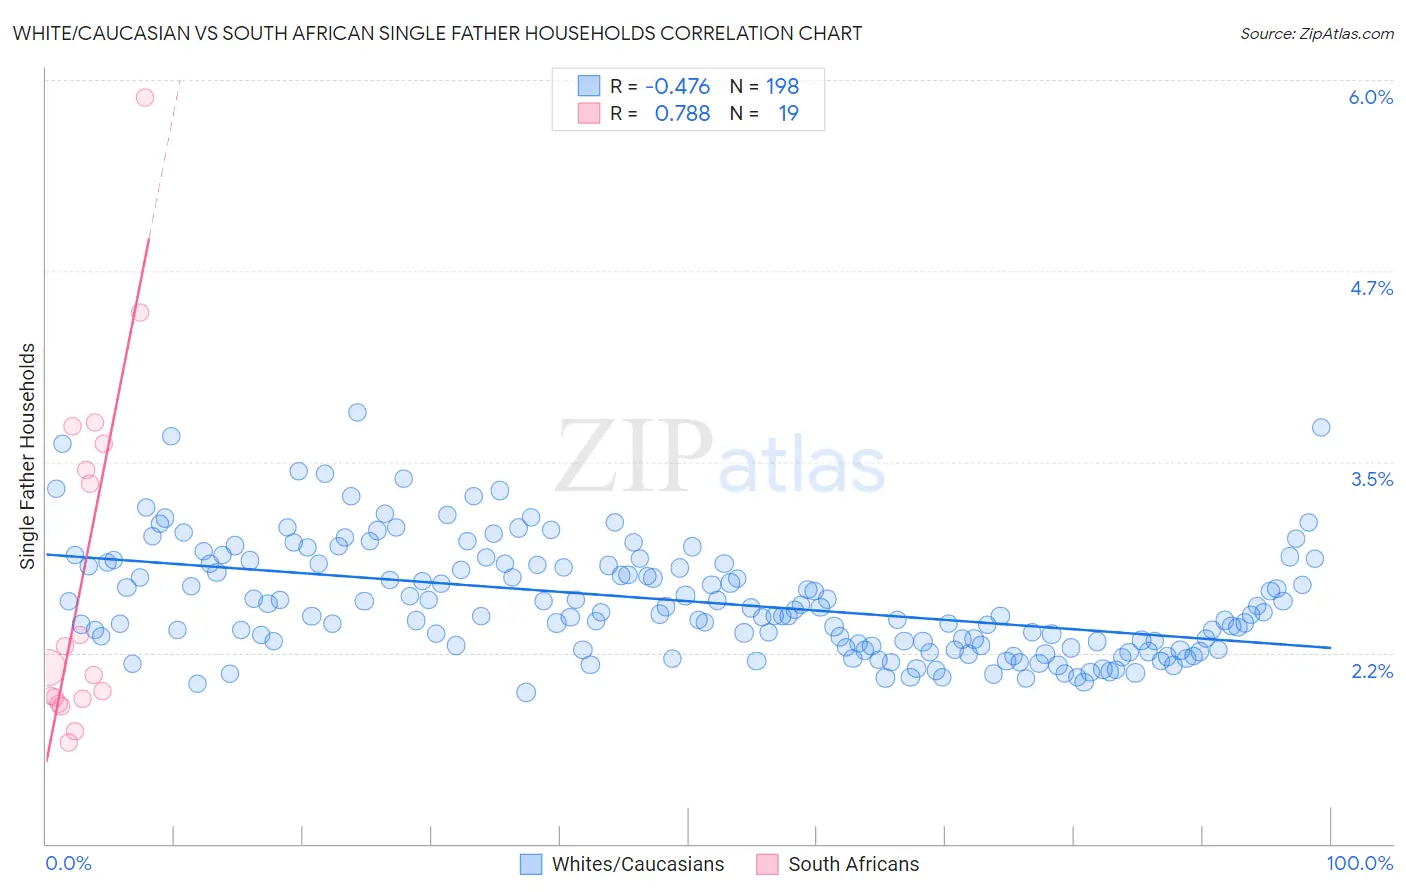
White/Caucasian vs South African Single Father Households Correlation Chart
The statistical analysis conducted on geographies consisting of 565,193,918 people shows a moderate negative correlation between the proportion of Whites/Caucasians and percentage of single father households in the United States with a correlation coefficient (R) of -0.476 and weighted average of 2.4%. Similarly, the statistical analysis conducted on geographies consisting of 181,721,596 people shows a strong positive correlation between the proportion of South Africans and percentage of single father households in the United States with a correlation coefficient (R) of 0.788 and weighted average of 2.1%, a difference of 11.8%.
Single Father Households Correlation Summary
| Measurement | White/Caucasian | South African |
| Minimum | 2.0% | 1.7% |
| Maximum | 3.8% | 5.9% |
| Range | 1.8% | 4.2% |
| Mean | 2.6% | 2.8% |
| Median | 2.5% | 2.2% |
| Interquartile 25% (IQ1) | 2.3% | 1.9% |
| Interquartile 75% (IQ3) | 2.8% | 3.6% |
| Interquartile Range (IQR) | 0.54% | 1.7% |
| Standard Deviation (Sample) | 0.37% | 1.1% |
| Standard Deviation (Population) | 0.37% | 1.1% |
Similar Demographics by Single Father Households
Demographics Similar to Whites/Caucasians by Single Father Households
In terms of single father households, the demographic groups most similar to Whites/Caucasians are Korean (2.4%, a difference of 0.15%), Immigrants from Afghanistan (2.4%, a difference of 0.16%), Ecuadorian (2.4%, a difference of 0.18%), French Canadian (2.4%, a difference of 0.21%), and Immigrants from Kenya (2.4%, a difference of 0.25%).
| Demographics | Rating | Rank | Single Father Households |
| Peruvians | 27.1 /100 | #200 | Fair 2.4% |
| Immigrants | Uganda | 26.0 /100 | #201 | Fair 2.4% |
| German Russians | 25.7 /100 | #202 | Fair 2.4% |
| French Canadians | 24.7 /100 | #203 | Fair 2.4% |
| Ecuadorians | 24.5 /100 | #204 | Fair 2.4% |
| Immigrants | Afghanistan | 24.2 /100 | #205 | Fair 2.4% |
| Koreans | 24.1 /100 | #206 | Fair 2.4% |
| Whites/Caucasians | 22.6 /100 | #207 | Fair 2.4% |
| Immigrants | Kenya | 20.3 /100 | #208 | Fair 2.4% |
| Immigrants | Peru | 19.3 /100 | #209 | Poor 2.4% |
| Immigrants | Costa Rica | 19.2 /100 | #210 | Poor 2.4% |
| Immigrants | Nigeria | 18.7 /100 | #211 | Poor 2.4% |
| Finns | 18.3 /100 | #212 | Poor 2.4% |
| Norwegians | 17.1 /100 | #213 | Poor 2.4% |
| Ethiopians | 16.6 /100 | #214 | Poor 2.4% |
Demographics Similar to South Africans by Single Father Households
In terms of single father households, the demographic groups most similar to South Africans are Guyanese (2.1%, a difference of 0.040%), Immigrants from Northern Africa (2.1%, a difference of 0.15%), Immigrants from Moldova (2.1%, a difference of 0.17%), Arab (2.1%, a difference of 0.30%), and Immigrants from Western Europe (2.1%, a difference of 0.30%).
| Demographics | Rating | Rank | Single Father Households |
| Romanians | 99.4 /100 | #92 | Exceptional 2.1% |
| Croatians | 99.3 /100 | #93 | Exceptional 2.1% |
| Ukrainians | 99.3 /100 | #94 | Exceptional 2.1% |
| Bermudans | 99.2 /100 | #95 | Exceptional 2.1% |
| Arabs | 99.2 /100 | #96 | Exceptional 2.1% |
| Immigrants | Moldova | 99.1 /100 | #97 | Exceptional 2.1% |
| Guyanese | 99.1 /100 | #98 | Exceptional 2.1% |
| South Africans | 99.1 /100 | #99 | Exceptional 2.1% |
| Immigrants | Northern Africa | 99.0 /100 | #100 | Exceptional 2.1% |
| Immigrants | Western Europe | 98.9 /100 | #101 | Exceptional 2.1% |
| Argentineans | 98.9 /100 | #102 | Exceptional 2.1% |
| Lebanese | 98.9 /100 | #103 | Exceptional 2.1% |
| Alsatians | 98.9 /100 | #104 | Exceptional 2.1% |
| Palestinians | 98.6 /100 | #105 | Exceptional 2.2% |
| Immigrants | Southern Europe | 98.6 /100 | #106 | Exceptional 2.2% |