White/Caucasian vs South African Associate's Degree
COMPARE
White/Caucasian
South African
Associate's Degree
Associate's Degree Comparison
Whites/Caucasians
South Africans
44.2%
ASSOCIATE'S DEGREE
7.5/ 100
METRIC RATING
219th/ 347
METRIC RANK
51.4%
ASSOCIATE'S DEGREE
99.7/ 100
METRIC RATING
63rd/ 347
METRIC RANK
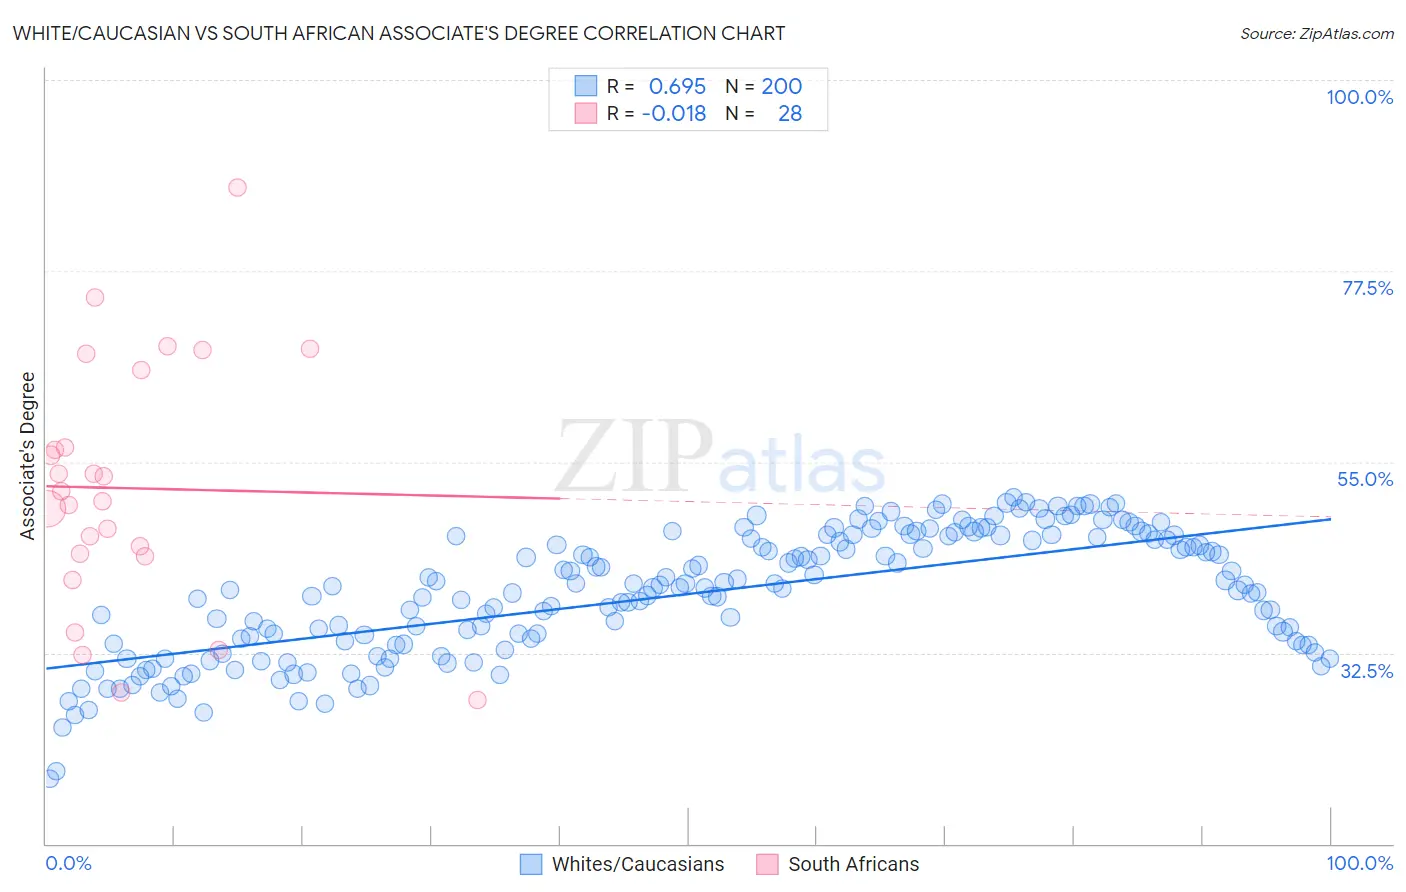
White/Caucasian vs South African Associate's Degree Correlation Chart
The statistical analysis conducted on geographies consisting of 584,984,374 people shows a significant positive correlation between the proportion of Whites/Caucasians and percentage of population with at least associate's degree education in the United States with a correlation coefficient (R) of 0.695 and weighted average of 44.2%. Similarly, the statistical analysis conducted on geographies consisting of 182,596,530 people shows no correlation between the proportion of South Africans and percentage of population with at least associate's degree education in the United States with a correlation coefficient (R) of -0.018 and weighted average of 51.4%, a difference of 16.3%.
Associate's Degree Correlation Summary
| Measurement | White/Caucasian | South African |
| Minimum | 17.7% | 26.9% |
| Maximum | 50.8% | 87.3% |
| Range | 33.1% | 60.4% |
| Mean | 39.4% | 51.9% |
| Median | 40.2% | 50.9% |
| Interquartile 25% (IQ1) | 33.5% | 44.0% |
| Interquartile 75% (IQ3) | 46.2% | 61.2% |
| Interquartile Range (IQR) | 12.6% | 17.3% |
| Standard Deviation (Sample) | 7.3% | 14.5% |
| Standard Deviation (Population) | 7.3% | 14.2% |
Similar Demographics by Associate's Degree
Demographics Similar to Whites/Caucasians by Associate's Degree
In terms of associate's degree, the demographic groups most similar to Whites/Caucasians are Portuguese (44.1%, a difference of 0.070%), Immigrants from Western Africa (44.1%, a difference of 0.27%), Spanish (44.4%, a difference of 0.48%), Barbadian (43.9%, a difference of 0.54%), and Subsaharan African (43.9%, a difference of 0.64%).
| Demographics | Rating | Rank | Associate's Degree |
| French Canadians | 15.0 /100 | #212 | Poor 44.9% |
| Immigrants | Ghana | 14.2 /100 | #213 | Poor 44.8% |
| Immigrants | Middle Africa | 12.7 /100 | #214 | Poor 44.7% |
| Immigrants | Panama | 12.4 /100 | #215 | Poor 44.7% |
| Immigrants | Nigeria | 11.4 /100 | #216 | Poor 44.6% |
| Immigrants | Immigrants | 10.5 /100 | #217 | Poor 44.5% |
| Spanish | 9.4 /100 | #218 | Tragic 44.4% |
| Whites/Caucasians | 7.5 /100 | #219 | Tragic 44.2% |
| Portuguese | 7.2 /100 | #220 | Tragic 44.1% |
| Immigrants | Western Africa | 6.6 /100 | #221 | Tragic 44.1% |
| Barbadians | 5.8 /100 | #222 | Tragic 43.9% |
| Sub-Saharan Africans | 5.5 /100 | #223 | Tragic 43.9% |
| West Indians | 5.2 /100 | #224 | Tragic 43.8% |
| Guamanians/Chamorros | 4.8 /100 | #225 | Tragic 43.8% |
| Immigrants | Burma/Myanmar | 4.3 /100 | #226 | Tragic 43.7% |
Demographics Similar to South Africans by Associate's Degree
In terms of associate's degree, the demographic groups most similar to South Africans are Bhutanese (51.4%, a difference of 0.050%), Immigrants from Kazakhstan (51.4%, a difference of 0.060%), Immigrants from Netherlands (51.4%, a difference of 0.070%), Zimbabwean (51.3%, a difference of 0.10%), and Immigrants from Europe (51.3%, a difference of 0.16%).
| Demographics | Rating | Rank | Associate's Degree |
| Immigrants | Czechoslovakia | 99.8 /100 | #56 | Exceptional 51.9% |
| Paraguayans | 99.8 /100 | #57 | Exceptional 51.8% |
| New Zealanders | 99.8 /100 | #58 | Exceptional 51.8% |
| Immigrants | Serbia | 99.8 /100 | #59 | Exceptional 51.7% |
| Immigrants | Bolivia | 99.7 /100 | #60 | Exceptional 51.5% |
| Immigrants | Kazakhstan | 99.7 /100 | #61 | Exceptional 51.4% |
| Bhutanese | 99.7 /100 | #62 | Exceptional 51.4% |
| South Africans | 99.7 /100 | #63 | Exceptional 51.4% |
| Immigrants | Netherlands | 99.7 /100 | #64 | Exceptional 51.4% |
| Zimbabweans | 99.7 /100 | #65 | Exceptional 51.3% |
| Immigrants | Europe | 99.7 /100 | #66 | Exceptional 51.3% |
| Argentineans | 99.6 /100 | #67 | Exceptional 51.2% |
| Immigrants | Indonesia | 99.5 /100 | #68 | Exceptional 51.0% |
| Egyptians | 99.5 /100 | #69 | Exceptional 50.9% |
| Immigrants | Argentina | 99.5 /100 | #70 | Exceptional 50.9% |