Ute vs Basque Births to Unmarried Women
COMPARE
Ute
Basque
Births to Unmarried Women
Births to Unmarried Women Comparison
Ute
Basques
33.0%
BIRTHS TO UNMARRIED WOMEN
14.4/ 100
METRIC RATING
203rd/ 347
METRIC RANK
29.7%
BIRTHS TO UNMARRIED WOMEN
93.0/ 100
METRIC RATING
112th/ 347
METRIC RANK
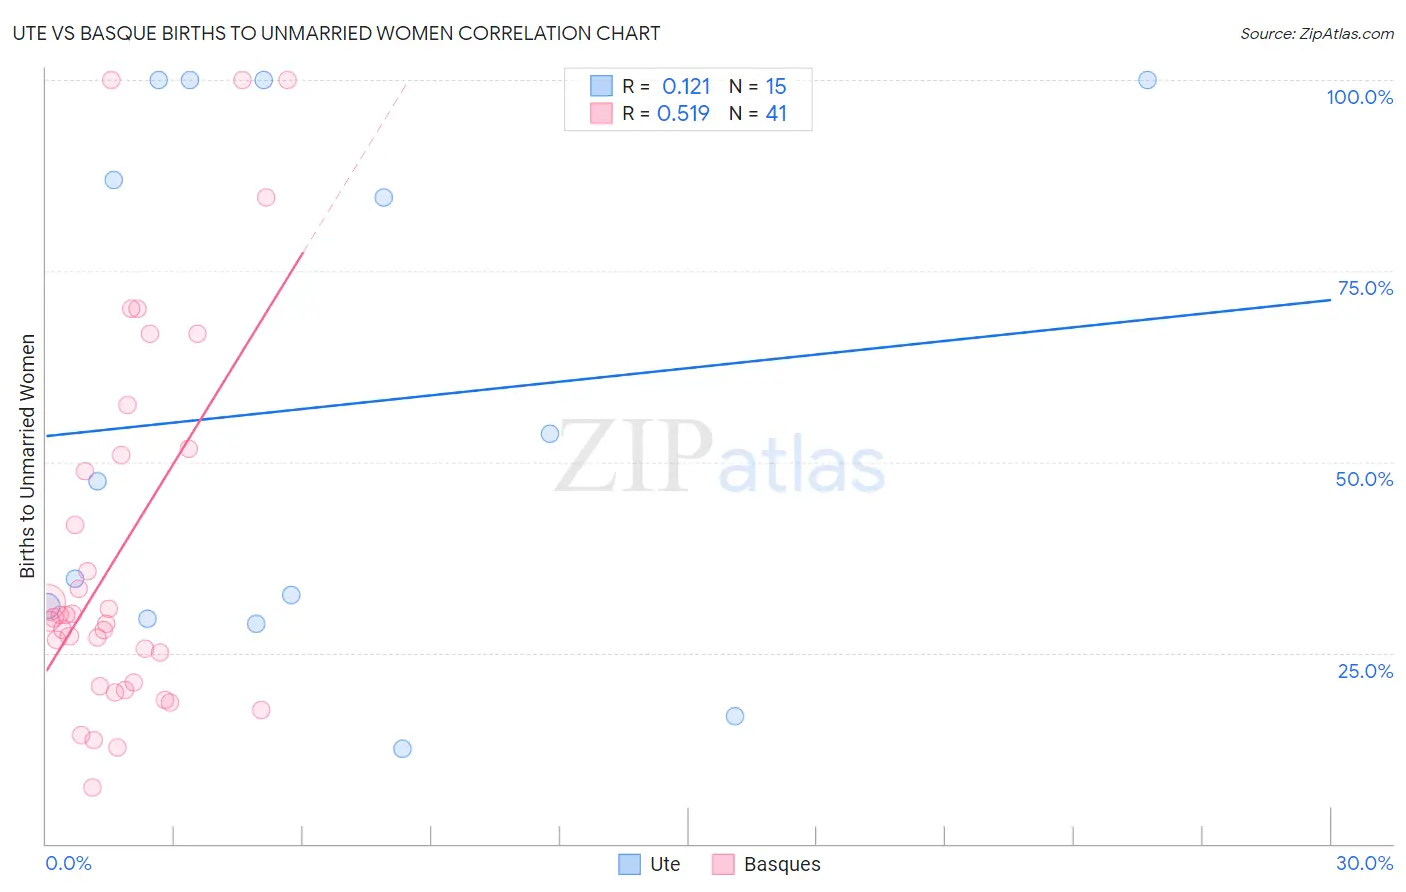
Ute vs Basque Births to Unmarried Women Correlation Chart
The statistical analysis conducted on geographies consisting of 54,718,542 people shows a poor positive correlation between the proportion of Ute and percentage of births to unmarried women in the United States with a correlation coefficient (R) of 0.121 and weighted average of 33.0%. Similarly, the statistical analysis conducted on geographies consisting of 159,478,325 people shows a substantial positive correlation between the proportion of Basques and percentage of births to unmarried women in the United States with a correlation coefficient (R) of 0.519 and weighted average of 29.7%, a difference of 11.0%.
Births to Unmarried Women Correlation Summary
| Measurement | Ute | Basque |
| Minimum | 12.5% | 7.4% |
| Maximum | 100.0% | 100.0% |
| Range | 87.5% | 92.6% |
| Mean | 57.2% | 38.8% |
| Median | 47.5% | 29.6% |
| Interquartile 25% (IQ1) | 29.4% | 20.9% |
| Interquartile 75% (IQ3) | 100.0% | 51.3% |
| Interquartile Range (IQR) | 70.6% | 30.5% |
| Standard Deviation (Sample) | 33.9% | 24.9% |
| Standard Deviation (Population) | 32.7% | 24.6% |
Similar Demographics by Births to Unmarried Women
Demographics Similar to Ute by Births to Unmarried Women
In terms of births to unmarried women, the demographic groups most similar to Ute are Immigrants from Africa (33.0%, a difference of 0.020%), German Russian (33.1%, a difference of 0.25%), Uruguayan (33.1%, a difference of 0.31%), Immigrants from Micronesia (32.9%, a difference of 0.38%), and Immigrants from Burma/Myanmar (32.9%, a difference of 0.39%).
| Demographics | Rating | Rank | Births to Unmarried Women |
| Immigrants | Colombia | 21.7 /100 | #196 | Fair 32.6% |
| Immigrants | Immigrants | 20.6 /100 | #197 | Fair 32.7% |
| Costa Ricans | 20.3 /100 | #198 | Fair 32.7% |
| Immigrants | Thailand | 18.9 /100 | #199 | Poor 32.8% |
| Immigrants | Germany | 18.8 /100 | #200 | Poor 32.8% |
| Immigrants | Burma/Myanmar | 16.7 /100 | #201 | Poor 32.9% |
| Immigrants | Micronesia | 16.6 /100 | #202 | Poor 32.9% |
| Ute | 14.4 /100 | #203 | Poor 33.0% |
| Immigrants | Africa | 14.3 /100 | #204 | Poor 33.0% |
| German Russians | 13.1 /100 | #205 | Poor 33.1% |
| Uruguayans | 12.8 /100 | #206 | Poor 33.1% |
| Immigrants | Sudan | 11.5 /100 | #207 | Poor 33.2% |
| Hawaiians | 11.3 /100 | #208 | Poor 33.2% |
| Whites/Caucasians | 10.7 /100 | #209 | Poor 33.3% |
| Scotch-Irish | 10.7 /100 | #210 | Poor 33.3% |
Demographics Similar to Basques by Births to Unmarried Women
In terms of births to unmarried women, the demographic groups most similar to Basques are Immigrants from Hungary (29.7%, a difference of 0.010%), Scandinavian (29.8%, a difference of 0.10%), Immigrants from Ethiopia (29.7%, a difference of 0.15%), Immigrants from Croatia (29.8%, a difference of 0.16%), and Greek (29.7%, a difference of 0.18%).
| Demographics | Rating | Rank | Births to Unmarried Women |
| Immigrants | Nepal | 94.3 /100 | #105 | Exceptional 29.6% |
| Swedes | 93.8 /100 | #106 | Exceptional 29.6% |
| Immigrants | Brazil | 93.7 /100 | #107 | Exceptional 29.6% |
| Paraguayans | 93.5 /100 | #108 | Exceptional 29.7% |
| Greeks | 93.4 /100 | #109 | Exceptional 29.7% |
| Immigrants | Ethiopia | 93.4 /100 | #110 | Exceptional 29.7% |
| Immigrants | Hungary | 93.0 /100 | #111 | Exceptional 29.7% |
| Basques | 93.0 /100 | #112 | Exceptional 29.7% |
| Scandinavians | 92.7 /100 | #113 | Exceptional 29.8% |
| Immigrants | Croatia | 92.6 /100 | #114 | Exceptional 29.8% |
| Ethiopians | 91.9 /100 | #115 | Exceptional 29.8% |
| Immigrants | Italy | 91.7 /100 | #116 | Exceptional 29.9% |
| Immigrants | Netherlands | 91.1 /100 | #117 | Exceptional 29.9% |
| Immigrants | Norway | 91.0 /100 | #118 | Exceptional 29.9% |
| Argentineans | 90.5 /100 | #119 | Exceptional 30.0% |