Immigrants from Hungary vs Basque Births to Unmarried Women
COMPARE
Immigrants from Hungary
Basque
Births to Unmarried Women
Births to Unmarried Women Comparison
Immigrants from Hungary
Basques
29.7%
BIRTHS TO UNMARRIED WOMEN
93.0/ 100
METRIC RATING
111th/ 347
METRIC RANK
29.7%
BIRTHS TO UNMARRIED WOMEN
93.0/ 100
METRIC RATING
112th/ 347
METRIC RANK
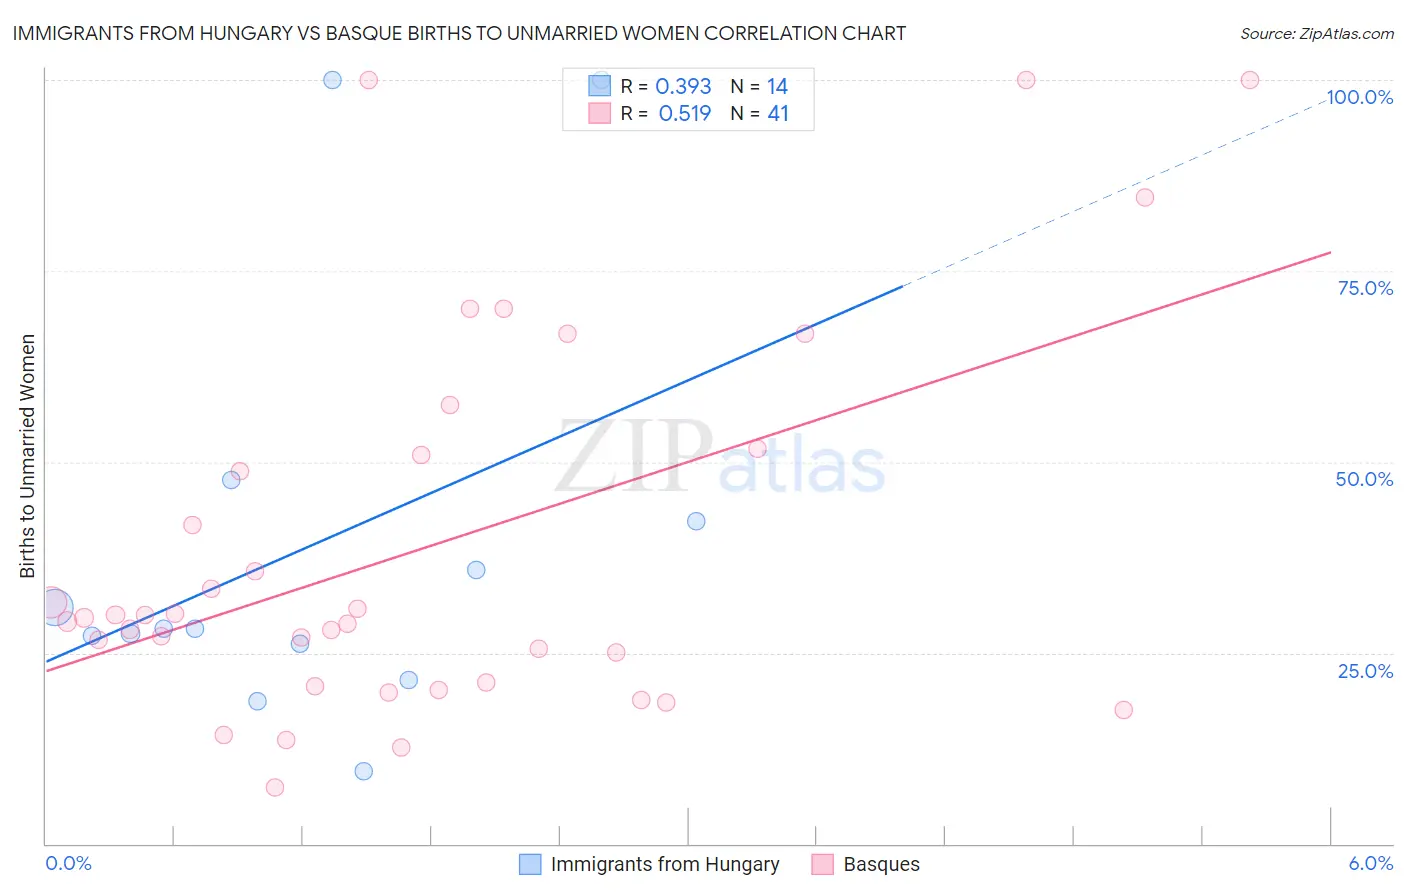
Immigrants from Hungary vs Basque Births to Unmarried Women Correlation Chart
The statistical analysis conducted on geographies consisting of 185,461,486 people shows a mild positive correlation between the proportion of Immigrants from Hungary and percentage of births to unmarried women in the United States with a correlation coefficient (R) of 0.393 and weighted average of 29.7%. Similarly, the statistical analysis conducted on geographies consisting of 159,478,325 people shows a substantial positive correlation between the proportion of Basques and percentage of births to unmarried women in the United States with a correlation coefficient (R) of 0.519 and weighted average of 29.7%, a difference of 0.010%.
Births to Unmarried Women Correlation Summary
| Measurement | Immigrants from Hungary | Basque |
| Minimum | 9.5% | 7.4% |
| Maximum | 100.0% | 100.0% |
| Range | 90.5% | 92.6% |
| Mean | 38.8% | 38.8% |
| Median | 28.2% | 29.6% |
| Interquartile 25% (IQ1) | 26.2% | 20.9% |
| Interquartile 75% (IQ3) | 42.2% | 51.3% |
| Interquartile Range (IQR) | 16.0% | 30.5% |
| Standard Deviation (Sample) | 27.5% | 24.9% |
| Standard Deviation (Population) | 26.5% | 24.6% |
Demographics Similar to Immigrants from Hungary and Basques by Births to Unmarried Women
In terms of births to unmarried women, the demographic groups most similar to Immigrants from Hungary are Scandinavian (29.8%, a difference of 0.11%), Immigrants from Ethiopia (29.7%, a difference of 0.14%), Greek (29.7%, a difference of 0.16%), Immigrants from Croatia (29.8%, a difference of 0.17%), and Paraguayan (29.7%, a difference of 0.20%). Similarly, the demographic groups most similar to Basques are Scandinavian (29.8%, a difference of 0.10%), Immigrants from Ethiopia (29.7%, a difference of 0.15%), Immigrants from Croatia (29.8%, a difference of 0.16%), Greek (29.7%, a difference of 0.18%), and Paraguayan (29.7%, a difference of 0.22%).
| Demographics | Rating | Rank | Births to Unmarried Women |
| Immigrants | Northern Africa | 94.7 /100 | #101 | Exceptional 29.5% |
| Australians | 94.6 /100 | #102 | Exceptional 29.5% |
| Lebanese | 94.4 /100 | #103 | Exceptional 29.5% |
| Lithuanians | 94.4 /100 | #104 | Exceptional 29.6% |
| Immigrants | Nepal | 94.3 /100 | #105 | Exceptional 29.6% |
| Swedes | 93.8 /100 | #106 | Exceptional 29.6% |
| Immigrants | Brazil | 93.7 /100 | #107 | Exceptional 29.6% |
| Paraguayans | 93.5 /100 | #108 | Exceptional 29.7% |
| Greeks | 93.4 /100 | #109 | Exceptional 29.7% |
| Immigrants | Ethiopia | 93.4 /100 | #110 | Exceptional 29.7% |
| Immigrants | Hungary | 93.0 /100 | #111 | Exceptional 29.7% |
| Basques | 93.0 /100 | #112 | Exceptional 29.7% |
| Scandinavians | 92.7 /100 | #113 | Exceptional 29.8% |
| Immigrants | Croatia | 92.6 /100 | #114 | Exceptional 29.8% |
| Ethiopians | 91.9 /100 | #115 | Exceptional 29.8% |
| Immigrants | Italy | 91.7 /100 | #116 | Exceptional 29.9% |
| Immigrants | Netherlands | 91.1 /100 | #117 | Exceptional 29.9% |
| Immigrants | Norway | 91.0 /100 | #118 | Exceptional 29.9% |
| Argentineans | 90.5 /100 | #119 | Exceptional 30.0% |
| Ugandans | 89.2 /100 | #120 | Excellent 30.1% |
| Koreans | 88.9 /100 | #121 | Excellent 30.1% |