Tsimshian vs Immigrants from South Central Asia Divorced or Separated
COMPARE
Tsimshian
Immigrants from South Central Asia
Divorced or Separated
Divorced or Separated Comparison
Tsimshian
Immigrants from South Central Asia
13.3%
DIVORCED OR SEPARATED
0.0/ 100
METRIC RATING
316th/ 347
METRIC RANK
10.4%
DIVORCED OR SEPARATED
100.0/ 100
METRIC RATING
11th/ 347
METRIC RANK
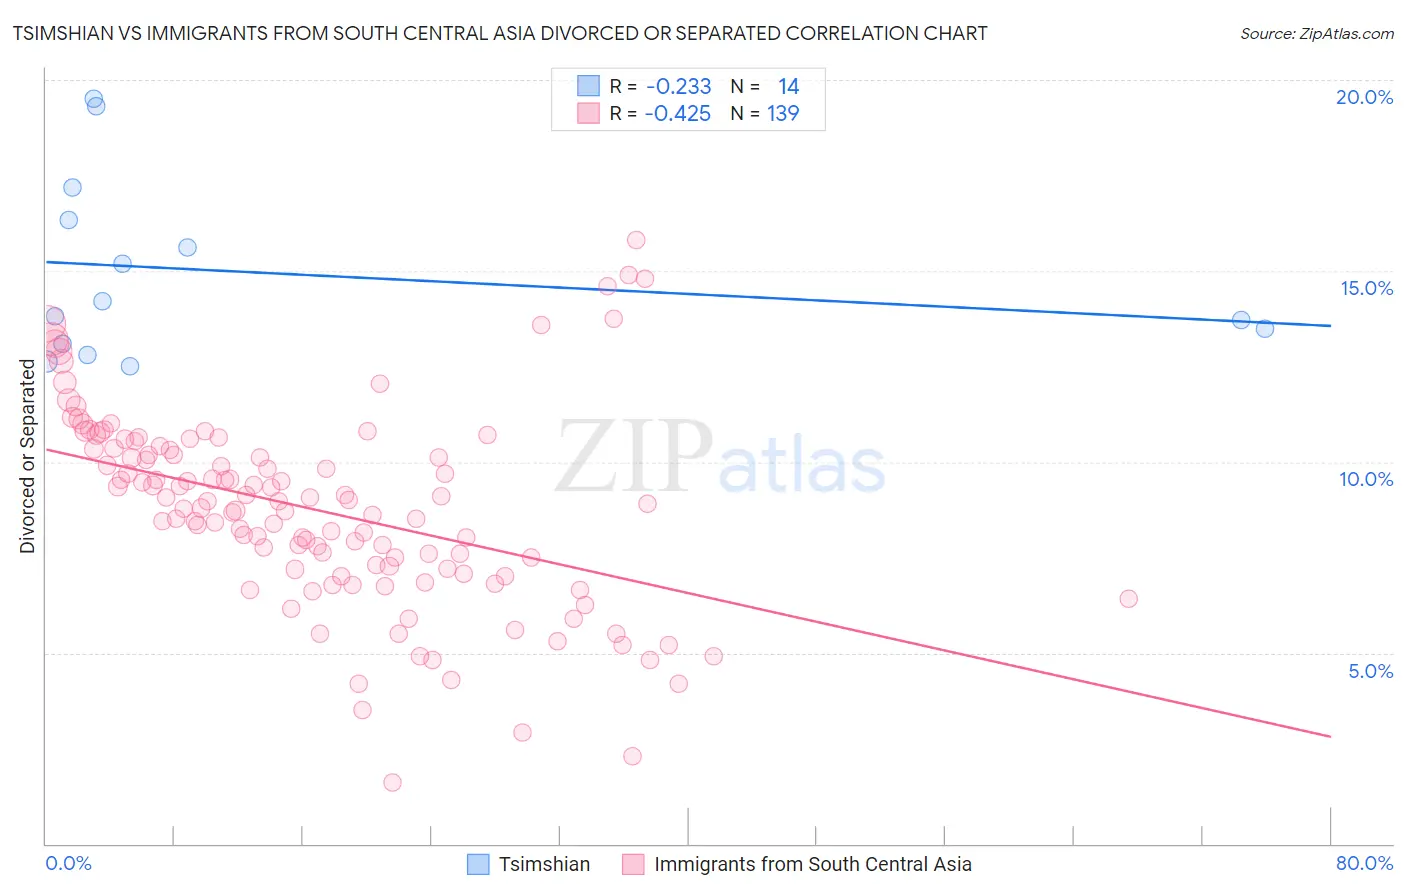
Tsimshian vs Immigrants from South Central Asia Divorced or Separated Correlation Chart
The statistical analysis conducted on geographies consisting of 15,626,183 people shows a weak negative correlation between the proportion of Tsimshian and percentage of population currently divorced or separated in the United States with a correlation coefficient (R) of -0.233 and weighted average of 13.3%. Similarly, the statistical analysis conducted on geographies consisting of 472,795,215 people shows a moderate negative correlation between the proportion of Immigrants from South Central Asia and percentage of population currently divorced or separated in the United States with a correlation coefficient (R) of -0.425 and weighted average of 10.4%, a difference of 27.9%.
Divorced or Separated Correlation Summary
| Measurement | Tsimshian | Immigrants from South Central Asia |
| Minimum | 12.5% | 1.6% |
| Maximum | 19.5% | 15.8% |
| Range | 7.0% | 14.2% |
| Mean | 15.0% | 8.8% |
| Median | 14.0% | 8.9% |
| Interquartile 25% (IQ1) | 13.1% | 7.2% |
| Interquartile 75% (IQ3) | 16.3% | 10.3% |
| Interquartile Range (IQR) | 3.2% | 3.2% |
| Standard Deviation (Sample) | 2.4% | 2.6% |
| Standard Deviation (Population) | 2.3% | 2.6% |
Similar Demographics by Divorced or Separated
Demographics Similar to Tsimshian by Divorced or Separated
In terms of divorced or separated, the demographic groups most similar to Tsimshian are Haitian (13.3%, a difference of 0.020%), Spanish American (13.3%, a difference of 0.030%), Cree (13.4%, a difference of 0.050%), Puget Sound Salish (13.4%, a difference of 0.080%), and Cajun (13.4%, a difference of 0.14%).
| Demographics | Rating | Rank | Divorced or Separated |
| Americans | 0.0 /100 | #309 | Tragic 13.2% |
| Africans | 0.0 /100 | #310 | Tragic 13.2% |
| Sioux | 0.0 /100 | #311 | Tragic 13.2% |
| Blackfeet | 0.0 /100 | #312 | Tragic 13.3% |
| Immigrants | Nicaragua | 0.0 /100 | #313 | Tragic 13.3% |
| Yaqui | 0.0 /100 | #314 | Tragic 13.3% |
| Spanish Americans | 0.0 /100 | #315 | Tragic 13.3% |
| Tsimshian | 0.0 /100 | #316 | Tragic 13.3% |
| Haitians | 0.0 /100 | #317 | Tragic 13.3% |
| Cree | 0.0 /100 | #318 | Tragic 13.4% |
| Puget Sound Salish | 0.0 /100 | #319 | Tragic 13.4% |
| Cajuns | 0.0 /100 | #320 | Tragic 13.4% |
| Cheyenne | 0.0 /100 | #321 | Tragic 13.4% |
| Immigrants | Haiti | 0.0 /100 | #322 | Tragic 13.4% |
| U.S. Virgin Islanders | 0.0 /100 | #323 | Tragic 13.4% |
Demographics Similar to Immigrants from South Central Asia by Divorced or Separated
In terms of divorced or separated, the demographic groups most similar to Immigrants from South Central Asia are Okinawan (10.5%, a difference of 0.34%), Cypriot (10.5%, a difference of 0.49%), Immigrants from Singapore (10.3%, a difference of 0.91%), Assyrian/Chaldean/Syriac (10.6%, a difference of 1.2%), and Immigrants from Armenia (10.6%, a difference of 1.3%).
| Demographics | Rating | Rank | Divorced or Separated |
| Immigrants | China | 100.0 /100 | #4 | Exceptional 10.0% |
| Immigrants | India | 100.0 /100 | #5 | Exceptional 10.1% |
| Indians (Asian) | 100.0 /100 | #6 | Exceptional 10.2% |
| Thais | 100.0 /100 | #7 | Exceptional 10.2% |
| Immigrants | Eastern Asia | 100.0 /100 | #8 | Exceptional 10.2% |
| Yup'ik | 100.0 /100 | #9 | Exceptional 10.3% |
| Immigrants | Singapore | 100.0 /100 | #10 | Exceptional 10.3% |
| Immigrants | South Central Asia | 100.0 /100 | #11 | Exceptional 10.4% |
| Okinawans | 100.0 /100 | #12 | Exceptional 10.5% |
| Cypriots | 100.0 /100 | #13 | Exceptional 10.5% |
| Assyrians/Chaldeans/Syriacs | 100.0 /100 | #14 | Exceptional 10.6% |
| Immigrants | Armenia | 100.0 /100 | #15 | Exceptional 10.6% |
| Immigrants | Korea | 100.0 /100 | #16 | Exceptional 10.6% |
| Immigrants | Israel | 100.0 /100 | #17 | Exceptional 10.6% |
| Immigrants | Iran | 100.0 /100 | #18 | Exceptional 10.6% |