Tsimshian vs Immigrants from Burma/Myanmar Single Father Households

COMPARE

Tsimshian
Race
Ancestry
AfghanAfricanAlaska NativeAlaskan AthabascanAlbanianAleutAlsatianAmericanApacheArabArapahoArgentineanArmenianAssyrian/Chaldean/SyriacAustralianAustrianBahamianBangladeshiBarbadianBasqueBelgianBelizeanBermudanBhutaneseBlackfeetBolivianBrazilianBritishBritish West IndianBulgarianBurmeseCajunCambodianCanadianCape VerdeanCarpatho RusynCelticCentral AmericanCentral American IndianCherokeeCheyenneChickasawChileanChineseChippewaChoctawColombianColvilleComancheCosta RicanCreeCreekCroatianCrowCubanCypriotCzechCzechoslovakianDanishDelawareDominicanDutchDutch West IndianEastern EuropeanEcuadorianEgyptianEnglishEstonianEthiopianEuropeanFijianFilipinoFinnishFrenchFrench American IndianFrench CanadianGermanGerman RussianGhanaianGreekGuamanian/ChamorroGuatemalanGuyaneseHaitianHmongHonduranHopiHoumaHungarianIcelanderIndian (Asian)IndonesianInupiatIranianIraqiIrishIroquoisIsraeliItalianJamaicanJapaneseJordanianKenyanKiowaKoreanLaotianLatvianLebaneseLiberianLithuanianLumbeeLuxembourgerMacedonianMalaysianMalteseMarshalleseMenomineeMexicanMexican American IndianMongolianMoroccanNative HawaiianNavajoNepaleseNew ZealanderNicaraguanNigerianNorthern EuropeanNorwegianOkinawanOsageOttawaPaiutePakistaniPalestinianPanamanianParaguayanPennsylvania GermanPeruvianPimaPolishPortuguesePotawatomiPuebloPuerto RicanPuget Sound SalishRomanianRussianSalvadoranSamoanScandinavianScotch-IrishScottishSeminoleSenegaleseSerbianShoshoneSierra LeoneanSiouxSlavicSlovakSloveneSomaliSouth AfricanSouth AmericanSouth American IndianSoviet UnionSpaniardSpanishSpanish AmericanSpanish American IndianSri LankanSubsaharan AfricanSudaneseSwedishSwissSyrianTaiwaneseThaiTlingit-HaidaTohono O'OdhamTonganTrinidadian and TobagonianTsimshianTurkishU.S. Virgin IslanderUgandanUkrainianUruguayanUteVenezuelanVietnameseWelshWest IndianYakamaYaquiYugoslavianYumanYup'ikZimbabwean
Immigration
NonimmigrantsImmigrantsAfghanistanAfricaAlbaniaArgentinaArmeniaAsiaAustraliaAustriaBahamasBangladeshBarbadosBelarusBelgiumBelizeBoliviaBosnia and HerzegovinaBrazilBulgariaCabo VerdeCambodiaCameroonCanadaCaribbeanCentral AmericaChileChinaColombiaCongoCosta RicaCroatiaCubaCzechoslovakiaDenmarkDominicaDominican RepublicEastern AfricaEastern AsiaEastern EuropeEcuadorEgyptEl SalvadorEnglandEritreaEthiopiaEuropeFijiFranceGermanyGhanaGreeceGrenadaGuatemalaGuyanaHaitiHondurasHong KongHungaryIndiaIndonesiaIranIraqIrelandIsraelItalyJamaicaJapanJordanKazakhstanKenyaKoreaKuwaitLaosLatin AmericaLatviaLebanonLiberiaLithuaniaMalaysiaMexicoMicronesiaMiddle AfricaMoldovaMoroccoNepalNetherlandsNicaraguaNigeriaNorth AmericaNorth MacedoniaNorthern AfricaNorthern EuropeNorwayOceaniaPakistanPanamaPeruPhilippinesPolandPortugalRomaniaRussiaSaudi ArabiaScotlandSenegalSerbiaSierra LeoneSingaporeSomaliaSouth AfricaSouth AmericaSouth Central AsiaSouth Eastern AsiaSouthern EuropeSpainSri LankaSt. Vincent and the GrenadinesSudanSwedenSwitzerlandSyriaTaiwanThailandTrinidad and TobagoTurkeyUgandaUkraineUruguayUzbekistanVenezuelaVietnamWest IndiesWestern AfricaWestern AsiaWestern EuropeYemenZaireZimbabweAzores
Immigrants from Burma/Myanmar
Race
Ancestry
AfghanAfricanAlaska NativeAlaskan AthabascanAlbanianAleutAlsatianAmericanApacheArabArapahoArgentineanArmenianAssyrian/Chaldean/SyriacAustralianAustrianBahamianBangladeshiBarbadianBasqueBelgianBelizeanBermudanBhutaneseBlackfeetBolivianBrazilianBritishBritish West IndianBulgarianBurmeseCajunCambodianCanadianCape VerdeanCarpatho RusynCelticCentral AmericanCentral American IndianCherokeeCheyenneChickasawChileanChineseChippewaChoctawColombianColvilleComancheCosta RicanCreeCreekCroatianCrowCubanCypriotCzechCzechoslovakianDanishDelawareDominicanDutchDutch West IndianEastern EuropeanEcuadorianEgyptianEnglishEstonianEthiopianEuropeanFijianFilipinoFinnishFrenchFrench American IndianFrench CanadianGermanGerman RussianGhanaianGreekGuamanian/ChamorroGuatemalanGuyaneseHaitianHmongHonduranHopiHoumaHungarianIcelanderIndian (Asian)IndonesianInupiatIranianIraqiIrishIroquoisIsraeliItalianJamaicanJapaneseJordanianKenyanKiowaKoreanLaotianLatvianLebaneseLiberianLithuanianLumbeeLuxembourgerMacedonianMalaysianMalteseMarshalleseMenomineeMexicanMexican American IndianMongolianMoroccanNative HawaiianNavajoNepaleseNew ZealanderNicaraguanNigerianNorthern EuropeanNorwegianOkinawanOsageOttawaPaiutePakistaniPalestinianPanamanianParaguayanPennsylvania GermanPeruvianPimaPolishPortuguesePotawatomiPuebloPuerto RicanPuget Sound SalishRomanianRussianSalvadoranSamoanScandinavianScotch-IrishScottishSeminoleSenegaleseSerbianShoshoneSierra LeoneanSiouxSlavicSlovakSloveneSomaliSouth AfricanSouth AmericanSouth American IndianSoviet UnionSpaniardSpanishSpanish AmericanSpanish American IndianSri LankanSubsaharan AfricanSudaneseSwedishSwissSyrianTaiwaneseThaiTlingit-HaidaTohono O'OdhamTonganTrinidadian and TobagonianTurkishU.S. Virgin IslanderUgandanUkrainianUruguayanUteVenezuelanVietnameseWelshWest IndianYakamaYaquiYugoslavianYumanYup'ikZimbabwean
Immigration
NonimmigrantsImmigrantsAfghanistanAfricaAlbaniaArgentinaArmeniaAsiaAustraliaAustriaBahamasBangladeshBarbadosBelarusBelgiumBelizeBoliviaBosnia and HerzegovinaBrazilBulgariaBurma/MyanmarCabo VerdeCambodiaCameroonCanadaCaribbeanCentral AmericaChileChinaColombiaCongoCosta RicaCroatiaCubaCzechoslovakiaDenmarkDominicaDominican RepublicEastern AfricaEastern AsiaEastern EuropeEcuadorEgyptEl SalvadorEnglandEritreaEthiopiaEuropeFijiFranceGermanyGhanaGreeceGrenadaGuatemalaGuyanaHaitiHondurasHong KongHungaryIndiaIndonesiaIranIraqIrelandIsraelItalyJamaicaJapanJordanKazakhstanKenyaKoreaKuwaitLaosLatin AmericaLatviaLebanonLiberiaLithuaniaMalaysiaMexicoMicronesiaMiddle AfricaMoldovaMoroccoNepalNetherlandsNicaraguaNigeriaNorth AmericaNorth MacedoniaNorthern AfricaNorthern EuropeNorwayOceaniaPakistanPanamaPeruPhilippinesPolandPortugalRomaniaRussiaSaudi ArabiaScotlandSenegalSerbiaSierra LeoneSingaporeSomaliaSouth AfricaSouth AmericaSouth Central AsiaSouth Eastern AsiaSouthern EuropeSpainSri LankaSt. Vincent and the GrenadinesSudanSwedenSwitzerlandSyriaTaiwanThailandTrinidad and TobagoTurkeyUgandaUkraineUruguayUzbekistanVenezuelaVietnamWest IndiesWestern AfricaWestern AsiaWestern EuropeYemenZaireZimbabweAzores
Single Father Households
Income
Poverty
Unemployment
Labor Participation
Family Structure
Vehicle Availability
Education Level
Disability

Single Father Households Comparison

Tsimshian

Immigrants from Burma/Myanmar

Tragic
Poor
2.9%
SINGLE FATHER HOUSEHOLDS
0.0/ 100
METRIC RATING
312th/ 347
METRIC RANK
2.4%
SINGLE FATHER HOUSEHOLDS
12.1/ 100
METRIC RATING
221st/ 347
METRIC RANK

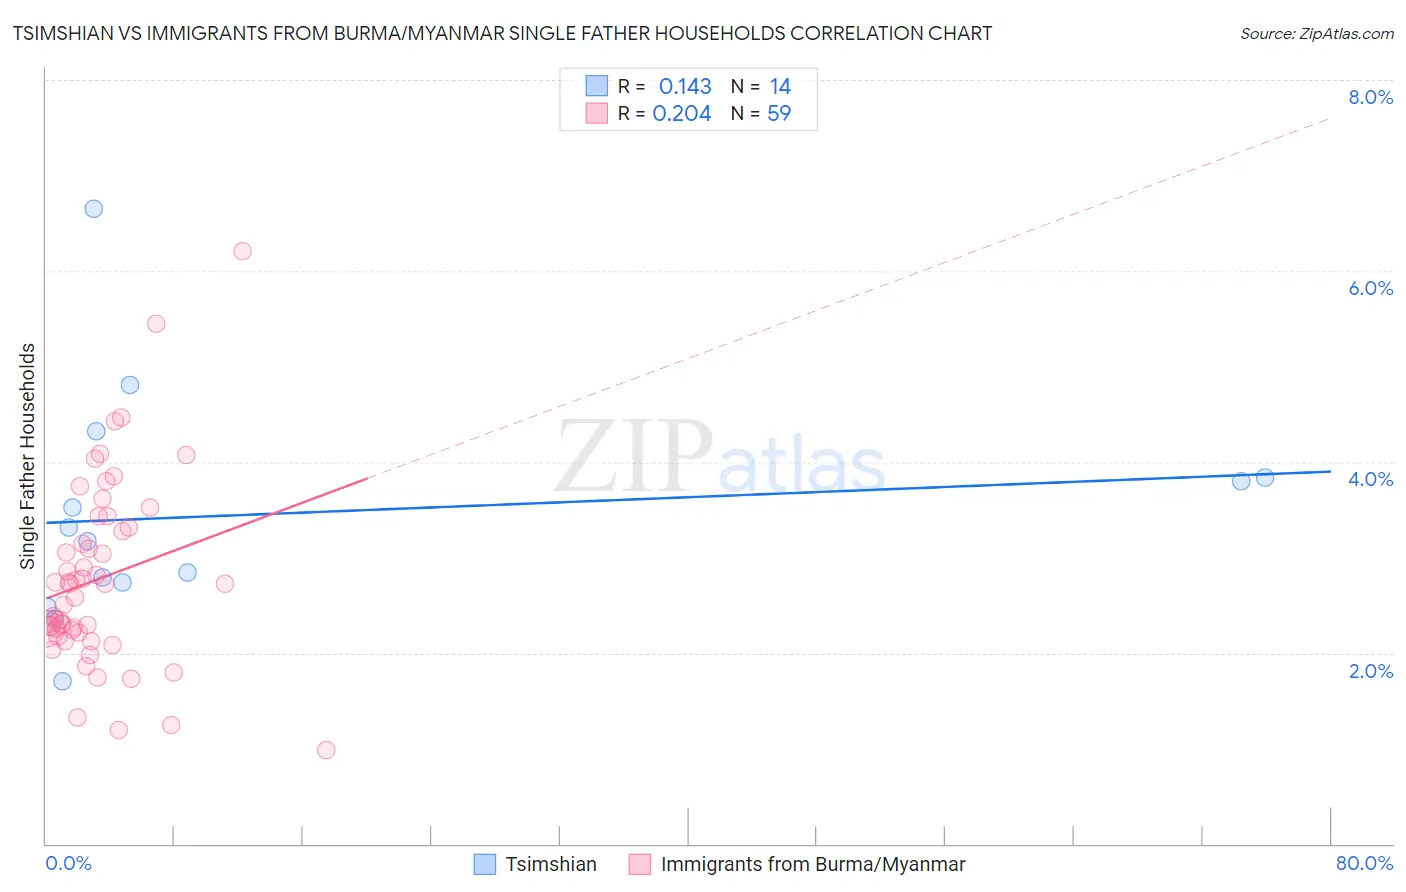
Tsimshian vs Immigrants from Burma/Myanmar Single Father Households Correlation Chart

The statistical analysis conducted on geographies consisting of 15,613,275 people shows a poor positive correlation between the proportion of Tsimshian and percentage of single father households in the United States with a correlation coefficient (R) of 0.143 and weighted average of 2.9%. Similarly, the statistical analysis conducted on geographies consisting of 171,785,459 people shows a weak positive correlation between the proportion of Immigrants from Burma/Myanmar and percentage of single father households in the United States with a correlation coefficient (R) of 0.204 and weighted average of 2.4%, a difference of 19.3%.
Tsimshian vs Immigrants from Burma/Myanmar Single Father Households

Single Father Households Correlation Summary

MeasurementTsimshianImmigrants from Burma/Myanmar
Minimum1.7%0.98%
Maximum6.6%6.2%
Range4.9%5.2%
Mean3.5%2.8%
Median3.2%2.7%
Interquartile 25% (IQ1)2.7%2.2%
Interquartile 75% (IQ3)3.8%3.3%
Interquartile Range (IQR)1.1%1.1%
Standard Deviation (Sample)1.2%0.98%
Standard Deviation (Population)1.2%0.97%

Similar Demographics by Single Father Households

Demographics Similar to Tsimshian by Single Father Households

In terms of single father households, the demographic groups most similar to Tsimshian are Arapaho (2.9%, a difference of 0.42%), Spanish American Indian (2.9%, a difference of 0.57%), Salvadoran (2.9%, a difference of 0.67%), Immigrants from Laos (2.9%, a difference of 1.1%), and Cheyenne (2.9%, a difference of 1.1%).
DemographicsRating | RankSingle Father Households
Hispanics or Latinos
0.0
/100
|
#305
Tragic
2.8%
Immigrants | Azores
0.0
/100
|
#306
Tragic
2.8%
Hopi
0.0
/100
|
#307
Tragic
2.8%
Apache
0.0
/100
|
#308
Tragic
2.8%
Central Americans
0.0
/100
|
#309
Tragic
2.9%
Immigrants | Laos
0.0
/100
|
#310
Tragic
2.9%
Spanish American Indians
0.0
/100
|
#311
Tragic
2.9%
Tsimshian
0.0
/100
|
#312
Tragic
2.9%
Arapaho
0.0
/100
|
#313
Tragic
2.9%
Salvadorans
0.0
/100
|
#314
Tragic
2.9%
Cheyenne
0.0
/100
|
#315
Tragic
2.9%
Houma
0.0
/100
|
#316
Tragic
2.9%
Immigrants | El Salvador
0.0
/100
|
#317
Tragic
2.9%
Cape Verdeans
0.0
/100
|
#318
Tragic
2.9%
Ute
0.0
/100
|
#319
Tragic
3.0%

Demographics Similar to Immigrants from Burma/Myanmar by Single Father Households

In terms of single father households, the demographic groups most similar to Immigrants from Burma/Myanmar are Immigrants from Eastern Africa (2.4%, a difference of 0.030%), Ghanaian (2.4%, a difference of 0.13%), Sudanese (2.4%, a difference of 0.14%), Immigrants from Uruguay (2.4%, a difference of 0.19%), and Immigrants from Ethiopia (2.4%, a difference of 0.21%).
DemographicsRating | RankSingle Father Households
Ethiopians
16.6
/100
|
#214
Poor
2.4%
Immigrants | South Eastern Asia
15.9
/100
|
#215
Poor
2.4%
Immigrants | Ecuador
14.9
/100
|
#216
Poor
2.4%
Dutch
14.3
/100
|
#217
Poor
2.4%
Immigrants | Ethiopia
13.4
/100
|
#218
Poor
2.4%
Sudanese
13.0
/100
|
#219
Poor
2.4%
Ghanaians
12.9
/100
|
#220
Poor
2.4%
Immigrants | Burma/Myanmar
12.1
/100
|
#221
Poor
2.4%
Immigrants | Eastern Africa
11.9
/100
|
#222
Poor
2.4%
Immigrants | Uruguay
11.0
/100
|
#223
Poor
2.4%
Immigrants | Bahamas
10.6
/100
|
#224
Poor
2.4%
Marshallese
9.7
/100
|
#225
Tragic
2.4%
Blacks/African Americans
9.7
/100
|
#226
Tragic
2.4%
Americans
9.3
/100
|
#227
Tragic
2.4%
Immigrants | Ghana
9.1
/100
|
#228
Tragic
2.4%