Immigrants from Nepal vs Immigrants from Burma/Myanmar Single Father Households
COMPARE
Immigrants from Nepal
Immigrants from Burma/Myanmar
Single Father Households
Single Father Households Comparison
Immigrants from Nepal
Immigrants from Burma/Myanmar
2.2%
SINGLE FATHER HOUSEHOLDS
92.1/ 100
METRIC RATING
143rd/ 347
METRIC RANK
2.4%
SINGLE FATHER HOUSEHOLDS
12.1/ 100
METRIC RATING
221st/ 347
METRIC RANK
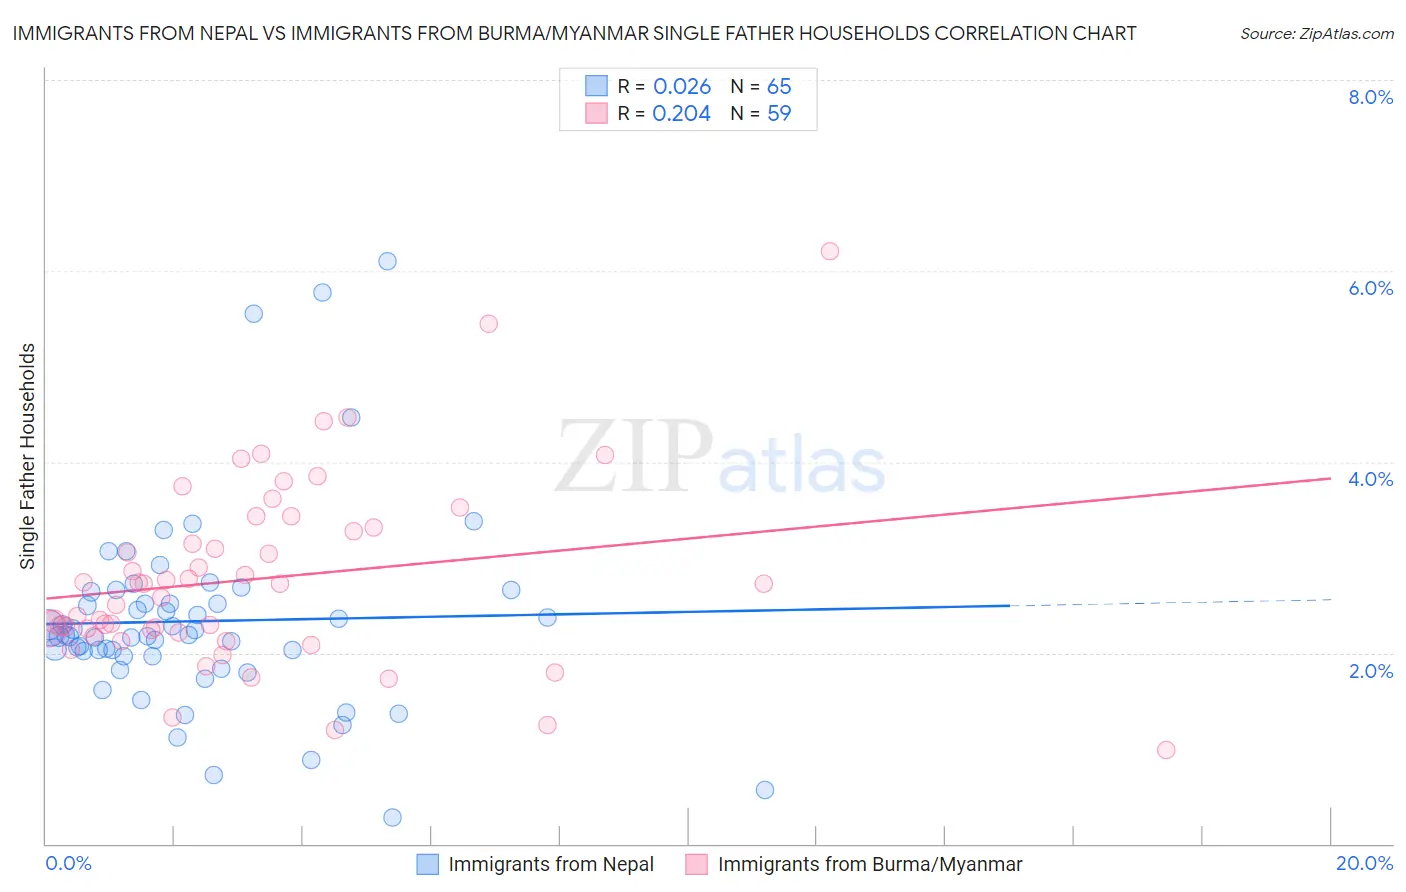
Immigrants from Nepal vs Immigrants from Burma/Myanmar Single Father Households Correlation Chart
The statistical analysis conducted on geographies consisting of 186,164,733 people shows no correlation between the proportion of Immigrants from Nepal and percentage of single father households in the United States with a correlation coefficient (R) of 0.026 and weighted average of 2.2%. Similarly, the statistical analysis conducted on geographies consisting of 171,785,459 people shows a weak positive correlation between the proportion of Immigrants from Burma/Myanmar and percentage of single father households in the United States with a correlation coefficient (R) of 0.204 and weighted average of 2.4%, a difference of 8.5%.
Single Father Households Correlation Summary
| Measurement | Immigrants from Nepal | Immigrants from Burma/Myanmar |
| Minimum | 0.28% | 0.98% |
| Maximum | 6.1% | 6.2% |
| Range | 5.8% | 5.2% |
| Mean | 2.3% | 2.8% |
| Median | 2.2% | 2.7% |
| Interquartile 25% (IQ1) | 2.0% | 2.2% |
| Interquartile 75% (IQ3) | 2.6% | 3.3% |
| Interquartile Range (IQR) | 0.61% | 1.1% |
| Standard Deviation (Sample) | 1.0% | 0.98% |
| Standard Deviation (Population) | 1.0% | 0.97% |
Similar Demographics by Single Father Households
Demographics Similar to Immigrants from Nepal by Single Father Households
In terms of single father households, the demographic groups most similar to Immigrants from Nepal are Luxembourger (2.2%, a difference of 0.060%), Laotian (2.2%, a difference of 0.10%), Brazilian (2.2%, a difference of 0.19%), British (2.2%, a difference of 0.19%), and Slovak (2.2%, a difference of 0.34%).
| Demographics | Rating | Rank | Single Father Households |
| Chileans | 94.5 /100 | #136 | Exceptional 2.2% |
| Austrians | 94.2 /100 | #137 | Exceptional 2.2% |
| West Indians | 94.1 /100 | #138 | Exceptional 2.2% |
| Brazilians | 92.8 /100 | #139 | Exceptional 2.2% |
| British | 92.8 /100 | #140 | Exceptional 2.2% |
| Laotians | 92.5 /100 | #141 | Exceptional 2.2% |
| Luxembourgers | 92.3 /100 | #142 | Exceptional 2.2% |
| Immigrants | Nepal | 92.1 /100 | #143 | Exceptional 2.2% |
| Slovaks | 90.7 /100 | #144 | Exceptional 2.2% |
| Immigrants | Zimbabwe | 90.2 /100 | #145 | Exceptional 2.2% |
| Northern Europeans | 89.8 /100 | #146 | Excellent 2.2% |
| Slavs | 88.9 /100 | #147 | Excellent 2.2% |
| South American Indians | 88.5 /100 | #148 | Excellent 2.3% |
| Senegalese | 88.4 /100 | #149 | Excellent 2.3% |
| Venezuelans | 86.2 /100 | #150 | Excellent 2.3% |
Demographics Similar to Immigrants from Burma/Myanmar by Single Father Households
In terms of single father households, the demographic groups most similar to Immigrants from Burma/Myanmar are Immigrants from Eastern Africa (2.4%, a difference of 0.030%), Ghanaian (2.4%, a difference of 0.13%), Sudanese (2.4%, a difference of 0.14%), Immigrants from Uruguay (2.4%, a difference of 0.19%), and Immigrants from Ethiopia (2.4%, a difference of 0.21%).
| Demographics | Rating | Rank | Single Father Households |
| Ethiopians | 16.6 /100 | #214 | Poor 2.4% |
| Immigrants | South Eastern Asia | 15.9 /100 | #215 | Poor 2.4% |
| Immigrants | Ecuador | 14.9 /100 | #216 | Poor 2.4% |
| Dutch | 14.3 /100 | #217 | Poor 2.4% |
| Immigrants | Ethiopia | 13.4 /100 | #218 | Poor 2.4% |
| Sudanese | 13.0 /100 | #219 | Poor 2.4% |
| Ghanaians | 12.9 /100 | #220 | Poor 2.4% |
| Immigrants | Burma/Myanmar | 12.1 /100 | #221 | Poor 2.4% |
| Immigrants | Eastern Africa | 11.9 /100 | #222 | Poor 2.4% |
| Immigrants | Uruguay | 11.0 /100 | #223 | Poor 2.4% |
| Immigrants | Bahamas | 10.6 /100 | #224 | Poor 2.4% |
| Marshallese | 9.7 /100 | #225 | Tragic 2.4% |
| Blacks/African Americans | 9.7 /100 | #226 | Tragic 2.4% |
| Americans | 9.3 /100 | #227 | Tragic 2.4% |
| Immigrants | Ghana | 9.1 /100 | #228 | Tragic 2.4% |