Tsimshian vs Immigrants from Africa Births to Unmarried Women
COMPARE
Tsimshian
Immigrants from Africa
Births to Unmarried Women
Births to Unmarried Women Comparison
Tsimshian
Immigrants from Africa
42.2%
BIRTHS TO UNMARRIED WOMEN
0.0/ 100
METRIC RATING
327th/ 347
METRIC RANK
33.0%
BIRTHS TO UNMARRIED WOMEN
14.3/ 100
METRIC RATING
204th/ 347
METRIC RANK
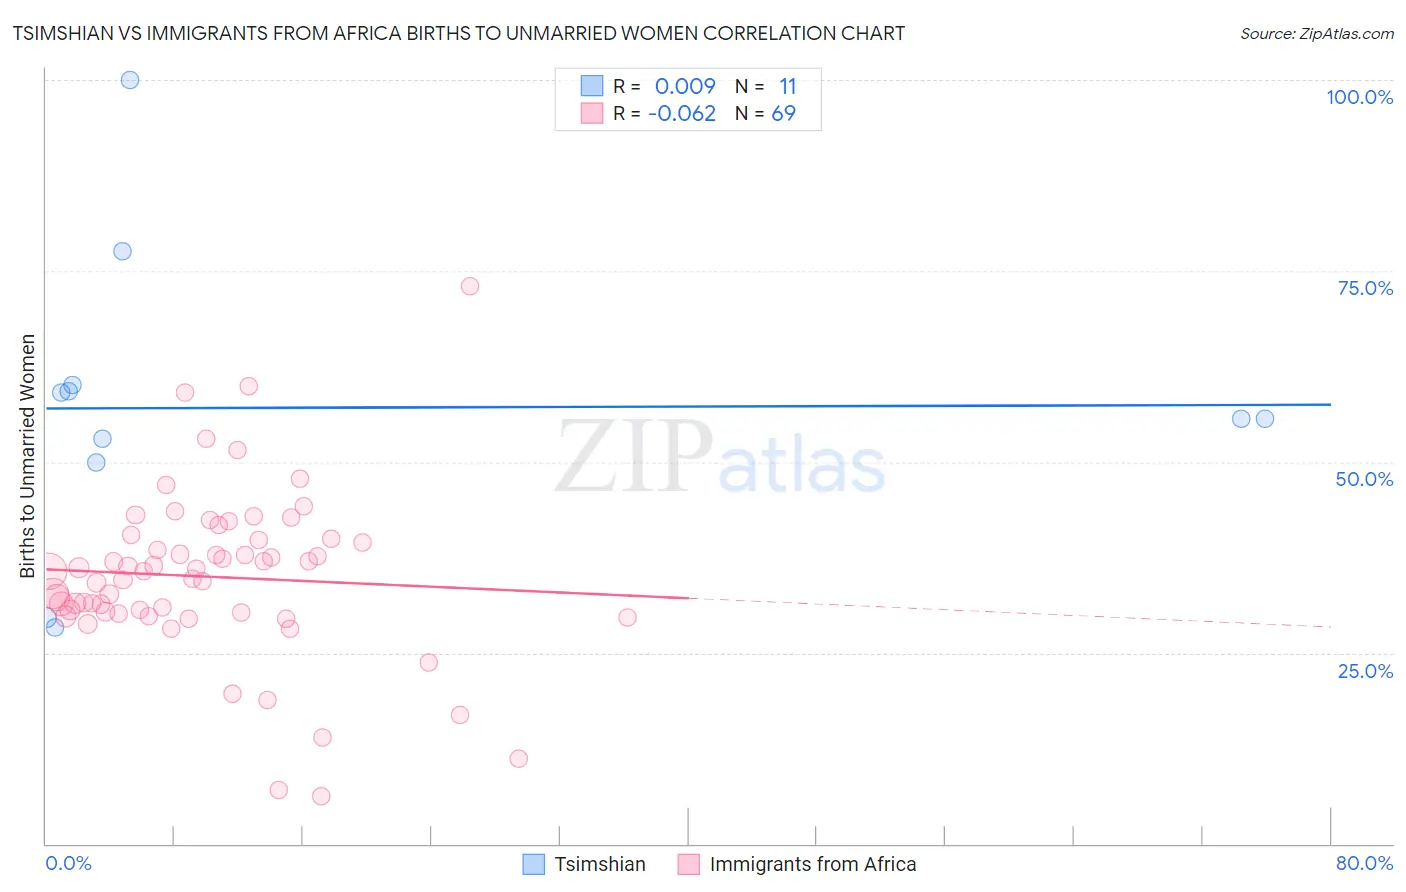
Tsimshian vs Immigrants from Africa Births to Unmarried Women Correlation Chart
The statistical analysis conducted on geographies consisting of 15,351,381 people shows no correlation between the proportion of Tsimshian and percentage of births to unmarried women in the United States with a correlation coefficient (R) of 0.009 and weighted average of 42.2%. Similarly, the statistical analysis conducted on geographies consisting of 434,308,086 people shows a slight negative correlation between the proportion of Immigrants from Africa and percentage of births to unmarried women in the United States with a correlation coefficient (R) of -0.062 and weighted average of 33.0%, a difference of 27.7%.
Births to Unmarried Women Correlation Summary
| Measurement | Tsimshian | Immigrants from Africa |
| Minimum | 28.3% | 6.3% |
| Maximum | 100.0% | 73.0% |
| Range | 71.7% | 66.7% |
| Mean | 57.1% | 35.0% |
| Median | 55.6% | 35.7% |
| Interquartile 25% (IQ1) | 50.0% | 30.1% |
| Interquartile 75% (IQ3) | 60.0% | 39.8% |
| Interquartile Range (IQR) | 10.0% | 9.7% |
| Standard Deviation (Sample) | 19.8% | 11.0% |
| Standard Deviation (Population) | 18.9% | 10.9% |
Similar Demographics by Births to Unmarried Women
Demographics Similar to Tsimshian by Births to Unmarried Women
In terms of births to unmarried women, the demographic groups most similar to Tsimshian are Immigrants from Cabo Verde (42.2%, a difference of 0.13%), Paiute (42.5%, a difference of 0.74%), Chippewa (42.6%, a difference of 1.1%), Immigrants from Cuba (41.5%, a difference of 1.7%), and Cheyenne (41.3%, a difference of 1.9%).
| Demographics | Rating | Rank | Births to Unmarried Women |
| Crow | 0.0 /100 | #320 | Tragic 40.4% |
| Bahamians | 0.0 /100 | #321 | Tragic 40.8% |
| Cajuns | 0.0 /100 | #322 | Tragic 41.0% |
| Sioux | 0.0 /100 | #323 | Tragic 41.0% |
| Cape Verdeans | 0.0 /100 | #324 | Tragic 41.3% |
| Cheyenne | 0.0 /100 | #325 | Tragic 41.3% |
| Immigrants | Cuba | 0.0 /100 | #326 | Tragic 41.5% |
| Tsimshian | 0.0 /100 | #327 | Tragic 42.2% |
| Immigrants | Cabo Verde | 0.0 /100 | #328 | Tragic 42.2% |
| Paiute | 0.0 /100 | #329 | Tragic 42.5% |
| Chippewa | 0.0 /100 | #330 | Tragic 42.6% |
| Natives/Alaskans | 0.0 /100 | #331 | Tragic 43.0% |
| Kiowa | 0.0 /100 | #332 | Tragic 43.1% |
| Blacks/African Americans | 0.0 /100 | #333 | Tragic 44.3% |
| Yuman | 0.0 /100 | #334 | Tragic 44.4% |
Demographics Similar to Immigrants from Africa by Births to Unmarried Women
In terms of births to unmarried women, the demographic groups most similar to Immigrants from Africa are Ute (33.0%, a difference of 0.020%), German Russian (33.1%, a difference of 0.23%), Uruguayan (33.1%, a difference of 0.29%), Immigrants from Micronesia (32.9%, a difference of 0.40%), and Immigrants from Burma/Myanmar (32.9%, a difference of 0.41%).
| Demographics | Rating | Rank | Births to Unmarried Women |
| Immigrants | Immigrants | 20.6 /100 | #197 | Fair 32.7% |
| Costa Ricans | 20.3 /100 | #198 | Fair 32.7% |
| Immigrants | Thailand | 18.9 /100 | #199 | Poor 32.8% |
| Immigrants | Germany | 18.8 /100 | #200 | Poor 32.8% |
| Immigrants | Burma/Myanmar | 16.7 /100 | #201 | Poor 32.9% |
| Immigrants | Micronesia | 16.6 /100 | #202 | Poor 32.9% |
| Ute | 14.4 /100 | #203 | Poor 33.0% |
| Immigrants | Africa | 14.3 /100 | #204 | Poor 33.0% |
| German Russians | 13.1 /100 | #205 | Poor 33.1% |
| Uruguayans | 12.8 /100 | #206 | Poor 33.1% |
| Immigrants | Sudan | 11.5 /100 | #207 | Poor 33.2% |
| Hawaiians | 11.3 /100 | #208 | Poor 33.2% |
| Whites/Caucasians | 10.7 /100 | #209 | Poor 33.3% |
| Scotch-Irish | 10.7 /100 | #210 | Poor 33.3% |
| Ecuadorians | 10.5 /100 | #211 | Poor 33.3% |