Immigrants from Bangladesh vs Immigrants from Africa Births to Unmarried Women
COMPARE
Immigrants from Bangladesh
Immigrants from Africa
Births to Unmarried Women
Births to Unmarried Women Comparison
Immigrants from Bangladesh
Immigrants from Africa
30.9%
BIRTHS TO UNMARRIED WOMEN
73.9/ 100
METRIC RATING
155th/ 347
METRIC RANK
33.0%
BIRTHS TO UNMARRIED WOMEN
14.3/ 100
METRIC RATING
204th/ 347
METRIC RANK
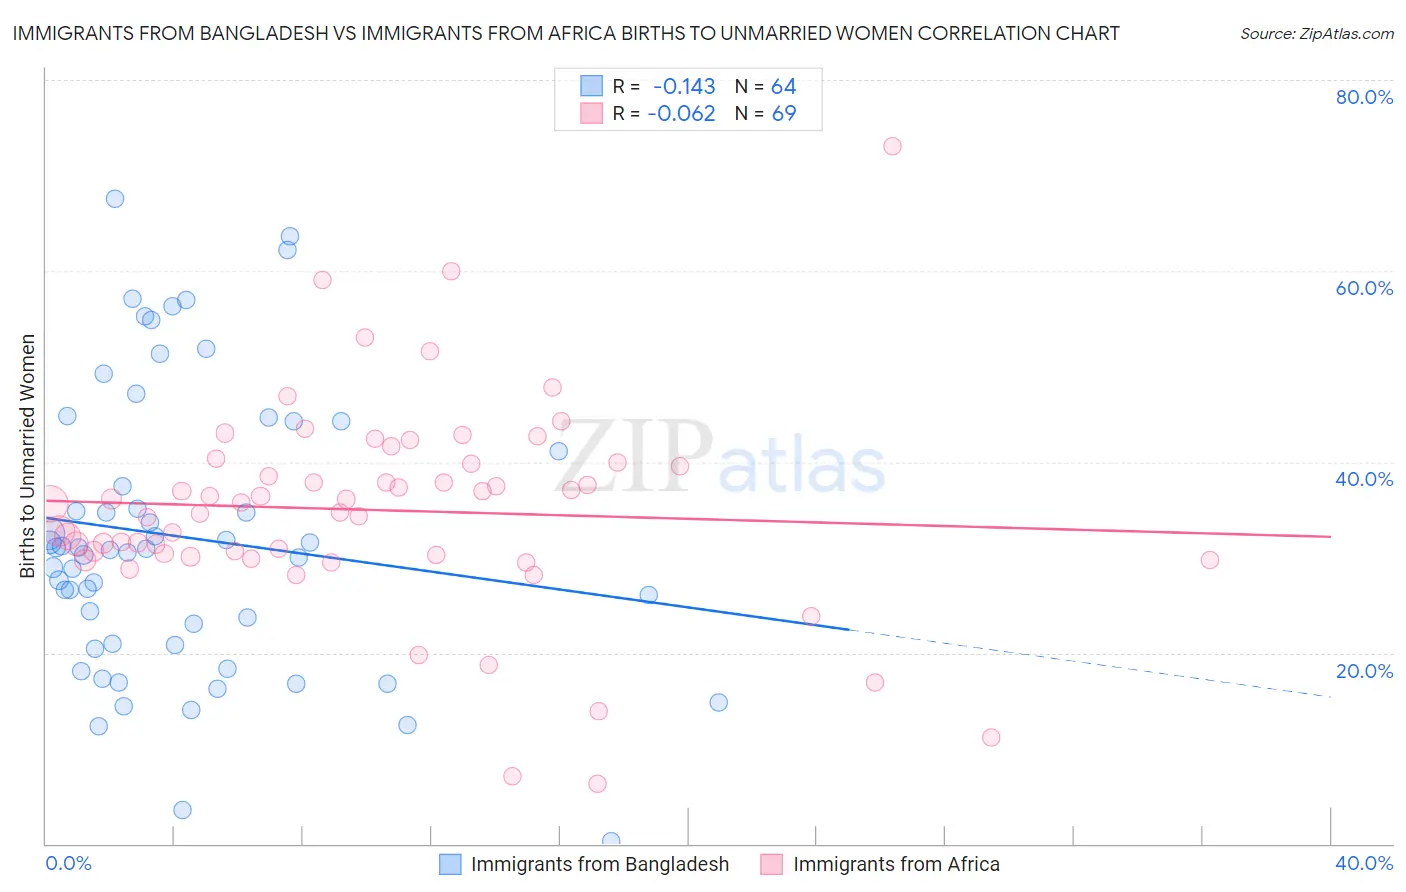
Immigrants from Bangladesh vs Immigrants from Africa Births to Unmarried Women Correlation Chart
The statistical analysis conducted on geographies consisting of 195,686,757 people shows a poor negative correlation between the proportion of Immigrants from Bangladesh and percentage of births to unmarried women in the United States with a correlation coefficient (R) of -0.143 and weighted average of 30.9%. Similarly, the statistical analysis conducted on geographies consisting of 434,308,086 people shows a slight negative correlation between the proportion of Immigrants from Africa and percentage of births to unmarried women in the United States with a correlation coefficient (R) of -0.062 and weighted average of 33.0%, a difference of 6.9%.
Births to Unmarried Women Correlation Summary
| Measurement | Immigrants from Bangladesh | Immigrants from Africa |
| Minimum | 0.20% | 6.3% |
| Maximum | 67.6% | 73.0% |
| Range | 67.4% | 66.7% |
| Mean | 32.1% | 35.0% |
| Median | 30.8% | 35.7% |
| Interquartile 25% (IQ1) | 20.9% | 30.1% |
| Interquartile 75% (IQ3) | 42.6% | 39.8% |
| Interquartile Range (IQR) | 21.8% | 9.7% |
| Standard Deviation (Sample) | 14.9% | 11.0% |
| Standard Deviation (Population) | 14.8% | 10.9% |
Similar Demographics by Births to Unmarried Women
Demographics Similar to Immigrants from Bangladesh by Births to Unmarried Women
In terms of births to unmarried women, the demographic groups most similar to Immigrants from Bangladesh are Carpatho Rusyn (30.9%, a difference of 0.050%), Yugoslavian (30.8%, a difference of 0.15%), Immigrants from Eastern Africa (31.0%, a difference of 0.22%), British (30.8%, a difference of 0.27%), and Polish (30.8%, a difference of 0.29%).
| Demographics | Rating | Rank | Births to Unmarried Women |
| Chileans | 79.1 /100 | #148 | Good 30.7% |
| Serbians | 78.8 /100 | #149 | Good 30.7% |
| Somalis | 77.8 /100 | #150 | Good 30.7% |
| Italians | 77.0 /100 | #151 | Good 30.8% |
| Poles | 76.2 /100 | #152 | Good 30.8% |
| British | 76.0 /100 | #153 | Good 30.8% |
| Yugoslavians | 75.1 /100 | #154 | Good 30.8% |
| Immigrants | Bangladesh | 73.9 /100 | #155 | Good 30.9% |
| Carpatho Rusyns | 73.5 /100 | #156 | Good 30.9% |
| Immigrants | Eastern Africa | 72.1 /100 | #157 | Good 31.0% |
| Austrians | 69.9 /100 | #158 | Good 31.0% |
| Immigrants | England | 69.4 /100 | #159 | Good 31.1% |
| Immigrants | Western Europe | 69.3 /100 | #160 | Good 31.1% |
| Immigrants | Southern Europe | 68.7 /100 | #161 | Good 31.1% |
| Slovenes | 65.9 /100 | #162 | Good 31.2% |
Demographics Similar to Immigrants from Africa by Births to Unmarried Women
In terms of births to unmarried women, the demographic groups most similar to Immigrants from Africa are Ute (33.0%, a difference of 0.020%), German Russian (33.1%, a difference of 0.23%), Uruguayan (33.1%, a difference of 0.29%), Immigrants from Micronesia (32.9%, a difference of 0.40%), and Immigrants from Burma/Myanmar (32.9%, a difference of 0.41%).
| Demographics | Rating | Rank | Births to Unmarried Women |
| Immigrants | Immigrants | 20.6 /100 | #197 | Fair 32.7% |
| Costa Ricans | 20.3 /100 | #198 | Fair 32.7% |
| Immigrants | Thailand | 18.9 /100 | #199 | Poor 32.8% |
| Immigrants | Germany | 18.8 /100 | #200 | Poor 32.8% |
| Immigrants | Burma/Myanmar | 16.7 /100 | #201 | Poor 32.9% |
| Immigrants | Micronesia | 16.6 /100 | #202 | Poor 32.9% |
| Ute | 14.4 /100 | #203 | Poor 33.0% |
| Immigrants | Africa | 14.3 /100 | #204 | Poor 33.0% |
| German Russians | 13.1 /100 | #205 | Poor 33.1% |
| Uruguayans | 12.8 /100 | #206 | Poor 33.1% |
| Immigrants | Sudan | 11.5 /100 | #207 | Poor 33.2% |
| Hawaiians | 11.3 /100 | #208 | Poor 33.2% |
| Whites/Caucasians | 10.7 /100 | #209 | Poor 33.3% |
| Scotch-Irish | 10.7 /100 | #210 | Poor 33.3% |
| Ecuadorians | 10.5 /100 | #211 | Poor 33.3% |