Thai vs Ethiopian Births to Unmarried Women
COMPARE
Thai
Ethiopian
Births to Unmarried Women
Births to Unmarried Women Comparison
Thais
Ethiopians
24.0%
BIRTHS TO UNMARRIED WOMEN
100.0/ 100
METRIC RATING
7th/ 347
METRIC RANK
29.8%
BIRTHS TO UNMARRIED WOMEN
91.9/ 100
METRIC RATING
115th/ 347
METRIC RANK
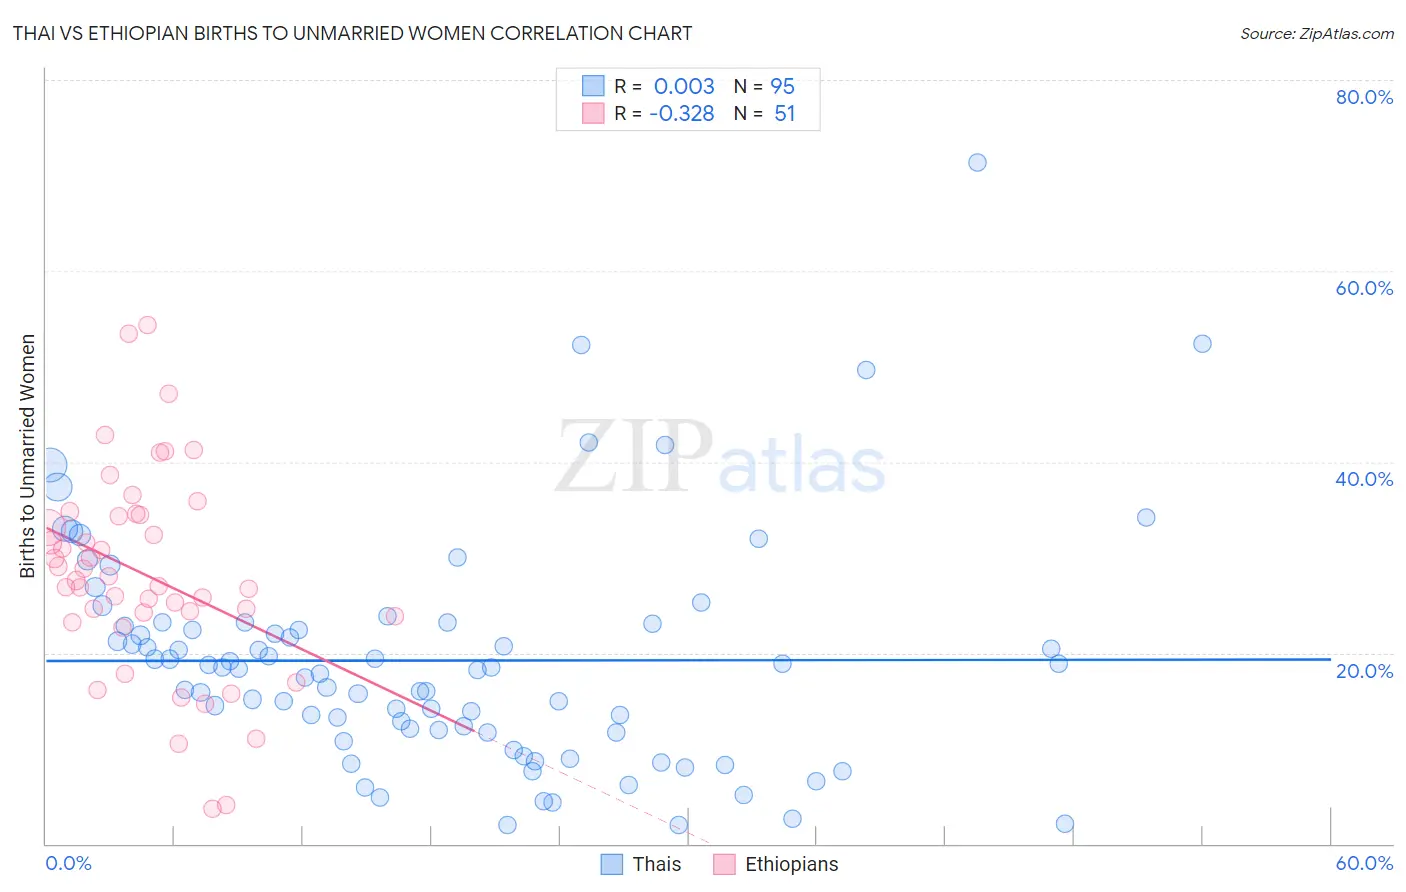
Thai vs Ethiopian Births to Unmarried Women Correlation Chart
The statistical analysis conducted on geographies consisting of 438,559,293 people shows no correlation between the proportion of Thais and percentage of births to unmarried women in the United States with a correlation coefficient (R) of 0.003 and weighted average of 24.0%. Similarly, the statistical analysis conducted on geographies consisting of 215,740,529 people shows a mild negative correlation between the proportion of Ethiopians and percentage of births to unmarried women in the United States with a correlation coefficient (R) of -0.328 and weighted average of 29.8%, a difference of 24.2%.
Births to Unmarried Women Correlation Summary
| Measurement | Thai | Ethiopian |
| Minimum | 1.9% | 3.7% |
| Maximum | 71.3% | 54.3% |
| Range | 69.4% | 50.6% |
| Mean | 19.2% | 28.2% |
| Median | 18.4% | 27.6% |
| Interquartile 25% (IQ1) | 11.7% | 23.8% |
| Interquartile 75% (IQ3) | 23.1% | 34.4% |
| Interquartile Range (IQR) | 11.4% | 10.6% |
| Standard Deviation (Sample) | 12.0% | 10.7% |
| Standard Deviation (Population) | 11.9% | 10.6% |
Similar Demographics by Births to Unmarried Women
Demographics Similar to Thais by Births to Unmarried Women
In terms of births to unmarried women, the demographic groups most similar to Thais are Immigrants from Iran (24.0%, a difference of 0.29%), Immigrants from Hong Kong (23.6%, a difference of 1.9%), Immigrants from China (24.7%, a difference of 2.7%), Immigrants from South Central Asia (24.7%, a difference of 2.7%), and Immigrants from Eastern Asia (25.0%, a difference of 4.2%).
| Demographics | Rating | Rank | Births to Unmarried Women |
| Assyrians/Chaldeans/Syriacs | 100.0 /100 | #1 | Exceptional 22.0% |
| Immigrants | India | 100.0 /100 | #2 | Exceptional 22.9% |
| Filipinos | 100.0 /100 | #3 | Exceptional 23.0% |
| Immigrants | Taiwan | 100.0 /100 | #4 | Exceptional 23.0% |
| Immigrants | Hong Kong | 100.0 /100 | #5 | Exceptional 23.6% |
| Immigrants | Iran | 100.0 /100 | #6 | Exceptional 24.0% |
| Thais | 100.0 /100 | #7 | Exceptional 24.0% |
| Immigrants | China | 100.0 /100 | #8 | Exceptional 24.7% |
| Immigrants | South Central Asia | 100.0 /100 | #9 | Exceptional 24.7% |
| Immigrants | Eastern Asia | 100.0 /100 | #10 | Exceptional 25.0% |
| Immigrants | Israel | 100.0 /100 | #11 | Exceptional 25.1% |
| Indians (Asian) | 100.0 /100 | #12 | Exceptional 25.3% |
| Iranians | 100.0 /100 | #13 | Exceptional 25.3% |
| Immigrants | Lebanon | 100.0 /100 | #14 | Exceptional 25.3% |
| Immigrants | Singapore | 100.0 /100 | #15 | Exceptional 25.6% |
Demographics Similar to Ethiopians by Births to Unmarried Women
In terms of births to unmarried women, the demographic groups most similar to Ethiopians are Immigrants from Italy (29.9%, a difference of 0.080%), Immigrants from Croatia (29.8%, a difference of 0.22%), Scandinavian (29.8%, a difference of 0.28%), Immigrants from Netherlands (29.9%, a difference of 0.29%), and Immigrants from Norway (29.9%, a difference of 0.31%).
| Demographics | Rating | Rank | Births to Unmarried Women |
| Paraguayans | 93.5 /100 | #108 | Exceptional 29.7% |
| Greeks | 93.4 /100 | #109 | Exceptional 29.7% |
| Immigrants | Ethiopia | 93.4 /100 | #110 | Exceptional 29.7% |
| Immigrants | Hungary | 93.0 /100 | #111 | Exceptional 29.7% |
| Basques | 93.0 /100 | #112 | Exceptional 29.7% |
| Scandinavians | 92.7 /100 | #113 | Exceptional 29.8% |
| Immigrants | Croatia | 92.6 /100 | #114 | Exceptional 29.8% |
| Ethiopians | 91.9 /100 | #115 | Exceptional 29.8% |
| Immigrants | Italy | 91.7 /100 | #116 | Exceptional 29.9% |
| Immigrants | Netherlands | 91.1 /100 | #117 | Exceptional 29.9% |
| Immigrants | Norway | 91.0 /100 | #118 | Exceptional 29.9% |
| Argentineans | 90.5 /100 | #119 | Exceptional 30.0% |
| Ugandans | 89.2 /100 | #120 | Excellent 30.1% |
| Koreans | 88.9 /100 | #121 | Excellent 30.1% |
| Immigrants | Argentina | 88.7 /100 | #122 | Excellent 30.1% |