Immigrants from Netherlands vs Ethiopian Births to Unmarried Women
COMPARE
Immigrants from Netherlands
Ethiopian
Births to Unmarried Women
Births to Unmarried Women Comparison
Immigrants from Netherlands
Ethiopians
29.9%
BIRTHS TO UNMARRIED WOMEN
91.1/ 100
METRIC RATING
117th/ 347
METRIC RANK
29.8%
BIRTHS TO UNMARRIED WOMEN
91.9/ 100
METRIC RATING
115th/ 347
METRIC RANK
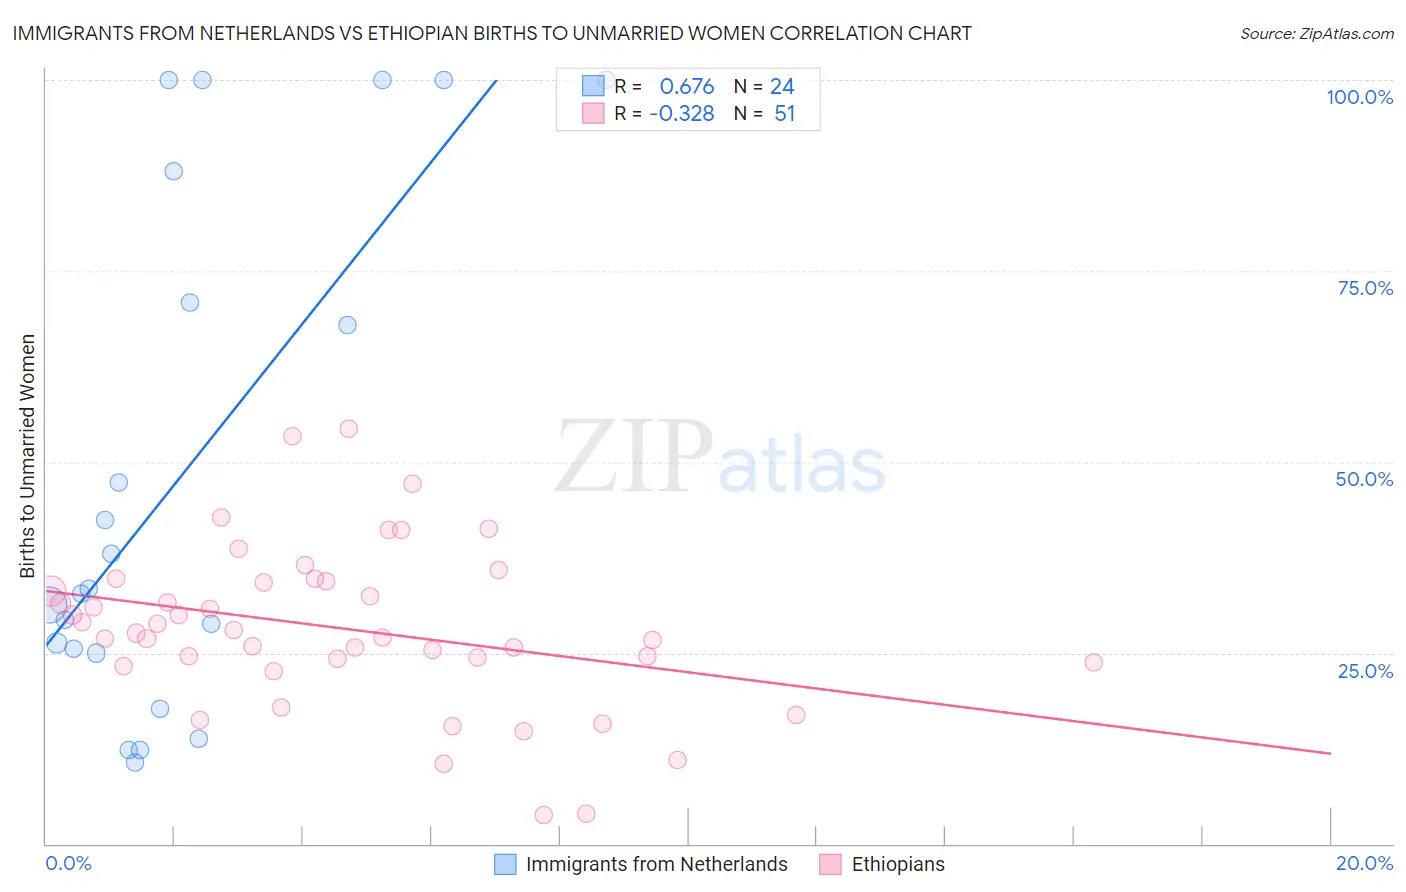
Immigrants from Netherlands vs Ethiopian Births to Unmarried Women Correlation Chart
The statistical analysis conducted on geographies consisting of 223,807,985 people shows a significant positive correlation between the proportion of Immigrants from Netherlands and percentage of births to unmarried women in the United States with a correlation coefficient (R) of 0.676 and weighted average of 29.9%. Similarly, the statistical analysis conducted on geographies consisting of 215,740,529 people shows a mild negative correlation between the proportion of Ethiopians and percentage of births to unmarried women in the United States with a correlation coefficient (R) of -0.328 and weighted average of 29.8%, a difference of 0.29%.
Births to Unmarried Women Correlation Summary
| Measurement | Immigrants from Netherlands | Ethiopian |
| Minimum | 10.7% | 3.7% |
| Maximum | 100.0% | 54.3% |
| Range | 89.3% | 50.6% |
| Mean | 48.1% | 28.2% |
| Median | 33.1% | 27.6% |
| Interquartile 25% (IQ1) | 25.2% | 23.8% |
| Interquartile 75% (IQ3) | 79.5% | 34.4% |
| Interquartile Range (IQR) | 54.3% | 10.6% |
| Standard Deviation (Sample) | 33.1% | 10.7% |
| Standard Deviation (Population) | 32.4% | 10.6% |
Demographics Similar to Immigrants from Netherlands and Ethiopians by Births to Unmarried Women
In terms of births to unmarried women, the demographic groups most similar to Immigrants from Netherlands are Immigrants from Norway (29.9%, a difference of 0.020%), Argentinean (30.0%, a difference of 0.16%), Immigrants from Italy (29.9%, a difference of 0.21%), Immigrants from Croatia (29.8%, a difference of 0.50%), and Ugandan (30.1%, a difference of 0.52%). Similarly, the demographic groups most similar to Ethiopians are Immigrants from Italy (29.9%, a difference of 0.080%), Immigrants from Croatia (29.8%, a difference of 0.22%), Scandinavian (29.8%, a difference of 0.28%), Immigrants from Norway (29.9%, a difference of 0.31%), and Basque (29.7%, a difference of 0.38%).
| Demographics | Rating | Rank | Births to Unmarried Women |
| Swedes | 93.8 /100 | #106 | Exceptional 29.6% |
| Immigrants | Brazil | 93.7 /100 | #107 | Exceptional 29.6% |
| Paraguayans | 93.5 /100 | #108 | Exceptional 29.7% |
| Greeks | 93.4 /100 | #109 | Exceptional 29.7% |
| Immigrants | Ethiopia | 93.4 /100 | #110 | Exceptional 29.7% |
| Immigrants | Hungary | 93.0 /100 | #111 | Exceptional 29.7% |
| Basques | 93.0 /100 | #112 | Exceptional 29.7% |
| Scandinavians | 92.7 /100 | #113 | Exceptional 29.8% |
| Immigrants | Croatia | 92.6 /100 | #114 | Exceptional 29.8% |
| Ethiopians | 91.9 /100 | #115 | Exceptional 29.8% |
| Immigrants | Italy | 91.7 /100 | #116 | Exceptional 29.9% |
| Immigrants | Netherlands | 91.1 /100 | #117 | Exceptional 29.9% |
| Immigrants | Norway | 91.0 /100 | #118 | Exceptional 29.9% |
| Argentineans | 90.5 /100 | #119 | Exceptional 30.0% |
| Ugandans | 89.2 /100 | #120 | Excellent 30.1% |
| Koreans | 88.9 /100 | #121 | Excellent 30.1% |
| Immigrants | Argentina | 88.7 /100 | #122 | Excellent 30.1% |
| Syrians | 88.2 /100 | #123 | Excellent 30.2% |
| Croatians | 88.0 /100 | #124 | Excellent 30.2% |
| Vietnamese | 87.7 /100 | #125 | Excellent 30.2% |
| Europeans | 87.2 /100 | #126 | Excellent 30.2% |