Taiwanese vs Japanese Currently Married
COMPARE
Taiwanese
Japanese
Currently Married
Currently Married Comparison
Taiwanese
Japanese
45.8%
CURRENTLY MARRIED
11.7/ 100
METRIC RATING
203rd/ 347
METRIC RANK
44.5%
CURRENTLY MARRIED
0.6/ 100
METRIC RATING
244th/ 347
METRIC RANK
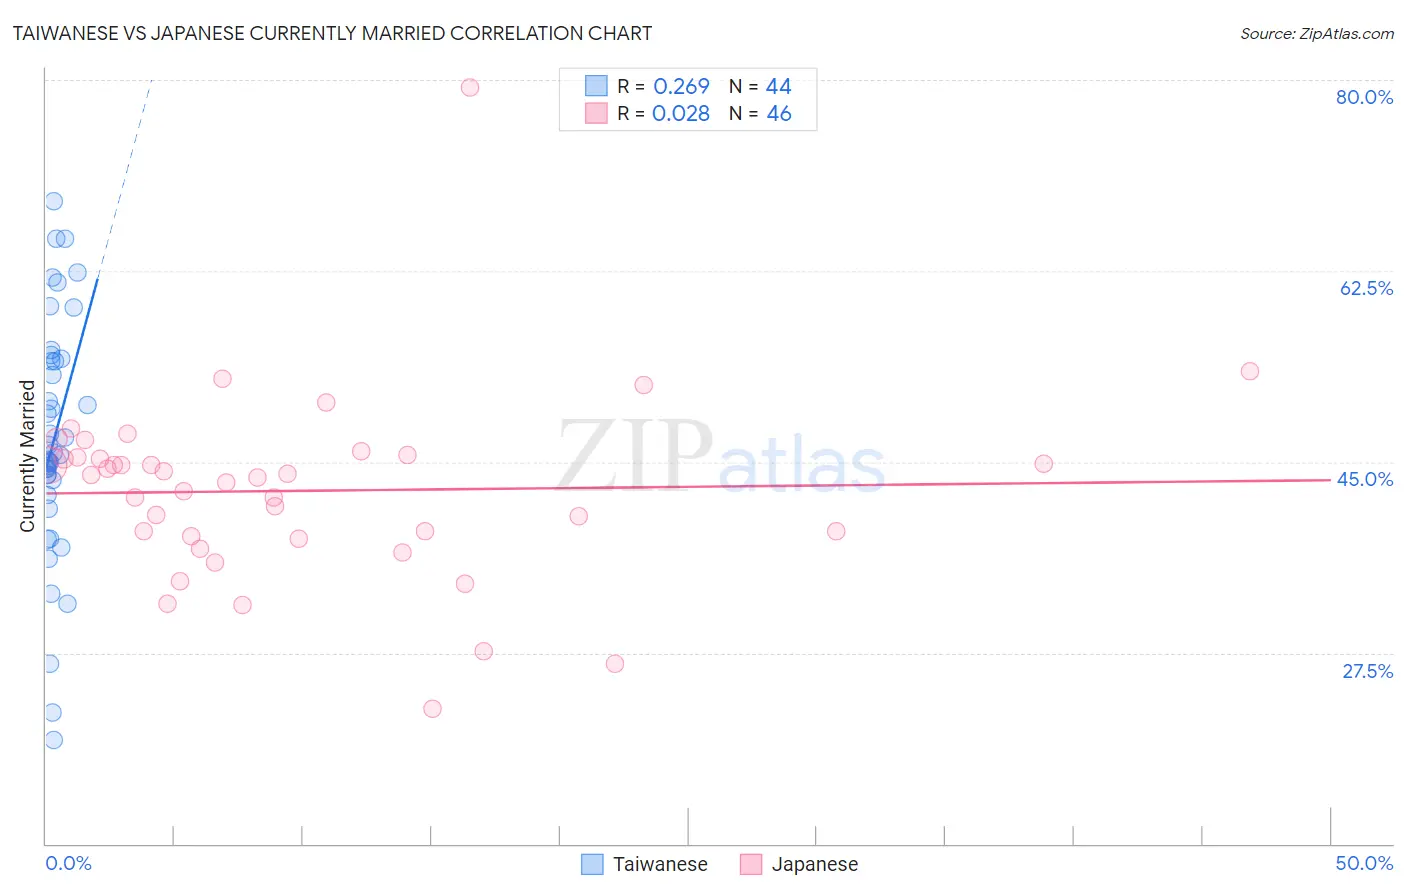
Taiwanese vs Japanese Currently Married Correlation Chart
The statistical analysis conducted on geographies consisting of 31,720,118 people shows a weak positive correlation between the proportion of Taiwanese and percentage of population currently married in the United States with a correlation coefficient (R) of 0.269 and weighted average of 45.8%. Similarly, the statistical analysis conducted on geographies consisting of 249,168,550 people shows no correlation between the proportion of Japanese and percentage of population currently married in the United States with a correlation coefficient (R) of 0.028 and weighted average of 44.5%, a difference of 2.9%.
Currently Married Correlation Summary
| Measurement | Taiwanese | Japanese |
| Minimum | 19.5% | 22.4% |
| Maximum | 68.9% | 79.3% |
| Range | 49.4% | 56.9% |
| Mean | 47.1% | 42.3% |
| Median | 45.8% | 43.7% |
| Interquartile 25% (IQ1) | 42.6% | 38.2% |
| Interquartile 75% (IQ3) | 54.4% | 45.4% |
| Interquartile Range (IQR) | 11.8% | 7.2% |
| Standard Deviation (Sample) | 11.0% | 8.6% |
| Standard Deviation (Population) | 10.9% | 8.6% |
Similar Demographics by Currently Married
Demographics Similar to Taiwanese by Currently Married
In terms of currently married, the demographic groups most similar to Taiwanese are Immigrants from Spain (45.8%, a difference of 0.010%), South American Indian (45.8%, a difference of 0.020%), Immigrants (45.8%, a difference of 0.040%), Immigrants from South America (45.7%, a difference of 0.080%), and Alsatian (45.7%, a difference of 0.090%).
| Demographics | Rating | Rank | Currently Married |
| Immigrants | Bosnia and Herzegovina | 22.2 /100 | #196 | Fair 46.1% |
| Immigrants | Kuwait | 21.7 /100 | #197 | Fair 46.1% |
| Immigrants | Colombia | 21.0 /100 | #198 | Fair 46.1% |
| Immigrants | Costa Rica | 19.6 /100 | #199 | Poor 46.0% |
| Creek | 17.2 /100 | #200 | Poor 46.0% |
| Malaysians | 15.3 /100 | #201 | Poor 45.9% |
| Immigrants | Albania | 14.5 /100 | #202 | Poor 45.9% |
| Taiwanese | 11.7 /100 | #203 | Poor 45.8% |
| Immigrants | Spain | 11.6 /100 | #204 | Poor 45.8% |
| South American Indians | 11.5 /100 | #205 | Poor 45.8% |
| Immigrants | Immigrants | 11.2 /100 | #206 | Poor 45.8% |
| Immigrants | South America | 10.8 /100 | #207 | Poor 45.7% |
| Alsatians | 10.8 /100 | #208 | Poor 45.7% |
| Immigrants | Micronesia | 8.8 /100 | #209 | Tragic 45.6% |
| Uruguayans | 7.9 /100 | #210 | Tragic 45.6% |
Demographics Similar to Japanese by Currently Married
In terms of currently married, the demographic groups most similar to Japanese are Immigrants from Ethiopia (44.5%, a difference of 0.070%), Immigrants from Cambodia (44.5%, a difference of 0.090%), Ethiopian (44.5%, a difference of 0.12%), Immigrants from Mexico (44.5%, a difference of 0.18%), and Mexican American Indian (44.5%, a difference of 0.18%).
| Demographics | Rating | Rank | Currently Married |
| Seminole | 0.9 /100 | #237 | Tragic 44.6% |
| Moroccans | 0.9 /100 | #238 | Tragic 44.6% |
| Immigrants | Mexico | 0.7 /100 | #239 | Tragic 44.5% |
| Mexican American Indians | 0.7 /100 | #240 | Tragic 44.5% |
| Ethiopians | 0.7 /100 | #241 | Tragic 44.5% |
| Immigrants | Cambodia | 0.7 /100 | #242 | Tragic 44.5% |
| Immigrants | Ethiopia | 0.7 /100 | #243 | Tragic 44.5% |
| Japanese | 0.6 /100 | #244 | Tragic 44.5% |
| Immigrants | Armenia | 0.4 /100 | #245 | Tragic 44.3% |
| Immigrants | Burma/Myanmar | 0.4 /100 | #246 | Tragic 44.3% |
| Ugandans | 0.4 /100 | #247 | Tragic 44.2% |
| Nicaraguans | 0.3 /100 | #248 | Tragic 44.2% |
| Immigrants | Cameroon | 0.3 /100 | #249 | Tragic 44.2% |
| Immigrants | Eastern Africa | 0.3 /100 | #250 | Tragic 44.2% |
| Blackfeet | 0.3 /100 | #251 | Tragic 44.2% |