Taiwanese vs Immigrants from Bahamas Currently Married
COMPARE
Taiwanese
Immigrants from Bahamas
Currently Married
Currently Married Comparison
Taiwanese
Immigrants from Bahamas
45.8%
CURRENTLY MARRIED
11.7/ 100
METRIC RATING
203rd/ 347
METRIC RANK
41.9%
CURRENTLY MARRIED
0.0/ 100
METRIC RATING
304th/ 347
METRIC RANK
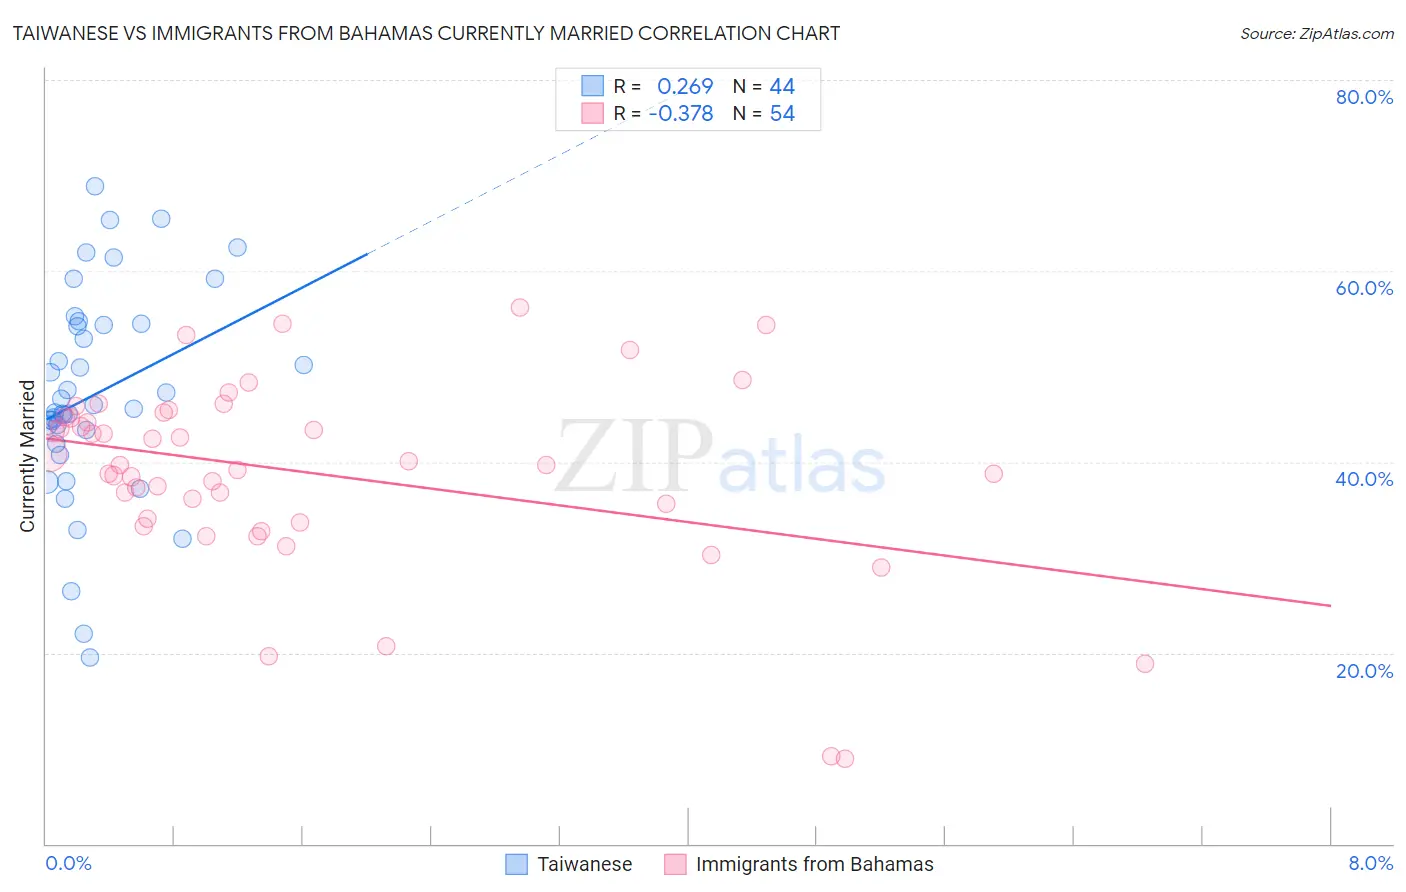
Taiwanese vs Immigrants from Bahamas Currently Married Correlation Chart
The statistical analysis conducted on geographies consisting of 31,720,118 people shows a weak positive correlation between the proportion of Taiwanese and percentage of population currently married in the United States with a correlation coefficient (R) of 0.269 and weighted average of 45.8%. Similarly, the statistical analysis conducted on geographies consisting of 104,648,272 people shows a mild negative correlation between the proportion of Immigrants from Bahamas and percentage of population currently married in the United States with a correlation coefficient (R) of -0.378 and weighted average of 41.9%, a difference of 9.2%.
Currently Married Correlation Summary
| Measurement | Taiwanese | Immigrants from Bahamas |
| Minimum | 19.5% | 8.9% |
| Maximum | 68.9% | 56.2% |
| Range | 49.4% | 47.3% |
| Mean | 47.1% | 38.9% |
| Median | 45.8% | 39.7% |
| Interquartile 25% (IQ1) | 42.6% | 34.0% |
| Interquartile 75% (IQ3) | 54.4% | 44.7% |
| Interquartile Range (IQR) | 11.8% | 10.6% |
| Standard Deviation (Sample) | 11.0% | 9.9% |
| Standard Deviation (Population) | 10.9% | 9.8% |
Similar Demographics by Currently Married
Demographics Similar to Taiwanese by Currently Married
In terms of currently married, the demographic groups most similar to Taiwanese are Immigrants from Spain (45.8%, a difference of 0.010%), South American Indian (45.8%, a difference of 0.020%), Immigrants (45.8%, a difference of 0.040%), Immigrants from South America (45.7%, a difference of 0.080%), and Alsatian (45.7%, a difference of 0.090%).
| Demographics | Rating | Rank | Currently Married |
| Immigrants | Bosnia and Herzegovina | 22.2 /100 | #196 | Fair 46.1% |
| Immigrants | Kuwait | 21.7 /100 | #197 | Fair 46.1% |
| Immigrants | Colombia | 21.0 /100 | #198 | Fair 46.1% |
| Immigrants | Costa Rica | 19.6 /100 | #199 | Poor 46.0% |
| Creek | 17.2 /100 | #200 | Poor 46.0% |
| Malaysians | 15.3 /100 | #201 | Poor 45.9% |
| Immigrants | Albania | 14.5 /100 | #202 | Poor 45.9% |
| Taiwanese | 11.7 /100 | #203 | Poor 45.8% |
| Immigrants | Spain | 11.6 /100 | #204 | Poor 45.8% |
| South American Indians | 11.5 /100 | #205 | Poor 45.8% |
| Immigrants | Immigrants | 11.2 /100 | #206 | Poor 45.8% |
| Immigrants | South America | 10.8 /100 | #207 | Poor 45.7% |
| Alsatians | 10.8 /100 | #208 | Poor 45.7% |
| Immigrants | Micronesia | 8.8 /100 | #209 | Tragic 45.6% |
| Uruguayans | 7.9 /100 | #210 | Tragic 45.6% |
Demographics Similar to Immigrants from Bahamas by Currently Married
In terms of currently married, the demographic groups most similar to Immigrants from Bahamas are Immigrants from Trinidad and Tobago (41.9%, a difference of 0.030%), Immigrants from Guyana (41.9%, a difference of 0.040%), Sioux (41.9%, a difference of 0.11%), Immigrants from Zaire (42.0%, a difference of 0.13%), and African (41.8%, a difference of 0.18%).
| Demographics | Rating | Rank | Currently Married |
| Cheyenne | 0.0 /100 | #297 | Tragic 42.2% |
| Immigrants | Honduras | 0.0 /100 | #298 | Tragic 42.2% |
| Liberians | 0.0 /100 | #299 | Tragic 42.2% |
| Belizeans | 0.0 /100 | #300 | Tragic 42.2% |
| Immigrants | Yemen | 0.0 /100 | #301 | Tragic 42.1% |
| Immigrants | Zaire | 0.0 /100 | #302 | Tragic 42.0% |
| Sioux | 0.0 /100 | #303 | Tragic 41.9% |
| Immigrants | Bahamas | 0.0 /100 | #304 | Tragic 41.9% |
| Immigrants | Trinidad and Tobago | 0.0 /100 | #305 | Tragic 41.9% |
| Immigrants | Guyana | 0.0 /100 | #306 | Tragic 41.9% |
| Africans | 0.0 /100 | #307 | Tragic 41.8% |
| Immigrants | Belize | 0.0 /100 | #308 | Tragic 41.8% |
| Immigrants | Liberia | 0.0 /100 | #309 | Tragic 41.8% |
| Guyanese | 0.0 /100 | #310 | Tragic 41.6% |
| Trinidadians and Tobagonians | 0.0 /100 | #311 | Tragic 41.5% |