Syrian vs German Russian Single Mother Households

COMPARE

Syrian
Race
Ancestry
AfghanAfricanAlaska NativeAlaskan AthabascanAlbanianAleutAlsatianAmericanApacheArabArapahoArgentineanArmenianAssyrian/Chaldean/SyriacAustralianAustrianBahamianBangladeshiBarbadianBasqueBelgianBelizeanBermudanBhutaneseBlackfeetBolivianBrazilianBritishBritish West IndianBulgarianBurmeseCajunCambodianCanadianCape VerdeanCarpatho RusynCelticCentral AmericanCentral American IndianCherokeeCheyenneChickasawChileanChineseChippewaChoctawColombianColvilleComancheCosta RicanCreeCreekCroatianCrowCubanCypriotCzechCzechoslovakianDanishDelawareDominicanDutchDutch West IndianEastern EuropeanEcuadorianEgyptianEnglishEstonianEthiopianEuropeanFijianFilipinoFinnishFrenchFrench American IndianFrench CanadianGermanGhanaianGreekGuamanian/ChamorroGuatemalanGuyaneseHaitianHmongHonduranHopiHoumaHungarianIcelanderIndian (Asian)IndonesianInupiatIranianIraqiIrishIroquoisIsraeliItalianJamaicanJapaneseJordanianKenyanKiowaKoreanLaotianLatvianLebaneseLiberianLithuanianLumbeeLuxembourgerMacedonianMalaysianMalteseMarshalleseMenomineeMexicanMexican American IndianMongolianMoroccanNative HawaiianNavajoNepaleseNew ZealanderNicaraguanNigerianNorthern EuropeanNorwegianOkinawanOsageOttawaPaiutePakistaniPalestinianPanamanianParaguayanPennsylvania GermanPeruvianPimaPolishPortuguesePotawatomiPuebloPuerto RicanPuget Sound SalishRomanianRussianSalvadoranSamoanScandinavianScotch-IrishScottishSeminoleSenegaleseSerbianShoshoneSierra LeoneanSiouxSlavicSlovakSloveneSomaliSouth AfricanSouth AmericanSouth American IndianSoviet UnionSpaniardSpanishSpanish AmericanSpanish American IndianSri LankanSubsaharan AfricanSudaneseSwedishSwissSyrianTaiwaneseThaiTlingit-HaidaTohono O'OdhamTonganTrinidadian and TobagonianTsimshianTurkishU.S. Virgin IslanderUgandanUkrainianUruguayanUteVenezuelanVietnameseWelshWest IndianYakamaYaquiYugoslavianYumanYup'ikZimbabwean
Immigration
NonimmigrantsImmigrantsAfghanistanAfricaAlbaniaArgentinaArmeniaAsiaAustraliaAustriaBahamasBangladeshBarbadosBelarusBelgiumBelizeBoliviaBosnia and HerzegovinaBrazilBulgariaBurma/MyanmarCabo VerdeCambodiaCameroonCanadaCaribbeanCentral AmericaChileChinaColombiaCongoCosta RicaCroatiaCubaCzechoslovakiaDenmarkDominicaDominican RepublicEastern AfricaEastern AsiaEastern EuropeEcuadorEgyptEl SalvadorEnglandEritreaEthiopiaEuropeFijiFranceGermanyGhanaGreeceGrenadaGuatemalaGuyanaHaitiHondurasHong KongHungaryIndiaIndonesiaIranIraqIrelandIsraelItalyJamaicaJapanJordanKazakhstanKenyaKoreaKuwaitLaosLatin AmericaLatviaLebanonLiberiaLithuaniaMalaysiaMexicoMicronesiaMiddle AfricaMoldovaMoroccoNepalNetherlandsNicaraguaNigeriaNorth AmericaNorth MacedoniaNorthern AfricaNorthern EuropeNorwayOceaniaPakistanPanamaPeruPhilippinesPolandPortugalRomaniaRussiaSaudi ArabiaScotlandSenegalSerbiaSierra LeoneSingaporeSomaliaSouth AfricaSouth AmericaSouth Central AsiaSouth Eastern AsiaSouthern EuropeSpainSri LankaSt. Vincent and the GrenadinesSudanSwedenSwitzerlandSyriaTaiwanThailandTrinidad and TobagoTurkeyUgandaUkraineUruguayUzbekistanVenezuelaVietnamWest IndiesWestern AfricaWestern AsiaWestern EuropeYemenZaireZimbabweAzores
German Russian
Race
Ancestry
AfghanAfricanAlaska NativeAlaskan AthabascanAlbanianAleutAlsatianAmericanApacheArabArapahoArgentineanArmenianAssyrian/Chaldean/SyriacAustralianAustrianBahamianBangladeshiBarbadianBasqueBelgianBelizeanBermudanBhutaneseBlackfeetBolivianBrazilianBritishBritish West IndianBulgarianBurmeseCajunCambodianCanadianCape VerdeanCarpatho RusynCelticCentral AmericanCentral American IndianCherokeeCheyenneChickasawChileanChineseChippewaChoctawColombianColvilleComancheCosta RicanCreeCreekCroatianCrowCubanCypriotCzechCzechoslovakianDanishDelawareDominicanDutchDutch West IndianEastern EuropeanEcuadorianEgyptianEnglishEstonianEthiopianEuropeanFijianFilipinoFinnishFrenchFrench American IndianFrench CanadianGermanGerman RussianGhanaianGreekGuamanian/ChamorroGuatemalanGuyaneseHaitianHmongHonduranHopiHoumaHungarianIcelanderIndian (Asian)IndonesianInupiatIranianIraqiIrishIroquoisIsraeliItalianJamaicanJapaneseJordanianKenyanKiowaKoreanLaotianLatvianLebaneseLiberianLithuanianLumbeeLuxembourgerMacedonianMalaysianMalteseMarshalleseMenomineeMexicanMexican American IndianMongolianMoroccanNative HawaiianNavajoNepaleseNew ZealanderNicaraguanNigerianNorthern EuropeanNorwegianOkinawanOsageOttawaPaiutePakistaniPalestinianPanamanianParaguayanPennsylvania GermanPeruvianPimaPolishPortuguesePotawatomiPuebloPuerto RicanPuget Sound SalishRomanianRussianSalvadoranSamoanScandinavianScotch-IrishScottishSeminoleSenegaleseSerbianShoshoneSierra LeoneanSiouxSlavicSlovakSloveneSomaliSouth AfricanSouth AmericanSouth American IndianSoviet UnionSpaniardSpanishSpanish AmericanSpanish American IndianSri LankanSubsaharan AfricanSudaneseSwedishSwissTaiwaneseThaiTlingit-HaidaTohono O'OdhamTonganTrinidadian and TobagonianTsimshianTurkishU.S. Virgin IslanderUgandanUkrainianUruguayanUteVenezuelanVietnameseWelshWest IndianYakamaYaquiYugoslavianYumanYup'ikZimbabwean
Immigration
NonimmigrantsImmigrantsAfghanistanAfricaAlbaniaArgentinaArmeniaAsiaAustraliaAustriaBahamasBangladeshBarbadosBelarusBelgiumBelizeBoliviaBosnia and HerzegovinaBrazilBulgariaBurma/MyanmarCabo VerdeCambodiaCameroonCanadaCaribbeanCentral AmericaChileChinaColombiaCongoCosta RicaCroatiaCubaCzechoslovakiaDenmarkDominicaDominican RepublicEastern AfricaEastern AsiaEastern EuropeEcuadorEgyptEl SalvadorEnglandEritreaEthiopiaEuropeFijiFranceGermanyGhanaGreeceGrenadaGuatemalaGuyanaHaitiHondurasHong KongHungaryIndiaIndonesiaIranIraqIrelandIsraelItalyJamaicaJapanJordanKazakhstanKenyaKoreaKuwaitLaosLatin AmericaLatviaLebanonLiberiaLithuaniaMalaysiaMexicoMicronesiaMiddle AfricaMoldovaMoroccoNepalNetherlandsNicaraguaNigeriaNorth AmericaNorth MacedoniaNorthern AfricaNorthern EuropeNorwayOceaniaPakistanPanamaPeruPhilippinesPolandPortugalRomaniaRussiaSaudi ArabiaScotlandSenegalSerbiaSierra LeoneSingaporeSomaliaSouth AfricaSouth AmericaSouth Central AsiaSouth Eastern AsiaSouthern EuropeSpainSri LankaSt. Vincent and the GrenadinesSudanSwedenSwitzerlandSyriaTaiwanThailandTrinidad and TobagoTurkeyUgandaUkraineUruguayUzbekistanVenezuelaVietnamWest IndiesWestern AfricaWestern AsiaWestern EuropeYemenZaireZimbabweAzores
Single Mother Households
Income
Poverty
Unemployment
Labor Participation
Family Structure
Vehicle Availability
Education Level
Disability

Single Mother Households Comparison

Syrians

German Russians

Excellent
Poor
6.0%
SINGLE MOTHER HOUSEHOLDS
86.0/ 100
METRIC RATING
139th/ 347
METRIC RANK
6.7%
SINGLE MOTHER HOUSEHOLDS
11.5/ 100
METRIC RATING
206th/ 347
METRIC RANK

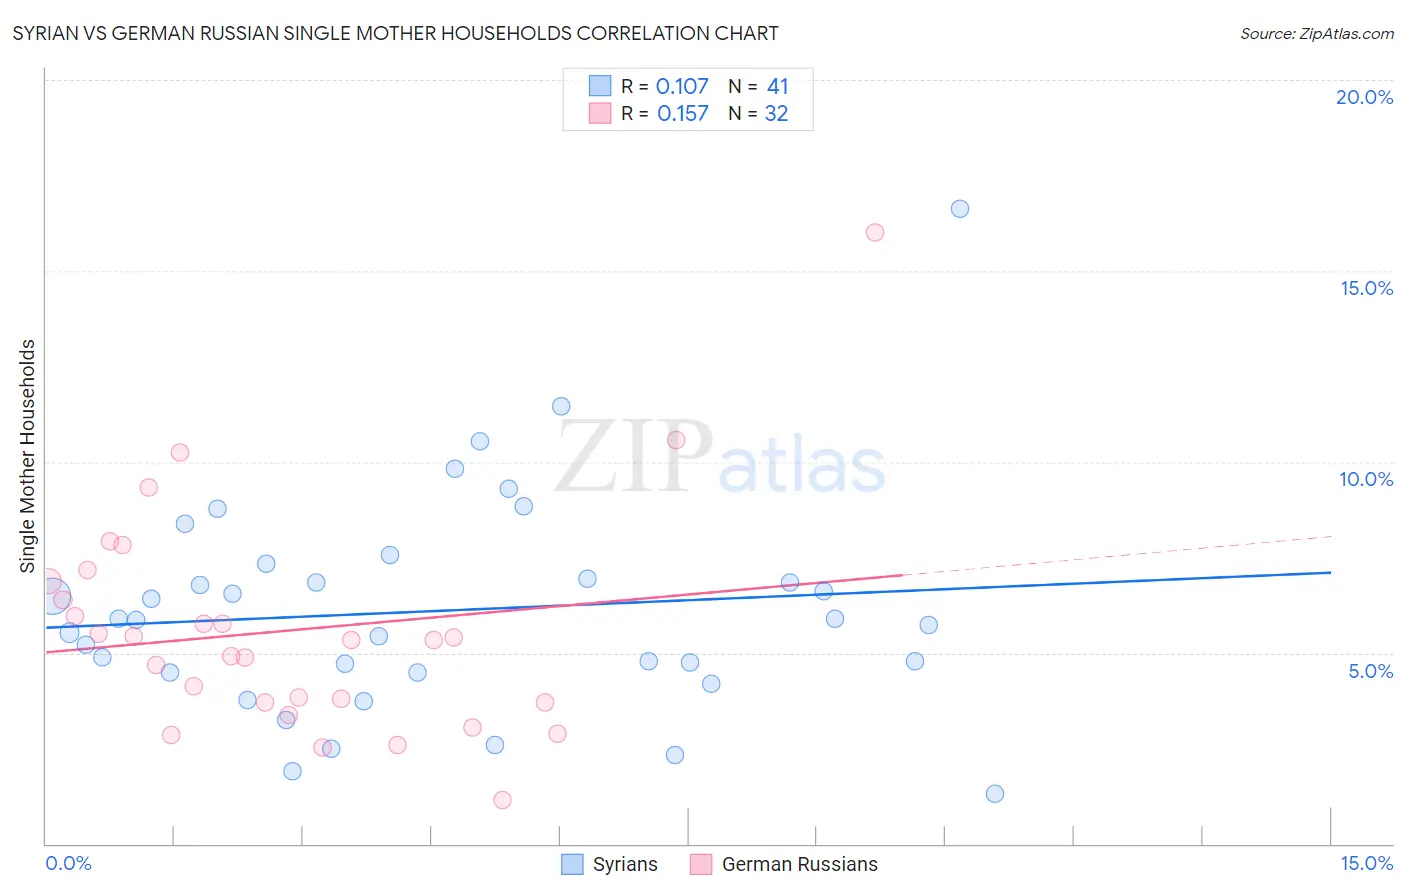
Syrian vs German Russian Single Mother Households Correlation Chart

The statistical analysis conducted on geographies consisting of 265,755,115 people shows a poor positive correlation between the proportion of Syrians and percentage of single mother households in the United States with a correlation coefficient (R) of 0.107 and weighted average of 6.0%. Similarly, the statistical analysis conducted on geographies consisting of 96,402,905 people shows a poor positive correlation between the proportion of German Russians and percentage of single mother households in the United States with a correlation coefficient (R) of 0.157 and weighted average of 6.7%, a difference of 11.1%.
Syrian vs German Russian Single Mother Households

Single Mother Households Correlation Summary

MeasurementSyrianGerman Russian
Minimum1.3%1.1%
Maximum16.6%16.0%
Range15.3%14.9%
Mean6.1%5.6%
Median5.8%5.3%
Interquartile 25% (IQ1)4.5%3.7%
Interquartile 75% (IQ3)7.1%6.6%
Interquartile Range (IQR)2.7%2.9%
Standard Deviation (Sample)2.9%2.9%
Standard Deviation (Population)2.8%2.9%

Similar Demographics by Single Mother Households

Demographics Similar to Syrians by Single Mother Households

In terms of single mother households, the demographic groups most similar to Syrians are French (6.0%, a difference of 0.070%), Tsimshian (6.0%, a difference of 0.17%), Immigrants from Egypt (6.0%, a difference of 0.22%), Icelander (6.0%, a difference of 0.23%), and Immigrants from Iraq (6.0%, a difference of 0.26%).
DemographicsRating | RankSingle Mother Households
Albanians
91.1
/100
|
#132
Exceptional
5.9%
Egyptians
90.7
/100
|
#133
Exceptional
5.9%
Canadians
90.5
/100
|
#134
Exceptional
5.9%
Immigrants | Saudi Arabia
90.2
/100
|
#135
Exceptional
5.9%
Jordanians
88.9
/100
|
#136
Excellent
6.0%
Immigrants | Pakistan
88.4
/100
|
#137
Excellent
6.0%
Icelanders
86.9
/100
|
#138
Excellent
6.0%
Syrians
86.0
/100
|
#139
Excellent
6.0%
French
85.7
/100
|
#140
Excellent
6.0%
Tsimshian
85.2
/100
|
#141
Excellent
6.0%
Immigrants | Egypt
85.0
/100
|
#142
Excellent
6.0%
Immigrants | Iraq
84.8
/100
|
#143
Excellent
6.0%
Koreans
84.4
/100
|
#144
Excellent
6.0%
Arabs
84.0
/100
|
#145
Excellent
6.0%
French Canadians
82.6
/100
|
#146
Excellent
6.0%

Demographics Similar to German Russians by Single Mother Households

In terms of single mother households, the demographic groups most similar to German Russians are Immigrants from South America (6.7%, a difference of 0.0%), Vietnamese (6.7%, a difference of 0.050%), Cree (6.7%, a difference of 0.080%), Immigrants from Fiji (6.7%, a difference of 0.10%), and Immigrants from Peru (6.7%, a difference of 0.11%).
DemographicsRating | RankSingle Mother Households
Potawatomi
15.5
/100
|
#199
Poor
6.6%
Immigrants | Ethiopia
14.7
/100
|
#200
Poor
6.6%
Venezuelans
12.9
/100
|
#201
Poor
6.6%
Guamanians/Chamorros
12.4
/100
|
#202
Poor
6.6%
Immigrants | Peru
12.0
/100
|
#203
Poor
6.7%
Immigrants | Fiji
11.9
/100
|
#204
Poor
6.7%
Cree
11.9
/100
|
#205
Poor
6.7%
German Russians
11.5
/100
|
#206
Poor
6.7%
Immigrants | South America
11.5
/100
|
#207
Poor
6.7%
Vietnamese
11.3
/100
|
#208
Poor
6.7%
Immigrants | Colombia
10.5
/100
|
#209
Poor
6.7%
Immigrants | Nonimmigrants
10.4
/100
|
#210
Poor
6.7%
Immigrants | Venezuela
8.5
/100
|
#211
Tragic
6.7%
Immigrants | Eritrea
8.4
/100
|
#212
Tragic
6.7%
Immigrants | Costa Rica
8.2
/100
|
#213
Tragic
6.7%