Polish vs German Russian Single Mother Households
COMPARE
Polish
German Russian
Single Mother Households
Single Mother Households Comparison
Poles
German Russians
5.6%
SINGLE MOTHER HOUSEHOLDS
98.6/ 100
METRIC RATING
62nd/ 347
METRIC RANK
6.7%
SINGLE MOTHER HOUSEHOLDS
11.5/ 100
METRIC RATING
206th/ 347
METRIC RANK
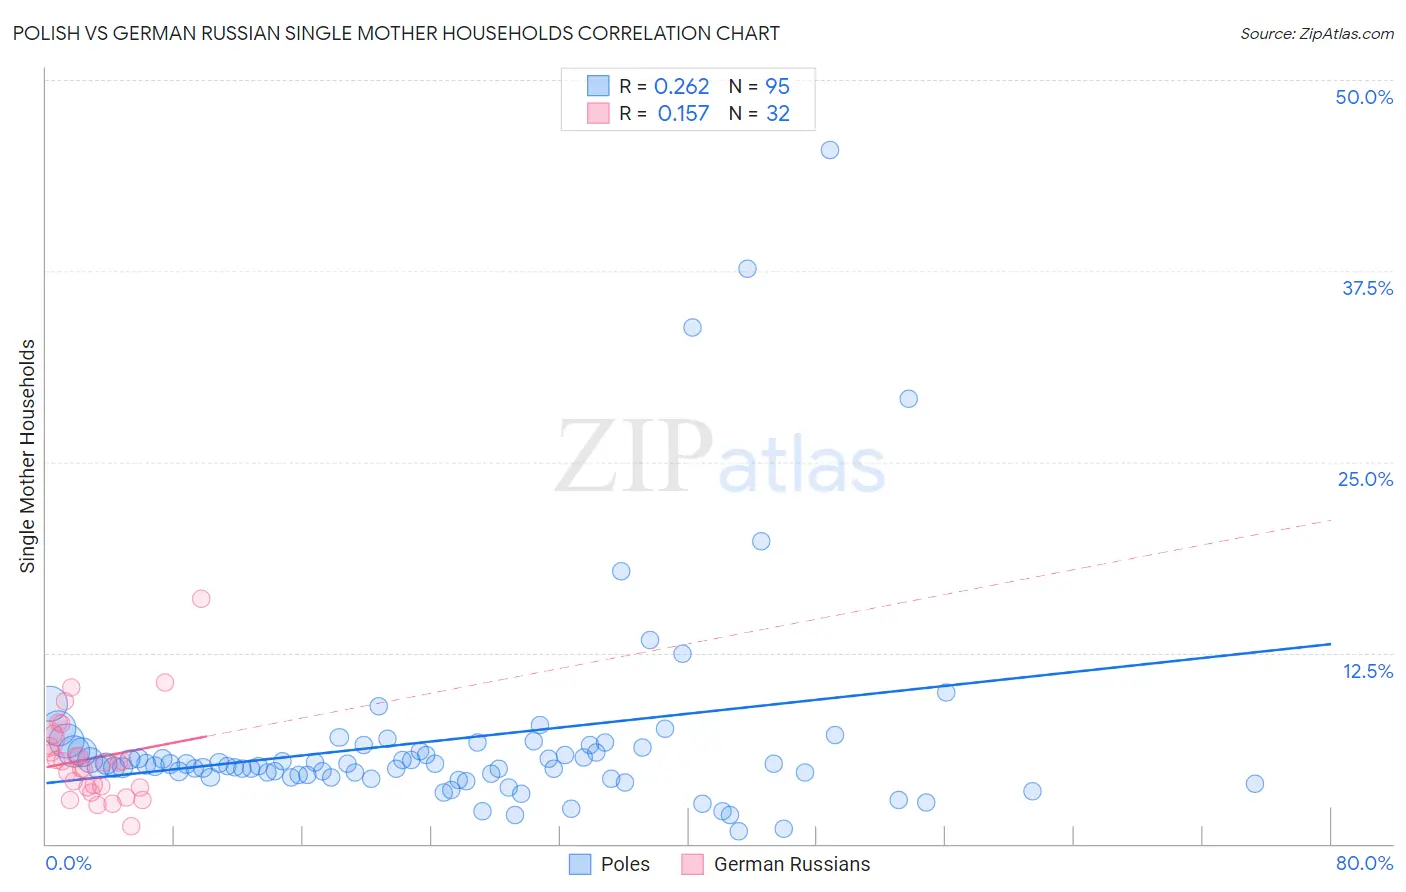
Polish vs German Russian Single Mother Households Correlation Chart
The statistical analysis conducted on geographies consisting of 555,545,245 people shows a weak positive correlation between the proportion of Poles and percentage of single mother households in the United States with a correlation coefficient (R) of 0.262 and weighted average of 5.6%. Similarly, the statistical analysis conducted on geographies consisting of 96,402,905 people shows a poor positive correlation between the proportion of German Russians and percentage of single mother households in the United States with a correlation coefficient (R) of 0.157 and weighted average of 6.7%, a difference of 19.6%.
Single Mother Households Correlation Summary
| Measurement | Polish | German Russian |
| Minimum | 0.85% | 1.1% |
| Maximum | 45.5% | 16.0% |
| Range | 44.6% | 14.9% |
| Mean | 6.8% | 5.6% |
| Median | 5.2% | 5.3% |
| Interquartile 25% (IQ1) | 4.4% | 3.7% |
| Interquartile 75% (IQ3) | 6.3% | 6.6% |
| Interquartile Range (IQR) | 1.9% | 2.9% |
| Standard Deviation (Sample) | 7.0% | 2.9% |
| Standard Deviation (Population) | 6.9% | 2.9% |
Similar Demographics by Single Mother Households
Demographics Similar to Poles by Single Mother Households
In terms of single mother households, the demographic groups most similar to Poles are Australian (5.6%, a difference of 0.010%), Immigrants from North Macedonia (5.6%, a difference of 0.070%), Immigrants from Norway (5.6%, a difference of 0.080%), Immigrants from France (5.6%, a difference of 0.10%), and Greek (5.6%, a difference of 0.15%).
| Demographics | Rating | Rank | Single Mother Households |
| Immigrants | Denmark | 99.1 /100 | #55 | Exceptional 5.5% |
| Immigrants | Romania | 99.0 /100 | #56 | Exceptional 5.5% |
| Immigrants | Europe | 99.0 /100 | #57 | Exceptional 5.5% |
| Danes | 98.9 /100 | #58 | Exceptional 5.5% |
| Luxembourgers | 98.7 /100 | #59 | Exceptional 5.6% |
| Immigrants | Norway | 98.7 /100 | #60 | Exceptional 5.6% |
| Australians | 98.7 /100 | #61 | Exceptional 5.6% |
| Poles | 98.6 /100 | #62 | Exceptional 5.6% |
| Immigrants | North Macedonia | 98.6 /100 | #63 | Exceptional 5.6% |
| Immigrants | France | 98.6 /100 | #64 | Exceptional 5.6% |
| Greeks | 98.6 /100 | #65 | Exceptional 5.6% |
| Immigrants | Canada | 98.5 /100 | #66 | Exceptional 5.6% |
| Italians | 98.5 /100 | #67 | Exceptional 5.6% |
| Immigrants | Bulgaria | 98.5 /100 | #68 | Exceptional 5.6% |
| Asians | 98.5 /100 | #69 | Exceptional 5.6% |
Demographics Similar to German Russians by Single Mother Households
In terms of single mother households, the demographic groups most similar to German Russians are Immigrants from South America (6.7%, a difference of 0.0%), Vietnamese (6.7%, a difference of 0.050%), Cree (6.7%, a difference of 0.080%), Immigrants from Fiji (6.7%, a difference of 0.10%), and Immigrants from Peru (6.7%, a difference of 0.11%).
| Demographics | Rating | Rank | Single Mother Households |
| Potawatomi | 15.5 /100 | #199 | Poor 6.6% |
| Immigrants | Ethiopia | 14.7 /100 | #200 | Poor 6.6% |
| Venezuelans | 12.9 /100 | #201 | Poor 6.6% |
| Guamanians/Chamorros | 12.4 /100 | #202 | Poor 6.6% |
| Immigrants | Peru | 12.0 /100 | #203 | Poor 6.7% |
| Immigrants | Fiji | 11.9 /100 | #204 | Poor 6.7% |
| Cree | 11.9 /100 | #205 | Poor 6.7% |
| German Russians | 11.5 /100 | #206 | Poor 6.7% |
| Immigrants | South America | 11.5 /100 | #207 | Poor 6.7% |
| Vietnamese | 11.3 /100 | #208 | Poor 6.7% |
| Immigrants | Colombia | 10.5 /100 | #209 | Poor 6.7% |
| Immigrants | Nonimmigrants | 10.4 /100 | #210 | Poor 6.7% |
| Immigrants | Venezuela | 8.5 /100 | #211 | Tragic 6.7% |
| Immigrants | Eritrea | 8.4 /100 | #212 | Tragic 6.7% |
| Immigrants | Costa Rica | 8.2 /100 | #213 | Tragic 6.7% |