Swiss vs Immigrants from Bosnia and Herzegovina Married-couple Households
COMPARE
Swiss
Immigrants from Bosnia and Herzegovina
Married-couple Households
Married-couple Households Comparison
Swiss
Immigrants from Bosnia and Herzegovina
49.9%
MARRIED-COUPLE HOUSEHOLDS
100.0/ 100
METRIC RATING
12th/ 347
METRIC RANK
44.4%
MARRIED-COUPLE HOUSEHOLDS
1.0/ 100
METRIC RATING
241st/ 347
METRIC RANK
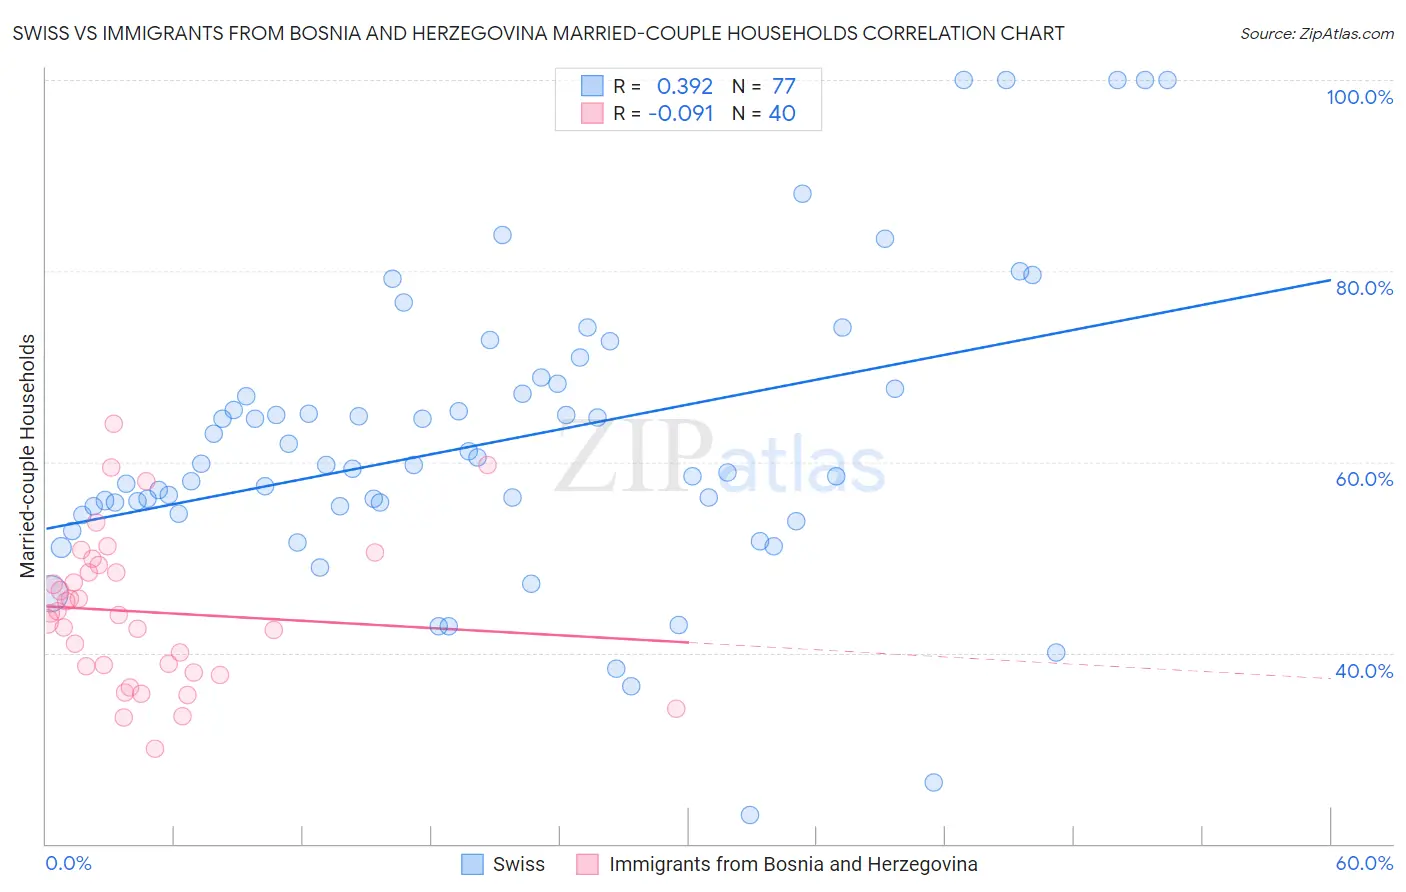
Swiss vs Immigrants from Bosnia and Herzegovina Married-couple Households Correlation Chart
The statistical analysis conducted on geographies consisting of 464,742,560 people shows a mild positive correlation between the proportion of Swiss and percentage of married-couple family households in the United States with a correlation coefficient (R) of 0.392 and weighted average of 49.9%. Similarly, the statistical analysis conducted on geographies consisting of 156,805,510 people shows a slight negative correlation between the proportion of Immigrants from Bosnia and Herzegovina and percentage of married-couple family households in the United States with a correlation coefficient (R) of -0.091 and weighted average of 44.4%, a difference of 12.4%.
Married-couple Households Correlation Summary
| Measurement | Swiss | Immigrants from Bosnia and Herzegovina |
| Minimum | 23.0% | 29.9% |
| Maximum | 100.0% | 64.0% |
| Range | 77.0% | 34.1% |
| Mean | 62.1% | 44.3% |
| Median | 59.6% | 44.0% |
| Interquartile 25% (IQ1) | 55.0% | 38.2% |
| Interquartile 75% (IQ3) | 67.9% | 48.8% |
| Interquartile Range (IQR) | 12.9% | 10.6% |
| Standard Deviation (Sample) | 15.5% | 7.9% |
| Standard Deviation (Population) | 15.4% | 7.8% |
Similar Demographics by Married-couple Households
Demographics Similar to Swiss by Married-couple Households
In terms of married-couple households, the demographic groups most similar to Swiss are Immigrants from Korea (49.9%, a difference of 0.17%), Burmese (49.8%, a difference of 0.30%), Immigrants from Pakistan (50.1%, a difference of 0.37%), Korean (49.7%, a difference of 0.44%), and Swedish (49.7%, a difference of 0.47%).
| Demographics | Rating | Rank | Married-couple Households |
| Tongans | 100.0 /100 | #5 | Exceptional 51.6% |
| Danes | 100.0 /100 | #6 | Exceptional 51.1% |
| Filipinos | 100.0 /100 | #7 | Exceptional 51.0% |
| Immigrants | South Central Asia | 100.0 /100 | #8 | Exceptional 50.6% |
| Pennsylvania Germans | 100.0 /100 | #9 | Exceptional 50.4% |
| Chinese | 100.0 /100 | #10 | Exceptional 50.4% |
| Immigrants | Pakistan | 100.0 /100 | #11 | Exceptional 50.1% |
| Swiss | 100.0 /100 | #12 | Exceptional 49.9% |
| Immigrants | Korea | 100.0 /100 | #13 | Exceptional 49.9% |
| Burmese | 100.0 /100 | #14 | Exceptional 49.8% |
| Koreans | 99.9 /100 | #15 | Exceptional 49.7% |
| Swedes | 99.9 /100 | #16 | Exceptional 49.7% |
| Immigrants | Hong Kong | 99.9 /100 | #17 | Exceptional 49.6% |
| English | 99.9 /100 | #18 | Exceptional 49.6% |
| Europeans | 99.9 /100 | #19 | Exceptional 49.6% |
Demographics Similar to Immigrants from Bosnia and Herzegovina by Married-couple Households
In terms of married-couple households, the demographic groups most similar to Immigrants from Bosnia and Herzegovina are Ute (44.4%, a difference of 0.0%), Immigrants from Albania (44.4%, a difference of 0.040%), Spanish American (44.5%, a difference of 0.080%), Immigrants from Uruguay (44.5%, a difference of 0.10%), and Immigrants from Saudi Arabia (44.4%, a difference of 0.11%).
| Demographics | Rating | Rank | Married-couple Households |
| Immigrants | Panama | 1.3 /100 | #234 | Tragic 44.6% |
| Immigrants | Nicaragua | 1.2 /100 | #235 | Tragic 44.5% |
| Yaqui | 1.2 /100 | #236 | Tragic 44.5% |
| Comanche | 1.2 /100 | #237 | Tragic 44.5% |
| Immigrants | Uruguay | 1.1 /100 | #238 | Tragic 44.5% |
| Spanish Americans | 1.1 /100 | #239 | Tragic 44.5% |
| Ute | 1.0 /100 | #240 | Tragic 44.4% |
| Immigrants | Bosnia and Herzegovina | 1.0 /100 | #241 | Tragic 44.4% |
| Immigrants | Albania | 1.0 /100 | #242 | Tragic 44.4% |
| Immigrants | Saudi Arabia | 0.9 /100 | #243 | Tragic 44.4% |
| Immigrants | Armenia | 0.7 /100 | #244 | Tragic 44.3% |
| Immigrants | El Salvador | 0.7 /100 | #245 | Tragic 44.3% |
| Immigrants | Cuba | 0.6 /100 | #246 | Tragic 44.2% |
| Immigrants | Morocco | 0.6 /100 | #247 | Tragic 44.2% |
| Yup'ik | 0.4 /100 | #248 | Tragic 44.1% |