Immigrants from Australia vs Immigrants from Bosnia and Herzegovina Married-couple Households
COMPARE
Immigrants from Australia
Immigrants from Bosnia and Herzegovina
Married-couple Households
Married-couple Households Comparison
Immigrants from Australia
Immigrants from Bosnia and Herzegovina
46.5%
MARRIED-COUPLE HOUSEHOLDS
54.6/ 100
METRIC RATING
172nd/ 347
METRIC RANK
44.4%
MARRIED-COUPLE HOUSEHOLDS
1.0/ 100
METRIC RATING
241st/ 347
METRIC RANK
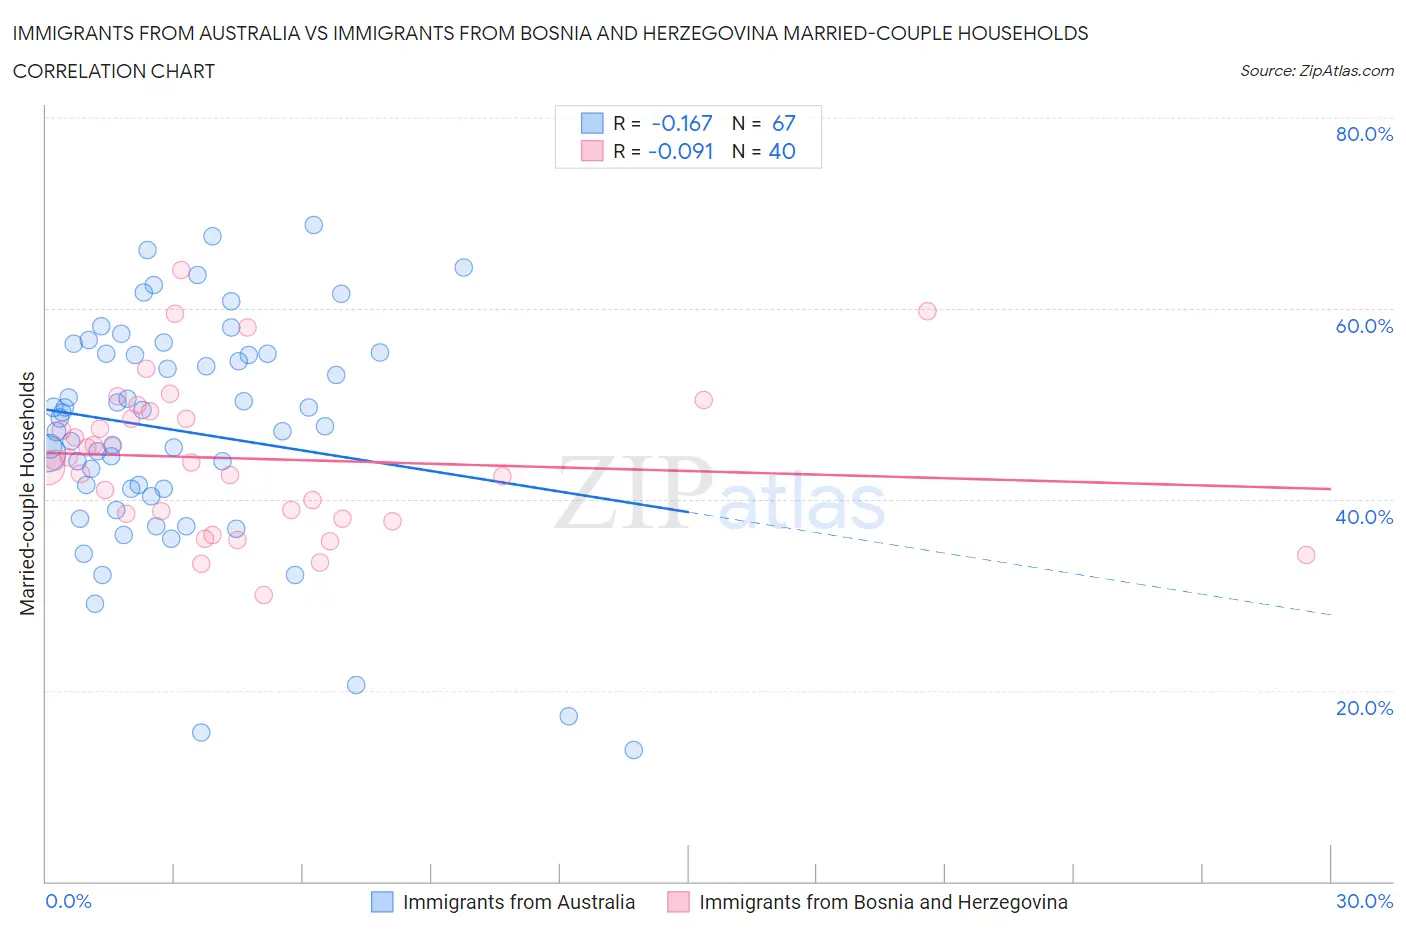
Immigrants from Australia vs Immigrants from Bosnia and Herzegovina Married-couple Households Correlation Chart
The statistical analysis conducted on geographies consisting of 227,144,828 people shows a poor negative correlation between the proportion of Immigrants from Australia and percentage of married-couple family households in the United States with a correlation coefficient (R) of -0.167 and weighted average of 46.5%. Similarly, the statistical analysis conducted on geographies consisting of 156,805,510 people shows a slight negative correlation between the proportion of Immigrants from Bosnia and Herzegovina and percentage of married-couple family households in the United States with a correlation coefficient (R) of -0.091 and weighted average of 44.4%, a difference of 4.7%.
Married-couple Households Correlation Summary
| Measurement | Immigrants from Australia | Immigrants from Bosnia and Herzegovina |
| Minimum | 13.7% | 29.9% |
| Maximum | 68.8% | 64.0% |
| Range | 55.0% | 34.1% |
| Mean | 47.2% | 44.3% |
| Median | 48.5% | 44.0% |
| Interquartile 25% (IQ1) | 41.1% | 38.2% |
| Interquartile 75% (IQ3) | 55.3% | 48.8% |
| Interquartile Range (IQR) | 14.1% | 10.6% |
| Standard Deviation (Sample) | 12.0% | 7.9% |
| Standard Deviation (Population) | 11.9% | 7.8% |
Similar Demographics by Married-couple Households
Demographics Similar to Immigrants from Australia by Married-couple Households
In terms of married-couple households, the demographic groups most similar to Immigrants from Australia are Immigrants from Chile (46.5%, a difference of 0.040%), Immigrants from Norway (46.5%, a difference of 0.10%), South American (46.6%, a difference of 0.13%), Immigrants from Mexico (46.4%, a difference of 0.17%), and Spanish American Indian (46.6%, a difference of 0.18%).
| Demographics | Rating | Rank | Married-couple Households |
| Immigrants | Southern Europe | 69.9 /100 | #165 | Good 46.8% |
| Cherokee | 65.7 /100 | #166 | Good 46.7% |
| Immigrants | Croatia | 64.2 /100 | #167 | Good 46.7% |
| Israelis | 62.3 /100 | #168 | Good 46.7% |
| Spanish American Indians | 59.4 /100 | #169 | Average 46.6% |
| South Americans | 58.0 /100 | #170 | Average 46.6% |
| Immigrants | Chile | 55.7 /100 | #171 | Average 46.5% |
| Immigrants | Australia | 54.6 /100 | #172 | Average 46.5% |
| Immigrants | Norway | 52.0 /100 | #173 | Average 46.5% |
| Immigrants | Mexico | 50.0 /100 | #174 | Average 46.4% |
| Immigrants | Colombia | 46.1 /100 | #175 | Average 46.4% |
| Cajuns | 45.2 /100 | #176 | Average 46.4% |
| Immigrants | Immigrants | 43.8 /100 | #177 | Average 46.3% |
| Immigrants | Costa Rica | 43.4 /100 | #178 | Average 46.3% |
| Immigrants | Zimbabwe | 43.0 /100 | #179 | Average 46.3% |
Demographics Similar to Immigrants from Bosnia and Herzegovina by Married-couple Households
In terms of married-couple households, the demographic groups most similar to Immigrants from Bosnia and Herzegovina are Ute (44.4%, a difference of 0.0%), Immigrants from Albania (44.4%, a difference of 0.040%), Spanish American (44.5%, a difference of 0.080%), Immigrants from Uruguay (44.5%, a difference of 0.10%), and Immigrants from Saudi Arabia (44.4%, a difference of 0.11%).
| Demographics | Rating | Rank | Married-couple Households |
| Immigrants | Panama | 1.3 /100 | #234 | Tragic 44.6% |
| Immigrants | Nicaragua | 1.2 /100 | #235 | Tragic 44.5% |
| Yaqui | 1.2 /100 | #236 | Tragic 44.5% |
| Comanche | 1.2 /100 | #237 | Tragic 44.5% |
| Immigrants | Uruguay | 1.1 /100 | #238 | Tragic 44.5% |
| Spanish Americans | 1.1 /100 | #239 | Tragic 44.5% |
| Ute | 1.0 /100 | #240 | Tragic 44.4% |
| Immigrants | Bosnia and Herzegovina | 1.0 /100 | #241 | Tragic 44.4% |
| Immigrants | Albania | 1.0 /100 | #242 | Tragic 44.4% |
| Immigrants | Saudi Arabia | 0.9 /100 | #243 | Tragic 44.4% |
| Immigrants | Armenia | 0.7 /100 | #244 | Tragic 44.3% |
| Immigrants | El Salvador | 0.7 /100 | #245 | Tragic 44.3% |
| Immigrants | Cuba | 0.6 /100 | #246 | Tragic 44.2% |
| Immigrants | Morocco | 0.6 /100 | #247 | Tragic 44.2% |
| Yup'ik | 0.4 /100 | #248 | Tragic 44.1% |