Swedish vs Soviet Union Married-couple Households
COMPARE
Swedish
Soviet Union
Married-couple Households
Married-couple Households Comparison
Swedes
Soviet Union
49.7%
MARRIED-COUPLE HOUSEHOLDS
99.9/ 100
METRIC RATING
16th/ 347
METRIC RANK
44.6%
MARRIED-COUPLE HOUSEHOLDS
1.6/ 100
METRIC RATING
230th/ 347
METRIC RANK
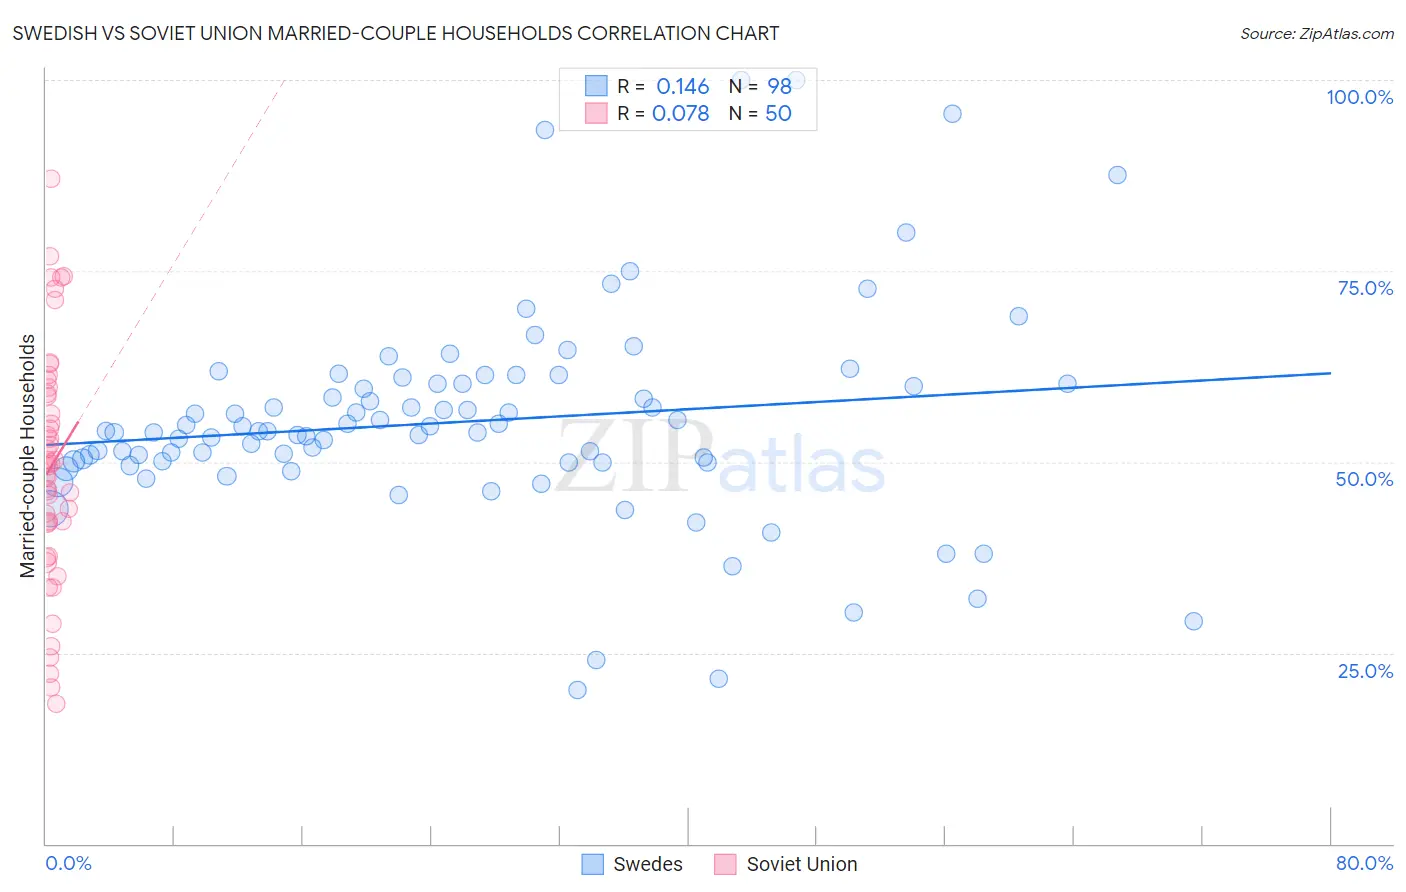
Swedish vs Soviet Union Married-couple Households Correlation Chart
The statistical analysis conducted on geographies consisting of 538,743,335 people shows a poor positive correlation between the proportion of Swedes and percentage of married-couple family households in the United States with a correlation coefficient (R) of 0.146 and weighted average of 49.7%. Similarly, the statistical analysis conducted on geographies consisting of 43,509,630 people shows a slight positive correlation between the proportion of Soviet Union and percentage of married-couple family households in the United States with a correlation coefficient (R) of 0.078 and weighted average of 44.6%, a difference of 11.4%.
Married-couple Households Correlation Summary
| Measurement | Swedish | Soviet Union |
| Minimum | 20.2% | 18.4% |
| Maximum | 100.0% | 87.0% |
| Range | 79.8% | 68.6% |
| Mean | 55.3% | 49.4% |
| Median | 54.0% | 49.6% |
| Interquartile 25% (IQ1) | 50.0% | 41.9% |
| Interquartile 75% (IQ3) | 60.2% | 58.9% |
| Interquartile Range (IQR) | 10.2% | 17.0% |
| Standard Deviation (Sample) | 13.9% | 15.5% |
| Standard Deviation (Population) | 13.8% | 15.3% |
Similar Demographics by Married-couple Households
Demographics Similar to Swedes by Married-couple Households
In terms of married-couple households, the demographic groups most similar to Swedes are Korean (49.7%, a difference of 0.030%), Immigrants from Hong Kong (49.6%, a difference of 0.15%), English (49.6%, a difference of 0.16%), Burmese (49.8%, a difference of 0.18%), and Immigrants from Korea (49.9%, a difference of 0.30%).
| Demographics | Rating | Rank | Married-couple Households |
| Pennsylvania Germans | 100.0 /100 | #9 | Exceptional 50.4% |
| Chinese | 100.0 /100 | #10 | Exceptional 50.4% |
| Immigrants | Pakistan | 100.0 /100 | #11 | Exceptional 50.1% |
| Swiss | 100.0 /100 | #12 | Exceptional 49.9% |
| Immigrants | Korea | 100.0 /100 | #13 | Exceptional 49.9% |
| Burmese | 100.0 /100 | #14 | Exceptional 49.8% |
| Koreans | 99.9 /100 | #15 | Exceptional 49.7% |
| Swedes | 99.9 /100 | #16 | Exceptional 49.7% |
| Immigrants | Hong Kong | 99.9 /100 | #17 | Exceptional 49.6% |
| English | 99.9 /100 | #18 | Exceptional 49.6% |
| Europeans | 99.9 /100 | #19 | Exceptional 49.6% |
| Scandinavians | 99.9 /100 | #20 | Exceptional 49.6% |
| Norwegians | 99.9 /100 | #21 | Exceptional 49.5% |
| Asians | 99.9 /100 | #22 | Exceptional 49.5% |
| Dutch | 99.9 /100 | #23 | Exceptional 49.5% |
Demographics Similar to Soviet Union by Married-couple Households
In terms of married-couple households, the demographic groups most similar to Soviet Union are Houma (44.6%, a difference of 0.010%), Marshallese (44.6%, a difference of 0.010%), Immigrants from Latin America (44.7%, a difference of 0.040%), Immigrants from Uganda (44.6%, a difference of 0.050%), and Kenyan (44.7%, a difference of 0.090%).
| Demographics | Rating | Rank | Married-couple Households |
| Immigrants | Cambodia | 2.7 /100 | #223 | Tragic 44.9% |
| Immigrants | Micronesia | 2.6 /100 | #224 | Tragic 44.9% |
| Dutch West Indians | 2.6 /100 | #225 | Tragic 44.9% |
| Alsatians | 2.3 /100 | #226 | Tragic 44.8% |
| Salvadorans | 1.9 /100 | #227 | Tragic 44.7% |
| Kenyans | 1.7 /100 | #228 | Tragic 44.7% |
| Immigrants | Latin America | 1.6 /100 | #229 | Tragic 44.7% |
| Soviet Union | 1.6 /100 | #230 | Tragic 44.6% |
| Houma | 1.5 /100 | #231 | Tragic 44.6% |
| Marshallese | 1.5 /100 | #232 | Tragic 44.6% |
| Immigrants | Uganda | 1.5 /100 | #233 | Tragic 44.6% |
| Immigrants | Panama | 1.3 /100 | #234 | Tragic 44.6% |
| Immigrants | Nicaragua | 1.2 /100 | #235 | Tragic 44.5% |
| Yaqui | 1.2 /100 | #236 | Tragic 44.5% |
| Comanche | 1.2 /100 | #237 | Tragic 44.5% |