Subsaharan African vs Immigrants from Western Asia Family Households with Children
COMPARE
Subsaharan African
Immigrants from Western Asia
Family Households with Children
Family Households with Children Comparison
Sub-Saharan Africans
Immigrants from Western Asia
27.6%
FAMILY HOUSEHOLDS WITH CHILDREN
67.5/ 100
METRIC RATING
160th/ 347
METRIC RANK
27.9%
FAMILY HOUSEHOLDS WITH CHILDREN
93.6/ 100
METRIC RATING
121st/ 347
METRIC RANK
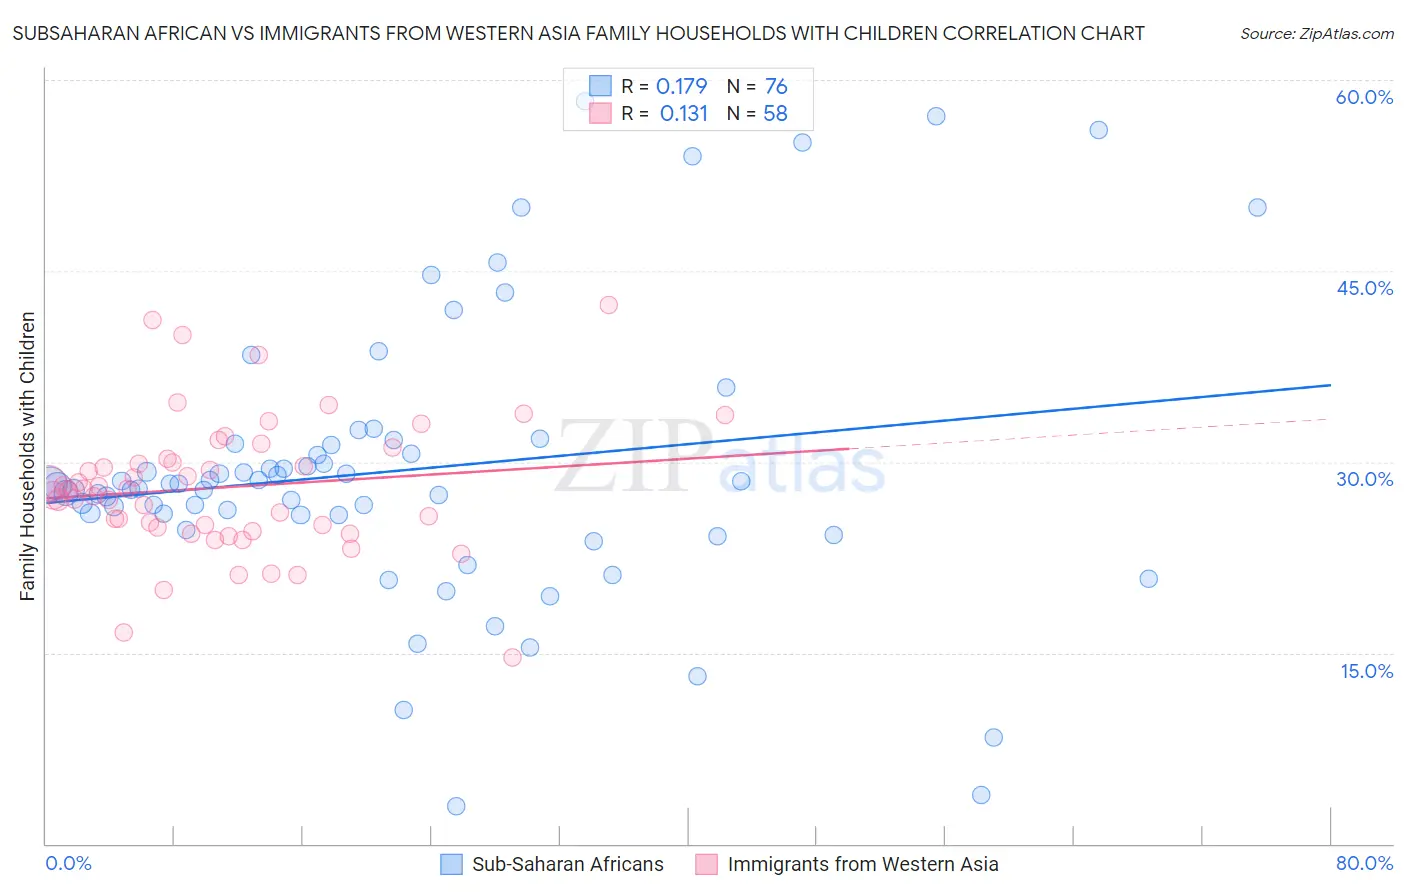
Subsaharan African vs Immigrants from Western Asia Family Households with Children Correlation Chart
The statistical analysis conducted on geographies consisting of 507,337,784 people shows a poor positive correlation between the proportion of Sub-Saharan Africans and percentage of family households with children in the United States with a correlation coefficient (R) of 0.179 and weighted average of 27.6%. Similarly, the statistical analysis conducted on geographies consisting of 404,015,285 people shows a poor positive correlation between the proportion of Immigrants from Western Asia and percentage of family households with children in the United States with a correlation coefficient (R) of 0.131 and weighted average of 27.9%, a difference of 1.1%.
Family Households with Children Correlation Summary
| Measurement | Subsaharan African | Immigrants from Western Asia |
| Minimum | 3.0% | 14.6% |
| Maximum | 58.3% | 42.3% |
| Range | 55.4% | 27.6% |
| Mean | 29.4% | 28.0% |
| Median | 28.2% | 27.8% |
| Interquartile 25% (IQ1) | 25.8% | 24.9% |
| Interquartile 75% (IQ3) | 31.4% | 30.3% |
| Interquartile Range (IQR) | 5.6% | 5.4% |
| Standard Deviation (Sample) | 11.1% | 5.3% |
| Standard Deviation (Population) | 11.0% | 5.3% |
Similar Demographics by Family Households with Children
Demographics Similar to Sub-Saharan Africans by Family Households with Children
In terms of family households with children, the demographic groups most similar to Sub-Saharan Africans are Alaskan Athabascan (27.6%, a difference of 0.010%), Immigrants from Bangladesh (27.6%, a difference of 0.010%), Czech (27.5%, a difference of 0.050%), Immigrants from Hong Kong (27.5%, a difference of 0.060%), and Romanian (27.6%, a difference of 0.080%).
| Demographics | Rating | Rank | Family Households with Children |
| Immigrants | Cabo Verde | 75.6 /100 | #153 | Good 27.6% |
| Icelanders | 75.3 /100 | #154 | Good 27.6% |
| Comanche | 74.8 /100 | #155 | Good 27.6% |
| Hungarians | 74.6 /100 | #156 | Good 27.6% |
| Indians (Asian) | 71.6 /100 | #157 | Good 27.6% |
| Romanians | 70.8 /100 | #158 | Good 27.6% |
| Mongolians | 70.7 /100 | #159 | Good 27.6% |
| Sub-Saharan Africans | 67.5 /100 | #160 | Good 27.6% |
| Alaskan Athabascans | 67.1 /100 | #161 | Good 27.6% |
| Immigrants | Bangladesh | 67.0 /100 | #162 | Good 27.6% |
| Czechs | 65.3 /100 | #163 | Good 27.5% |
| Immigrants | Hong Kong | 64.9 /100 | #164 | Good 27.5% |
| Immigrants | South Africa | 61.3 /100 | #165 | Good 27.5% |
| Immigrants | Nonimmigrants | 61.2 /100 | #166 | Good 27.5% |
| Dominicans | 61.1 /100 | #167 | Good 27.5% |
Demographics Similar to Immigrants from Western Asia by Family Households with Children
In terms of family households with children, the demographic groups most similar to Immigrants from Western Asia are Immigrants from Zimbabwe (27.8%, a difference of 0.070%), Immigrants from Northern Africa (27.8%, a difference of 0.14%), European (27.9%, a difference of 0.19%), Immigrants from Singapore (27.8%, a difference of 0.21%), and Ecuadorian (27.8%, a difference of 0.21%).
| Demographics | Rating | Rank | Family Households with Children |
| South American Indians | 96.9 /100 | #114 | Exceptional 28.0% |
| Immigrants | Africa | 96.8 /100 | #115 | Exceptional 28.0% |
| Pakistanis | 96.0 /100 | #116 | Exceptional 27.9% |
| Immigrants | Malaysia | 95.9 /100 | #117 | Exceptional 27.9% |
| Central American Indians | 95.9 /100 | #118 | Exceptional 27.9% |
| Zimbabweans | 95.6 /100 | #119 | Exceptional 27.9% |
| Europeans | 95.4 /100 | #120 | Exceptional 27.9% |
| Immigrants | Western Asia | 93.6 /100 | #121 | Exceptional 27.9% |
| Immigrants | Zimbabwe | 92.8 /100 | #122 | Exceptional 27.8% |
| Immigrants | Northern Africa | 91.8 /100 | #123 | Exceptional 27.8% |
| Immigrants | Singapore | 90.8 /100 | #124 | Exceptional 27.8% |
| Ecuadorians | 90.8 /100 | #125 | Exceptional 27.8% |
| Immigrants | Ethiopia | 90.5 /100 | #126 | Exceptional 27.8% |
| Belizeans | 90.0 /100 | #127 | Exceptional 27.8% |
| Syrians | 89.7 /100 | #128 | Excellent 27.8% |