Sri Lankan vs Vietnamese Currently Married
COMPARE
Sri Lankan
Vietnamese
Currently Married
Currently Married Comparison
Sri Lankans
Vietnamese
47.3%
CURRENTLY MARRIED
83.2/ 100
METRIC RATING
129th/ 347
METRIC RANK
44.0%
CURRENTLY MARRIED
0.2/ 100
METRIC RATING
254th/ 347
METRIC RANK
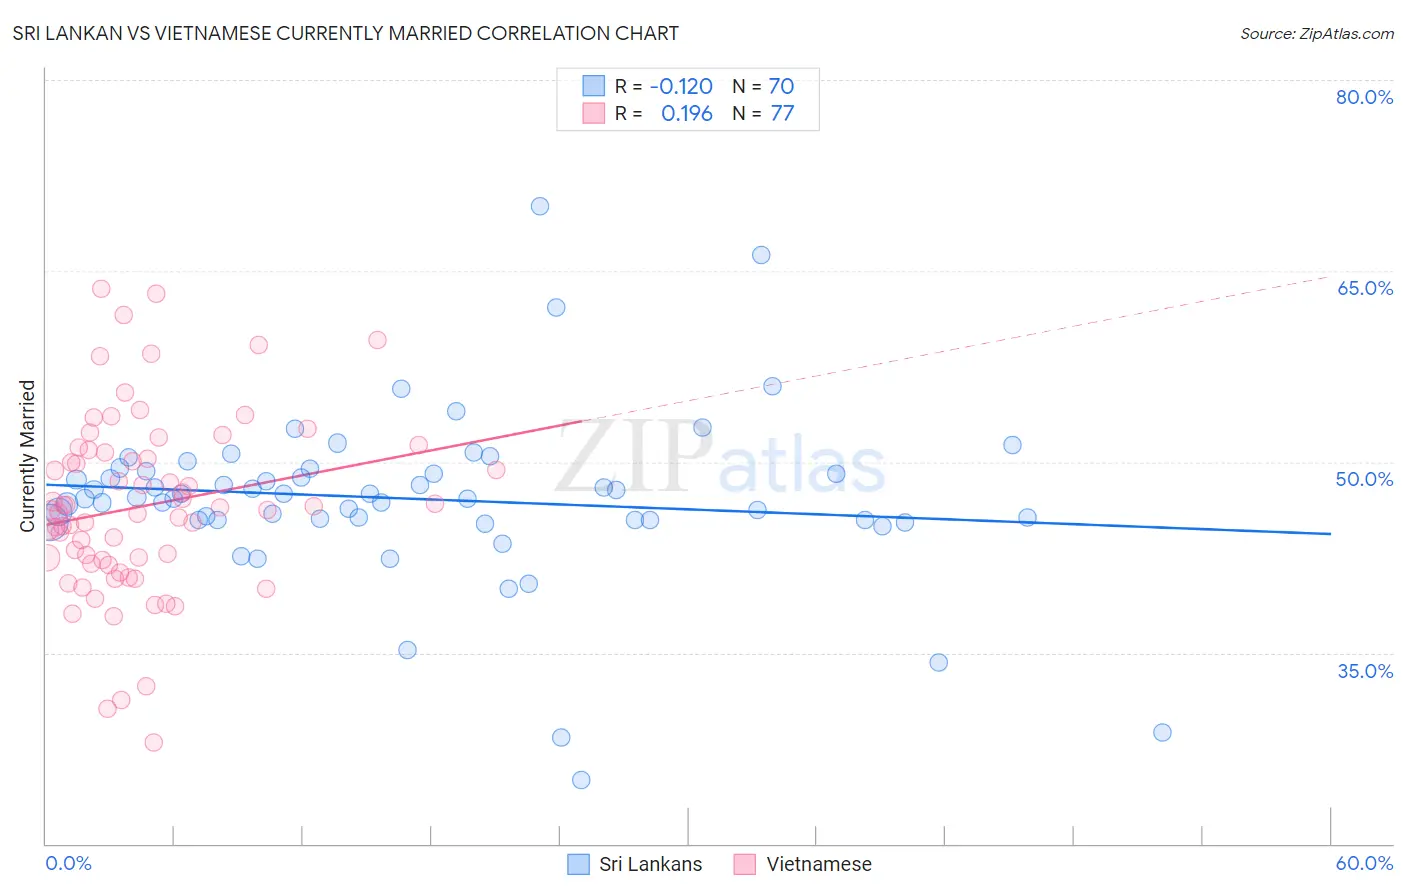
Sri Lankan vs Vietnamese Currently Married Correlation Chart
The statistical analysis conducted on geographies consisting of 440,506,479 people shows a poor negative correlation between the proportion of Sri Lankans and percentage of population currently married in the United States with a correlation coefficient (R) of -0.120 and weighted average of 47.3%. Similarly, the statistical analysis conducted on geographies consisting of 170,739,773 people shows a poor positive correlation between the proportion of Vietnamese and percentage of population currently married in the United States with a correlation coefficient (R) of 0.196 and weighted average of 44.0%, a difference of 7.5%.
Currently Married Correlation Summary
| Measurement | Sri Lankan | Vietnamese |
| Minimum | 25.0% | 27.9% |
| Maximum | 70.1% | 63.6% |
| Range | 45.1% | 35.7% |
| Mean | 47.1% | 46.5% |
| Median | 47.2% | 46.3% |
| Interquartile 25% (IQ1) | 45.4% | 42.1% |
| Interquartile 75% (IQ3) | 49.2% | 50.8% |
| Interquartile Range (IQR) | 3.8% | 8.7% |
| Standard Deviation (Sample) | 6.8% | 7.1% |
| Standard Deviation (Population) | 6.8% | 7.0% |
Similar Demographics by Currently Married
Demographics Similar to Sri Lankans by Currently Married
In terms of currently married, the demographic groups most similar to Sri Lankans are Immigrants from Iraq (47.3%, a difference of 0.030%), Icelander (47.3%, a difference of 0.050%), Portuguese (47.3%, a difference of 0.060%), Afghan (47.3%, a difference of 0.090%), and Immigrants from Jordan (47.4%, a difference of 0.11%).
| Demographics | Rating | Rank | Currently Married |
| Osage | 87.9 /100 | #122 | Excellent 47.5% |
| Immigrants | Kazakhstan | 87.2 /100 | #123 | Excellent 47.4% |
| Laotians | 86.6 /100 | #124 | Excellent 47.4% |
| Okinawans | 85.3 /100 | #125 | Excellent 47.4% |
| Immigrants | Jordan | 84.9 /100 | #126 | Excellent 47.4% |
| New Zealanders | 84.9 /100 | #127 | Excellent 47.4% |
| Portuguese | 84.2 /100 | #128 | Excellent 47.3% |
| Sri Lankans | 83.2 /100 | #129 | Excellent 47.3% |
| Immigrants | Iraq | 82.8 /100 | #130 | Excellent 47.3% |
| Icelanders | 82.4 /100 | #131 | Excellent 47.3% |
| Afghans | 81.8 /100 | #132 | Excellent 47.3% |
| Immigrants | Malaysia | 81.1 /100 | #133 | Excellent 47.3% |
| Immigrants | Australia | 81.1 /100 | #134 | Excellent 47.3% |
| Immigrants | Norway | 79.7 /100 | #135 | Good 47.2% |
| Immigrants | Vietnam | 78.2 /100 | #136 | Good 47.2% |
Demographics Similar to Vietnamese by Currently Married
In terms of currently married, the demographic groups most similar to Vietnamese are Yakama (44.0%, a difference of 0.070%), Shoshone (44.0%, a difference of 0.12%), Immigrants from Central America (44.1%, a difference of 0.24%), Hispanic or Latino (44.1%, a difference of 0.28%), and Blackfeet (44.2%, a difference of 0.30%).
| Demographics | Rating | Rank | Currently Married |
| Ugandans | 0.4 /100 | #247 | Tragic 44.2% |
| Nicaraguans | 0.3 /100 | #248 | Tragic 44.2% |
| Immigrants | Cameroon | 0.3 /100 | #249 | Tragic 44.2% |
| Immigrants | Eastern Africa | 0.3 /100 | #250 | Tragic 44.2% |
| Blackfeet | 0.3 /100 | #251 | Tragic 44.2% |
| Hispanics or Latinos | 0.3 /100 | #252 | Tragic 44.1% |
| Immigrants | Central America | 0.3 /100 | #253 | Tragic 44.1% |
| Vietnamese | 0.2 /100 | #254 | Tragic 44.0% |
| Yakama | 0.2 /100 | #255 | Tragic 44.0% |
| Shoshone | 0.2 /100 | #256 | Tragic 44.0% |
| Immigrants | Africa | 0.2 /100 | #257 | Tragic 43.9% |
| Ute | 0.2 /100 | #258 | Tragic 43.9% |
| Immigrants | Sierra Leone | 0.1 /100 | #259 | Tragic 43.8% |
| Immigrants | Latin America | 0.1 /100 | #260 | Tragic 43.8% |
| Immigrants | Nicaragua | 0.1 /100 | #261 | Tragic 43.7% |