Nepalese vs Vietnamese Currently Married
COMPARE
Nepalese
Vietnamese
Currently Married
Currently Married Comparison
Nepalese
Vietnamese
44.7%
CURRENTLY MARRIED
1.2/ 100
METRIC RATING
232nd/ 347
METRIC RANK
44.0%
CURRENTLY MARRIED
0.2/ 100
METRIC RATING
254th/ 347
METRIC RANK
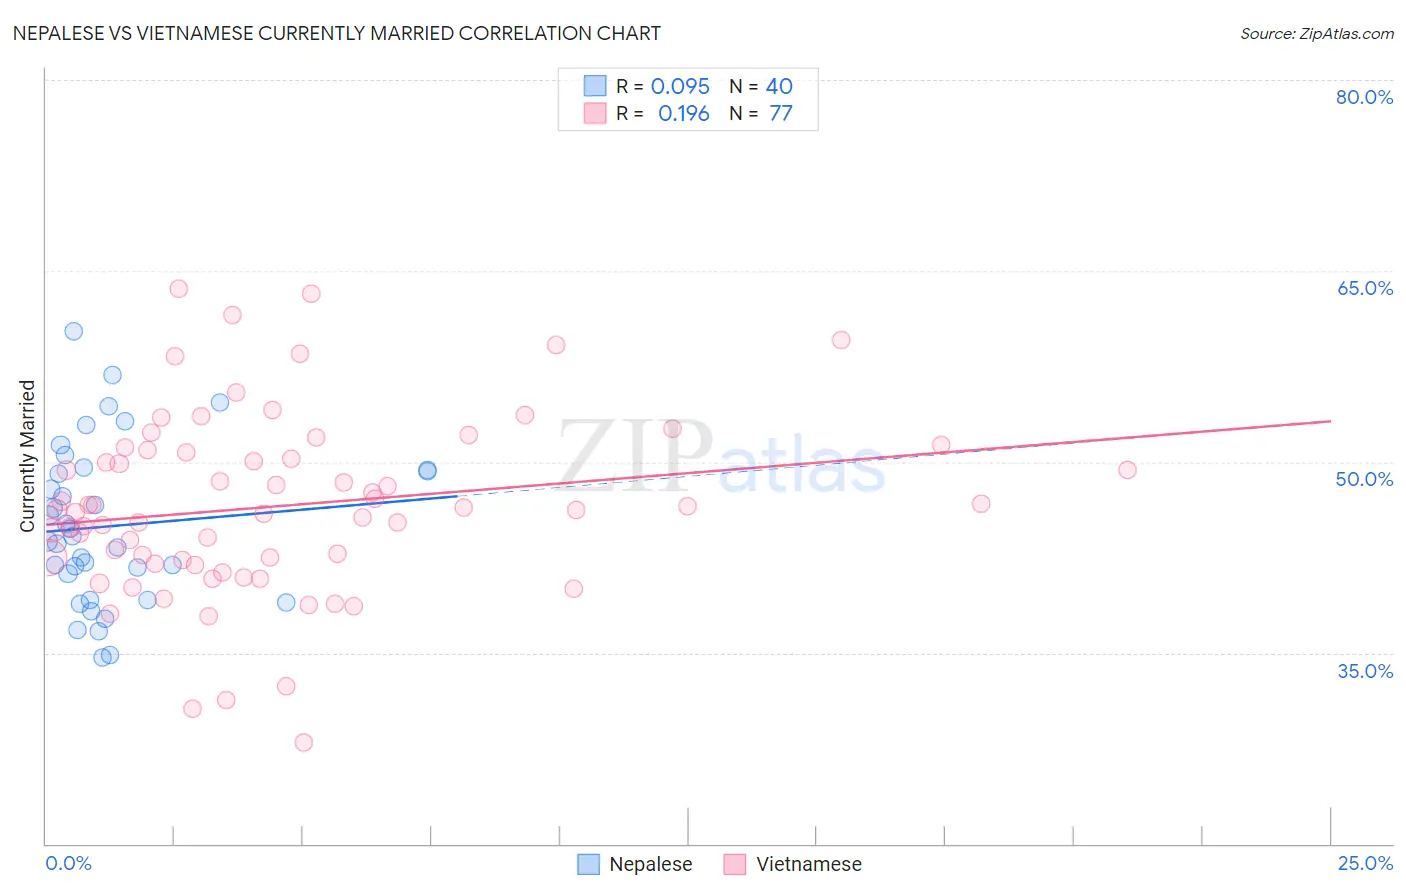
Nepalese vs Vietnamese Currently Married Correlation Chart
The statistical analysis conducted on geographies consisting of 24,521,755 people shows a slight positive correlation between the proportion of Nepalese and percentage of population currently married in the United States with a correlation coefficient (R) of 0.095 and weighted average of 44.7%. Similarly, the statistical analysis conducted on geographies consisting of 170,739,773 people shows a poor positive correlation between the proportion of Vietnamese and percentage of population currently married in the United States with a correlation coefficient (R) of 0.196 and weighted average of 44.0%, a difference of 1.6%.
Currently Married Correlation Summary
| Measurement | Nepalese | Vietnamese |
| Minimum | 34.6% | 27.9% |
| Maximum | 60.3% | 63.6% |
| Range | 25.7% | 35.7% |
| Mean | 45.0% | 46.5% |
| Median | 44.0% | 46.3% |
| Interquartile 25% (IQ1) | 40.2% | 42.1% |
| Interquartile 75% (IQ3) | 49.3% | 50.8% |
| Interquartile Range (IQR) | 9.2% | 8.7% |
| Standard Deviation (Sample) | 6.2% | 7.1% |
| Standard Deviation (Population) | 6.2% | 7.0% |
Similar Demographics by Currently Married
Demographics Similar to Nepalese by Currently Married
In terms of currently married, the demographic groups most similar to Nepalese are Immigrants from Saudi Arabia (44.7%, a difference of 0.050%), Iroquois (44.7%, a difference of 0.060%), Alaskan Athabascan (44.6%, a difference of 0.21%), Cuban (44.6%, a difference of 0.22%), and Seminole (44.6%, a difference of 0.23%).
| Demographics | Rating | Rank | Currently Married |
| French American Indians | 2.2 /100 | #225 | Tragic 45.0% |
| Comanche | 2.1 /100 | #226 | Tragic 45.0% |
| Spanish Americans | 2.1 /100 | #227 | Tragic 45.0% |
| Immigrants | Uruguay | 2.0 /100 | #228 | Tragic 45.0% |
| Cree | 1.7 /100 | #229 | Tragic 44.9% |
| Immigrants | Kenya | 1.6 /100 | #230 | Tragic 44.9% |
| Immigrants | Panama | 1.5 /100 | #231 | Tragic 44.9% |
| Nepalese | 1.2 /100 | #232 | Tragic 44.7% |
| Immigrants | Saudi Arabia | 1.1 /100 | #233 | Tragic 44.7% |
| Iroquois | 1.1 /100 | #234 | Tragic 44.7% |
| Alaskan Athabascans | 0.9 /100 | #235 | Tragic 44.6% |
| Cubans | 0.9 /100 | #236 | Tragic 44.6% |
| Seminole | 0.9 /100 | #237 | Tragic 44.6% |
| Moroccans | 0.9 /100 | #238 | Tragic 44.6% |
| Immigrants | Mexico | 0.7 /100 | #239 | Tragic 44.5% |
Demographics Similar to Vietnamese by Currently Married
In terms of currently married, the demographic groups most similar to Vietnamese are Yakama (44.0%, a difference of 0.070%), Shoshone (44.0%, a difference of 0.12%), Immigrants from Central America (44.1%, a difference of 0.24%), Hispanic or Latino (44.1%, a difference of 0.28%), and Blackfeet (44.2%, a difference of 0.30%).
| Demographics | Rating | Rank | Currently Married |
| Ugandans | 0.4 /100 | #247 | Tragic 44.2% |
| Nicaraguans | 0.3 /100 | #248 | Tragic 44.2% |
| Immigrants | Cameroon | 0.3 /100 | #249 | Tragic 44.2% |
| Immigrants | Eastern Africa | 0.3 /100 | #250 | Tragic 44.2% |
| Blackfeet | 0.3 /100 | #251 | Tragic 44.2% |
| Hispanics or Latinos | 0.3 /100 | #252 | Tragic 44.1% |
| Immigrants | Central America | 0.3 /100 | #253 | Tragic 44.1% |
| Vietnamese | 0.2 /100 | #254 | Tragic 44.0% |
| Yakama | 0.2 /100 | #255 | Tragic 44.0% |
| Shoshone | 0.2 /100 | #256 | Tragic 44.0% |
| Immigrants | Africa | 0.2 /100 | #257 | Tragic 43.9% |
| Ute | 0.2 /100 | #258 | Tragic 43.9% |
| Immigrants | Sierra Leone | 0.1 /100 | #259 | Tragic 43.8% |
| Immigrants | Latin America | 0.1 /100 | #260 | Tragic 43.8% |
| Immigrants | Nicaragua | 0.1 /100 | #261 | Tragic 43.7% |