Spanish American Indian vs Honduran Single Father Households
COMPARE
Spanish American Indian
Honduran
Single Father Households
Single Father Households Comparison
Spanish American Indians
Hondurans
2.9%
SINGLE FATHER HOUSEHOLDS
0.0/ 100
METRIC RATING
311th/ 347
METRIC RANK
2.8%
SINGLE FATHER HOUSEHOLDS
0.0/ 100
METRIC RATING
297th/ 347
METRIC RANK
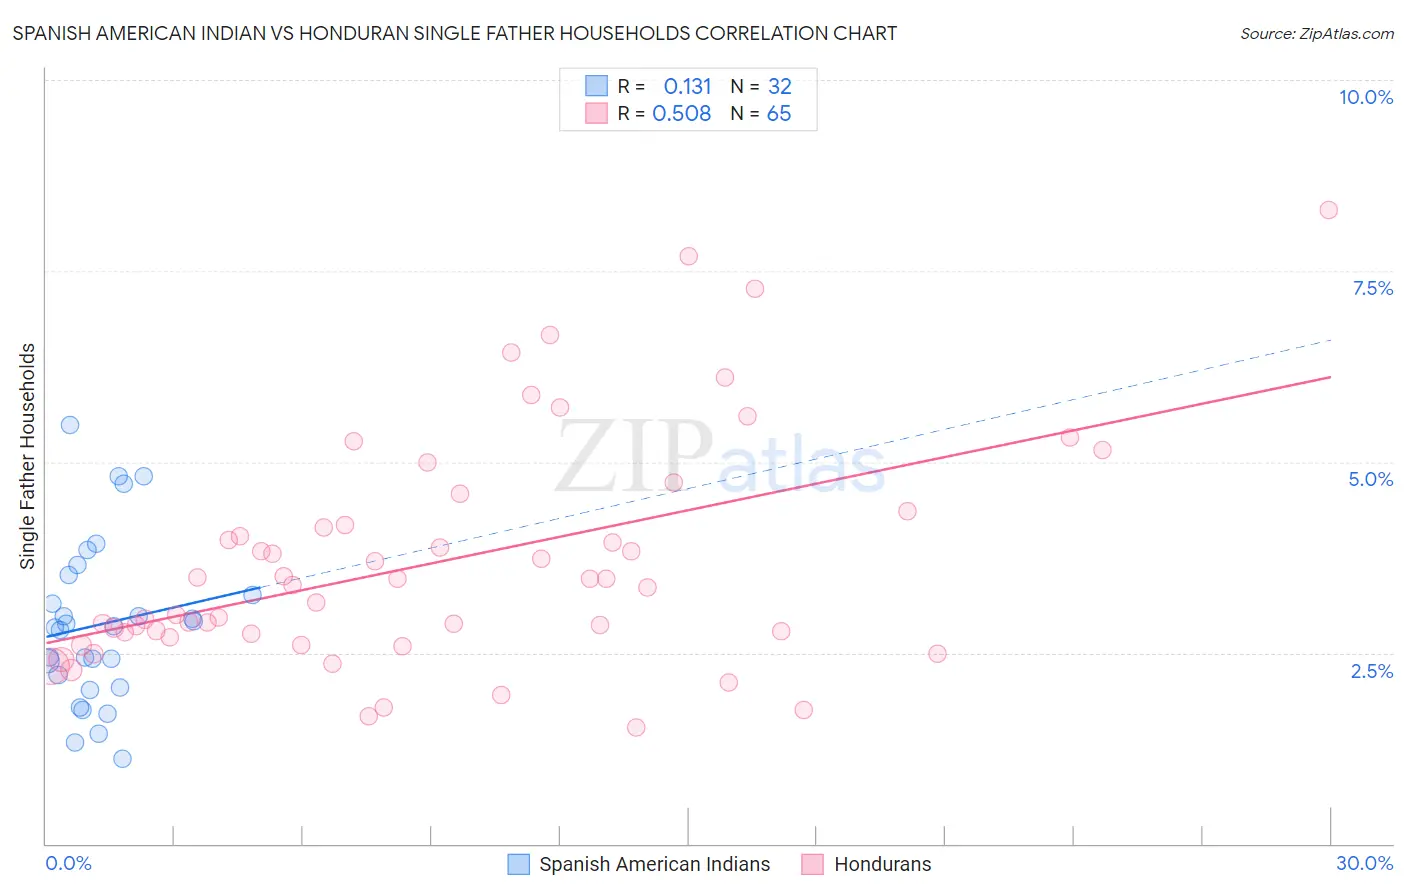
Spanish American Indian vs Honduran Single Father Households Correlation Chart
The statistical analysis conducted on geographies consisting of 73,114,798 people shows a poor positive correlation between the proportion of Spanish American Indians and percentage of single father households in the United States with a correlation coefficient (R) of 0.131 and weighted average of 2.9%. Similarly, the statistical analysis conducted on geographies consisting of 355,602,571 people shows a substantial positive correlation between the proportion of Hondurans and percentage of single father households in the United States with a correlation coefficient (R) of 0.508 and weighted average of 2.8%, a difference of 4.3%.
Single Father Households Correlation Summary
| Measurement | Spanish American Indian | Honduran |
| Minimum | 1.1% | 1.5% |
| Maximum | 5.5% | 8.3% |
| Range | 4.4% | 6.8% |
| Mean | 2.9% | 3.7% |
| Median | 2.8% | 3.4% |
| Interquartile 25% (IQ1) | 2.1% | 2.7% |
| Interquartile 75% (IQ3) | 3.4% | 4.3% |
| Interquartile Range (IQR) | 1.3% | 1.5% |
| Standard Deviation (Sample) | 1.1% | 1.5% |
| Standard Deviation (Population) | 1.0% | 1.5% |
Demographics Similar to Spanish American Indians and Hondurans by Single Father Households
In terms of single father households, the demographic groups most similar to Spanish American Indians are Immigrants from Laos (2.9%, a difference of 0.48%), Tsimshian (2.9%, a difference of 0.57%), Central American (2.9%, a difference of 0.69%), Arapaho (2.9%, a difference of 0.99%), and Salvadoran (2.9%, a difference of 1.2%). Similarly, the demographic groups most similar to Hondurans are Japanese (2.8%, a difference of 0.080%), Chickasaw (2.8%, a difference of 0.10%), Cree (2.8%, a difference of 0.49%), Lumbee (2.8%, a difference of 0.87%), and Malaysian (2.7%, a difference of 0.91%).
| Demographics | Rating | Rank | Single Father Households |
| Malaysians | 0.0 /100 | #294 | Tragic 2.7% |
| Chickasaw | 0.0 /100 | #295 | Tragic 2.8% |
| Japanese | 0.0 /100 | #296 | Tragic 2.8% |
| Hondurans | 0.0 /100 | #297 | Tragic 2.8% |
| Cree | 0.0 /100 | #298 | Tragic 2.8% |
| Lumbee | 0.0 /100 | #299 | Tragic 2.8% |
| Kiowa | 0.0 /100 | #300 | Tragic 2.8% |
| Immigrants | Latin America | 0.0 /100 | #301 | Tragic 2.8% |
| Spanish Americans | 0.0 /100 | #302 | Tragic 2.8% |
| Immigrants | Honduras | 0.0 /100 | #303 | Tragic 2.8% |
| Mexican American Indians | 0.0 /100 | #304 | Tragic 2.8% |
| Hispanics or Latinos | 0.0 /100 | #305 | Tragic 2.8% |
| Immigrants | Azores | 0.0 /100 | #306 | Tragic 2.8% |
| Hopi | 0.0 /100 | #307 | Tragic 2.8% |
| Apache | 0.0 /100 | #308 | Tragic 2.8% |
| Central Americans | 0.0 /100 | #309 | Tragic 2.9% |
| Immigrants | Laos | 0.0 /100 | #310 | Tragic 2.9% |
| Spanish American Indians | 0.0 /100 | #311 | Tragic 2.9% |
| Tsimshian | 0.0 /100 | #312 | Tragic 2.9% |
| Arapaho | 0.0 /100 | #313 | Tragic 2.9% |
| Salvadorans | 0.0 /100 | #314 | Tragic 2.9% |