Alaska Native vs Honduran Single Father Households
COMPARE
Alaska Native
Honduran
Single Father Households
Single Father Households Comparison
Alaska Natives
Hondurans
3.5%
SINGLE FATHER HOUSEHOLDS
0.0/ 100
METRIC RATING
340th/ 347
METRIC RANK
2.8%
SINGLE FATHER HOUSEHOLDS
0.0/ 100
METRIC RATING
297th/ 347
METRIC RANK
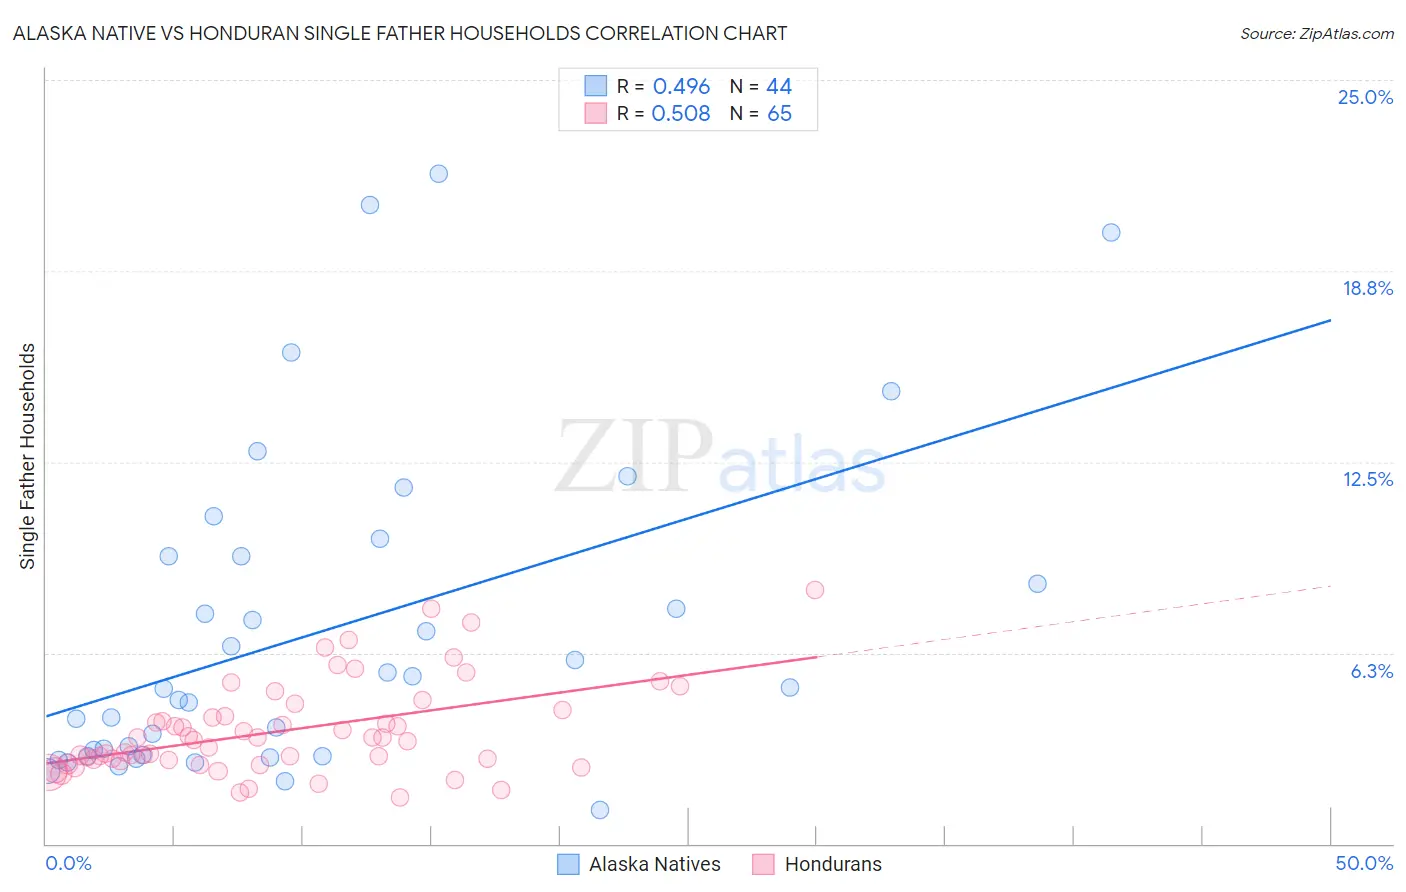
Alaska Native vs Honduran Single Father Households Correlation Chart
The statistical analysis conducted on geographies consisting of 76,608,440 people shows a moderate positive correlation between the proportion of Alaska Natives and percentage of single father households in the United States with a correlation coefficient (R) of 0.496 and weighted average of 3.5%. Similarly, the statistical analysis conducted on geographies consisting of 355,602,571 people shows a substantial positive correlation between the proportion of Hondurans and percentage of single father households in the United States with a correlation coefficient (R) of 0.508 and weighted average of 2.8%, a difference of 27.1%.
Single Father Households Correlation Summary
| Measurement | Alaska Native | Honduran |
| Minimum | 1.1% | 1.5% |
| Maximum | 21.9% | 8.3% |
| Range | 20.8% | 6.8% |
| Mean | 7.0% | 3.7% |
| Median | 5.1% | 3.4% |
| Interquartile 25% (IQ1) | 2.9% | 2.7% |
| Interquartile 75% (IQ3) | 9.4% | 4.3% |
| Interquartile Range (IQR) | 6.5% | 1.5% |
| Standard Deviation (Sample) | 5.3% | 1.5% |
| Standard Deviation (Population) | 5.2% | 1.5% |
Similar Demographics by Single Father Households
Demographics Similar to Alaska Natives by Single Father Households
In terms of single father households, the demographic groups most similar to Alaska Natives are Crow (3.5%, a difference of 0.35%), Alaskan Athabascan (3.4%, a difference of 3.8%), Sioux (3.3%, a difference of 5.3%), Pueblo (3.3%, a difference of 6.0%), and Paiute (3.3%, a difference of 6.2%).
| Demographics | Rating | Rank | Single Father Households |
| Natives/Alaskans | 0.0 /100 | #333 | Tragic 3.2% |
| Yuman | 0.0 /100 | #334 | Tragic 3.3% |
| Colville | 0.0 /100 | #335 | Tragic 3.3% |
| Paiute | 0.0 /100 | #336 | Tragic 3.3% |
| Pueblo | 0.0 /100 | #337 | Tragic 3.3% |
| Sioux | 0.0 /100 | #338 | Tragic 3.3% |
| Alaskan Athabascans | 0.0 /100 | #339 | Tragic 3.4% |
| Alaska Natives | 0.0 /100 | #340 | Tragic 3.5% |
| Crow | 0.0 /100 | #341 | Tragic 3.5% |
| Tohono O'odham | 0.0 /100 | #342 | Tragic 3.8% |
| Pima | 0.0 /100 | #343 | Tragic 4.2% |
| Yakama | 0.0 /100 | #344 | Tragic 4.2% |
| Menominee | 0.0 /100 | #345 | Tragic 4.2% |
| Inupiat | 0.0 /100 | #346 | Tragic 4.9% |
| Yup'ik | 0.0 /100 | #347 | Tragic 5.4% |
Demographics Similar to Hondurans by Single Father Households
In terms of single father households, the demographic groups most similar to Hondurans are Japanese (2.8%, a difference of 0.080%), Chickasaw (2.8%, a difference of 0.10%), Cree (2.8%, a difference of 0.49%), Lumbee (2.8%, a difference of 0.87%), and Malaysian (2.7%, a difference of 0.91%).
| Demographics | Rating | Rank | Single Father Households |
| Puget Sound Salish | 0.0 /100 | #290 | Tragic 2.7% |
| Blackfeet | 0.0 /100 | #291 | Tragic 2.7% |
| Choctaw | 0.0 /100 | #292 | Tragic 2.7% |
| Immigrants | Fiji | 0.0 /100 | #293 | Tragic 2.7% |
| Malaysians | 0.0 /100 | #294 | Tragic 2.7% |
| Chickasaw | 0.0 /100 | #295 | Tragic 2.8% |
| Japanese | 0.0 /100 | #296 | Tragic 2.8% |
| Hondurans | 0.0 /100 | #297 | Tragic 2.8% |
| Cree | 0.0 /100 | #298 | Tragic 2.8% |
| Lumbee | 0.0 /100 | #299 | Tragic 2.8% |
| Kiowa | 0.0 /100 | #300 | Tragic 2.8% |
| Immigrants | Latin America | 0.0 /100 | #301 | Tragic 2.8% |
| Spanish Americans | 0.0 /100 | #302 | Tragic 2.8% |
| Immigrants | Honduras | 0.0 /100 | #303 | Tragic 2.8% |
| Mexican American Indians | 0.0 /100 | #304 | Tragic 2.8% |