Soviet Union vs British Family Households with Children
COMPARE
Soviet Union
British
Family Households with Children
Family Households with Children Comparison
Soviet Union
British
24.8%
FAMILY HOUSEHOLDS WITH CHILDREN
0.0/ 100
METRIC RATING
347th/ 347
METRIC RANK
27.4%
FAMILY HOUSEHOLDS WITH CHILDREN
49.9/ 100
METRIC RATING
175th/ 347
METRIC RANK
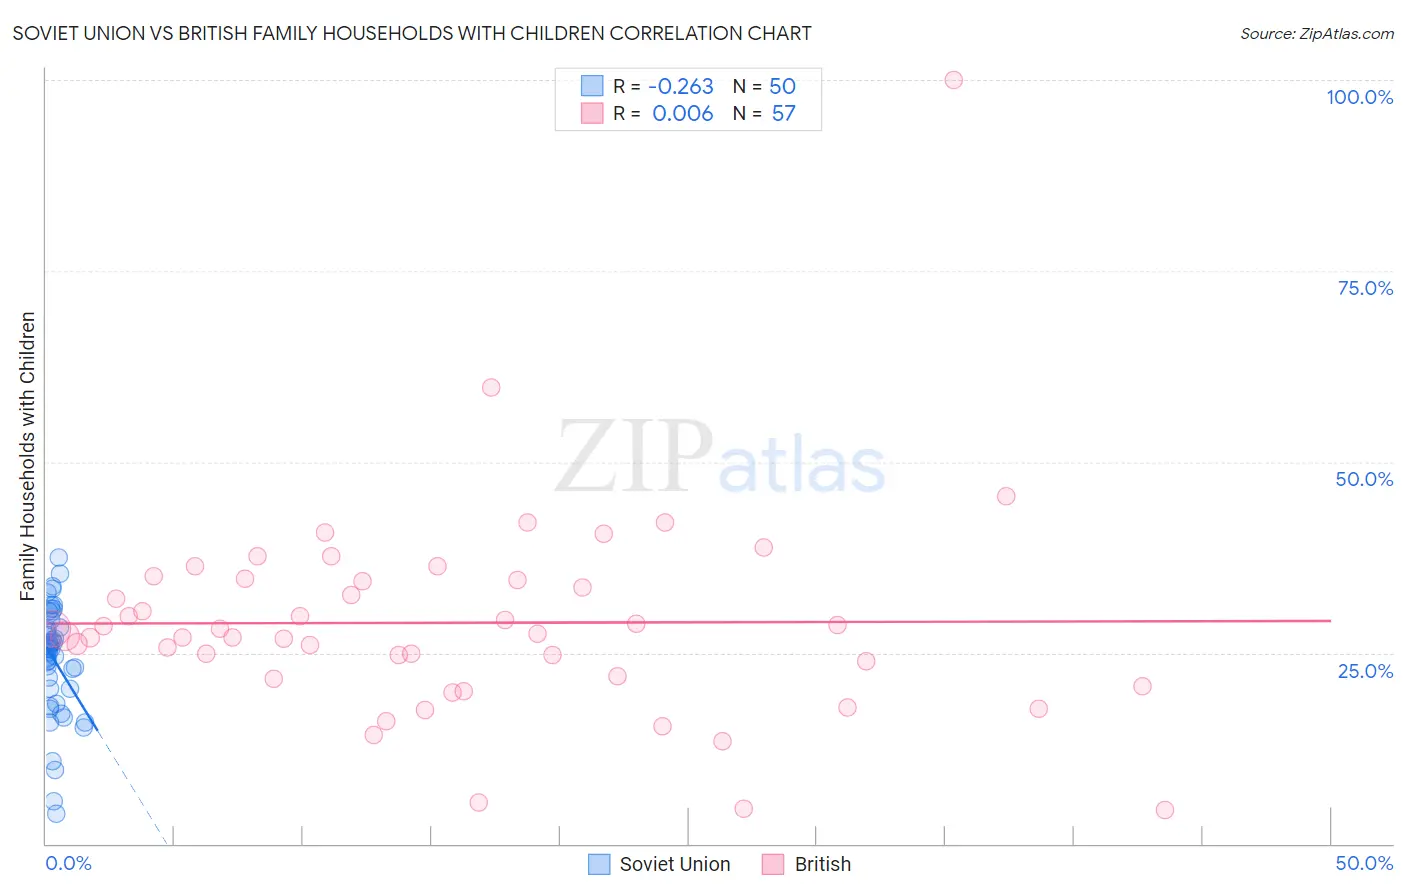
Soviet Union vs British Family Households with Children Correlation Chart
The statistical analysis conducted on geographies consisting of 43,507,207 people shows a weak negative correlation between the proportion of Soviet Union and percentage of family households with children in the United States with a correlation coefficient (R) of -0.263 and weighted average of 24.8%. Similarly, the statistical analysis conducted on geographies consisting of 530,729,097 people shows no correlation between the proportion of British and percentage of family households with children in the United States with a correlation coefficient (R) of 0.006 and weighted average of 27.4%, a difference of 10.5%.
Family Households with Children Correlation Summary
| Measurement | Soviet Union | British |
| Minimum | 3.9% | 4.4% |
| Maximum | 37.4% | 100.0% |
| Range | 33.6% | 95.6% |
| Mean | 24.0% | 28.9% |
| Median | 25.6% | 27.6% |
| Interquartile 25% (IQ1) | 20.2% | 21.8% |
| Interquartile 75% (IQ3) | 28.3% | 34.6% |
| Interquartile Range (IQR) | 8.1% | 12.8% |
| Standard Deviation (Sample) | 7.2% | 13.9% |
| Standard Deviation (Population) | 7.2% | 13.8% |
Similar Demographics by Family Households with Children
Demographics Similar to Soviet Union by Family Households with Children
In terms of family households with children, the demographic groups most similar to Soviet Union are Immigrants from Grenada (25.2%, a difference of 1.3%), Carpatho Rusyn (25.2%, a difference of 1.3%), Pueblo (25.2%, a difference of 1.5%), Hopi (25.2%, a difference of 1.6%), and Alsatian (25.3%, a difference of 1.8%).
| Demographics | Rating | Rank | Family Households with Children |
| Immigrants | Switzerland | 0.0 /100 | #333 | Tragic 25.7% |
| Slovaks | 0.0 /100 | #334 | Tragic 25.7% |
| Immigrants | Croatia | 0.0 /100 | #335 | Tragic 25.7% |
| Immigrants | West Indies | 0.0 /100 | #336 | Tragic 25.7% |
| Puerto Ricans | 0.0 /100 | #337 | Tragic 25.6% |
| Arapaho | 0.0 /100 | #338 | Tragic 25.6% |
| Immigrants | St. Vincent and the Grenadines | 0.0 /100 | #339 | Tragic 25.6% |
| Immigrants | Armenia | 0.0 /100 | #340 | Tragic 25.6% |
| Immigrants | Serbia | 0.0 /100 | #341 | Tragic 25.5% |
| Alsatians | 0.0 /100 | #342 | Tragic 25.3% |
| Hopi | 0.0 /100 | #343 | Tragic 25.2% |
| Pueblo | 0.0 /100 | #344 | Tragic 25.2% |
| Immigrants | Grenada | 0.0 /100 | #345 | Tragic 25.2% |
| Carpatho Rusyns | 0.0 /100 | #346 | Tragic 25.2% |
| Soviet Union | 0.0 /100 | #347 | Tragic 24.8% |
Demographics Similar to British by Family Households with Children
In terms of family households with children, the demographic groups most similar to British are White/Caucasian (27.4%, a difference of 0.0%), Immigrants from China (27.4%, a difference of 0.010%), Ugandan (27.4%, a difference of 0.020%), Spanish American (27.4%, a difference of 0.020%), and Immigrants from Argentina (27.5%, a difference of 0.050%).
| Demographics | Rating | Rank | Family Households with Children |
| Immigrants | Kuwait | 60.9 /100 | #168 | Good 27.5% |
| Seminole | 56.9 /100 | #169 | Average 27.5% |
| Cherokee | 56.7 /100 | #170 | Average 27.5% |
| Blackfeet | 54.3 /100 | #171 | Average 27.5% |
| Israelis | 53.9 /100 | #172 | Average 27.5% |
| Immigrants | Argentina | 52.2 /100 | #173 | Average 27.5% |
| Whites/Caucasians | 50.0 /100 | #174 | Average 27.4% |
| British | 49.9 /100 | #175 | Average 27.4% |
| Immigrants | China | 49.6 /100 | #176 | Average 27.4% |
| Ugandans | 49.2 /100 | #177 | Average 27.4% |
| Spanish Americans | 48.9 /100 | #178 | Average 27.4% |
| Turks | 46.9 /100 | #179 | Average 27.4% |
| Immigrants | Turkey | 46.9 /100 | #180 | Average 27.4% |
| Aleuts | 46.7 /100 | #181 | Average 27.4% |
| Puget Sound Salish | 46.2 /100 | #182 | Average 27.4% |