Crow vs British Family Households with Children
COMPARE
Crow
British
Family Households with Children
Family Households with Children Comparison
Crow
British
27.4%
FAMILY HOUSEHOLDS WITH CHILDREN
35.7/ 100
METRIC RATING
195th/ 347
METRIC RANK
27.4%
FAMILY HOUSEHOLDS WITH CHILDREN
49.9/ 100
METRIC RATING
175th/ 347
METRIC RANK
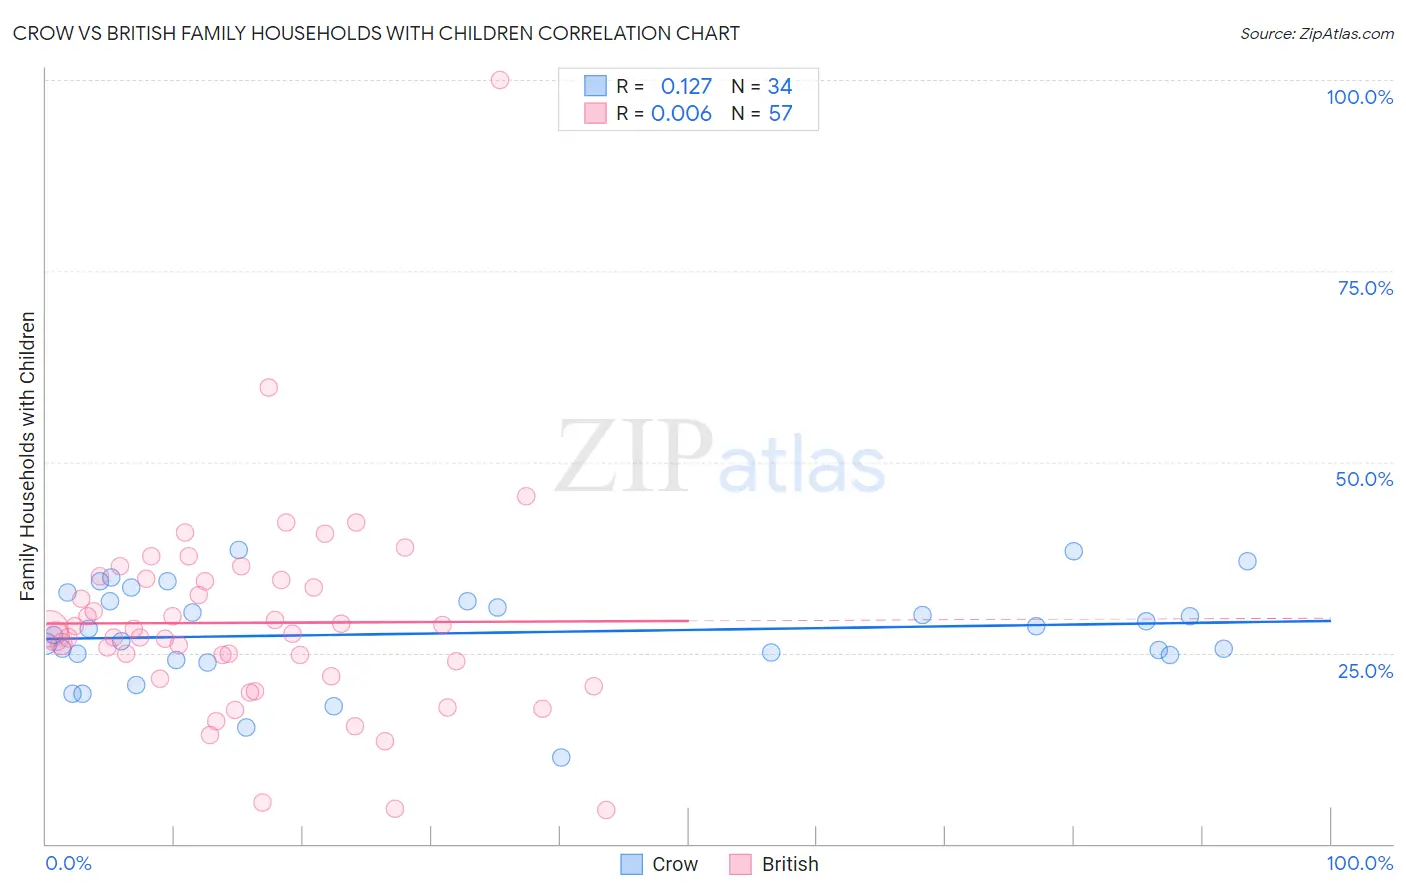
Crow vs British Family Households with Children Correlation Chart
The statistical analysis conducted on geographies consisting of 59,201,015 people shows a poor positive correlation between the proportion of Crow and percentage of family households with children in the United States with a correlation coefficient (R) of 0.127 and weighted average of 27.4%. Similarly, the statistical analysis conducted on geographies consisting of 530,729,097 people shows no correlation between the proportion of British and percentage of family households with children in the United States with a correlation coefficient (R) of 0.006 and weighted average of 27.4%, a difference of 0.32%.
Family Households with Children Correlation Summary
| Measurement | Crow | British |
| Minimum | 11.3% | 4.4% |
| Maximum | 38.5% | 100.0% |
| Range | 27.2% | 95.6% |
| Mean | 27.6% | 28.9% |
| Median | 27.7% | 27.6% |
| Interquartile 25% (IQ1) | 24.7% | 21.8% |
| Interquartile 75% (IQ3) | 31.7% | 34.6% |
| Interquartile Range (IQR) | 7.1% | 12.8% |
| Standard Deviation (Sample) | 6.4% | 13.9% |
| Standard Deviation (Population) | 6.3% | 13.8% |
Demographics Similar to Crow and British by Family Households with Children
In terms of family households with children, the demographic groups most similar to Crow are Immigrants from Iran (27.4%, a difference of 0.010%), Swedish (27.4%, a difference of 0.030%), Sudanese (27.4%, a difference of 0.040%), Pennsylvania German (27.4%, a difference of 0.040%), and Immigrants from Israel (27.4%, a difference of 0.050%). Similarly, the demographic groups most similar to British are Immigrants from China (27.4%, a difference of 0.010%), Ugandan (27.4%, a difference of 0.020%), Spanish American (27.4%, a difference of 0.020%), Turkish (27.4%, a difference of 0.070%), and Immigrants from Turkey (27.4%, a difference of 0.070%).
| Demographics | Rating | Rank | Family Households with Children |
| British | 49.9 /100 | #175 | Average 27.4% |
| Immigrants | China | 49.6 /100 | #176 | Average 27.4% |
| Ugandans | 49.2 /100 | #177 | Average 27.4% |
| Spanish Americans | 48.9 /100 | #178 | Average 27.4% |
| Turks | 46.9 /100 | #179 | Average 27.4% |
| Immigrants | Turkey | 46.9 /100 | #180 | Average 27.4% |
| Aleuts | 46.7 /100 | #181 | Average 27.4% |
| Puget Sound Salish | 46.2 /100 | #182 | Average 27.4% |
| South Africans | 44.9 /100 | #183 | Average 27.4% |
| Native Hawaiians | 44.6 /100 | #184 | Average 27.4% |
| Delaware | 42.0 /100 | #185 | Average 27.4% |
| Immigrants | Brazil | 40.6 /100 | #186 | Average 27.4% |
| Creek | 39.8 /100 | #187 | Fair 27.4% |
| Dutch | 38.8 /100 | #188 | Fair 27.4% |
| Immigrants | Israel | 37.9 /100 | #189 | Fair 27.4% |
| Immigrants | Uruguay | 37.7 /100 | #190 | Fair 27.4% |
| Sudanese | 37.6 /100 | #191 | Fair 27.4% |
| Pennsylvania Germans | 37.5 /100 | #192 | Fair 27.4% |
| Swedes | 36.9 /100 | #193 | Fair 27.4% |
| Immigrants | Iran | 36.1 /100 | #194 | Fair 27.4% |
| Crow | 35.7 /100 | #195 | Fair 27.4% |