South African vs Ugandan Currently Married
COMPARE
South African
Ugandan
Currently Married
Currently Married Comparison
South Africans
Ugandans
47.6%
CURRENTLY MARRIED
90.5/ 100
METRIC RATING
114th/ 347
METRIC RANK
44.2%
CURRENTLY MARRIED
0.4/ 100
METRIC RATING
247th/ 347
METRIC RANK
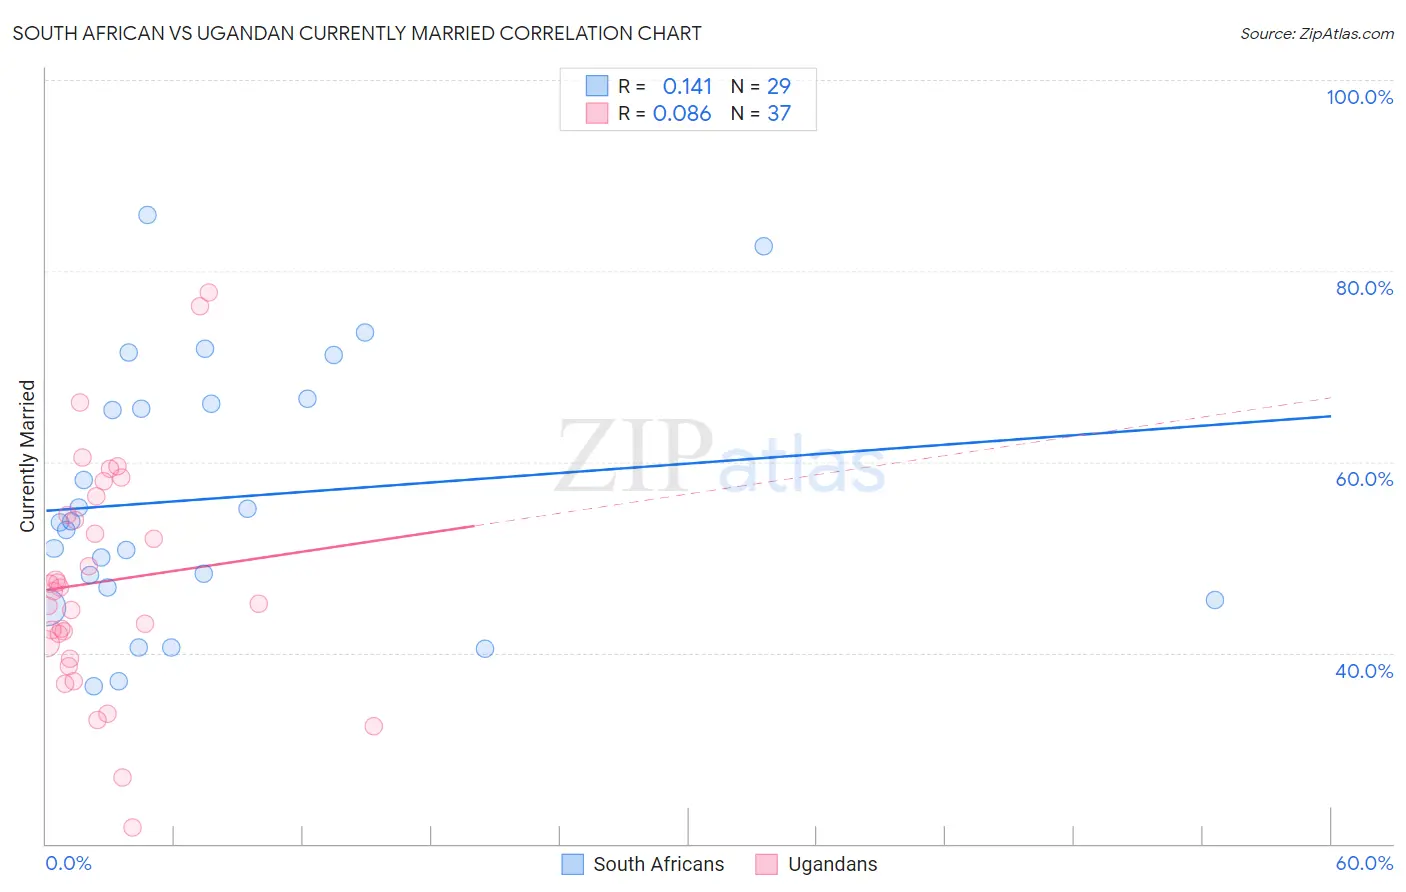
South African vs Ugandan Currently Married Correlation Chart
The statistical analysis conducted on geographies consisting of 182,588,333 people shows a poor positive correlation between the proportion of South Africans and percentage of population currently married in the United States with a correlation coefficient (R) of 0.141 and weighted average of 47.6%. Similarly, the statistical analysis conducted on geographies consisting of 94,016,399 people shows a slight positive correlation between the proportion of Ugandans and percentage of population currently married in the United States with a correlation coefficient (R) of 0.086 and weighted average of 44.2%, a difference of 7.6%.
Currently Married Correlation Summary
| Measurement | South African | Ugandan |
| Minimum | 36.5% | 21.7% |
| Maximum | 85.8% | 77.7% |
| Range | 49.3% | 56.0% |
| Mean | 56.2% | 47.5% |
| Median | 53.7% | 46.4% |
| Interquartile 25% (IQ1) | 46.2% | 40.1% |
| Interquartile 75% (IQ3) | 66.3% | 55.4% |
| Interquartile Range (IQR) | 20.1% | 15.3% |
| Standard Deviation (Sample) | 13.4% | 12.1% |
| Standard Deviation (Population) | 13.2% | 11.9% |
Similar Demographics by Currently Married
Demographics Similar to South Africans by Currently Married
In terms of currently married, the demographic groups most similar to South Africans are Immigrants from Indonesia (47.6%, a difference of 0.0%), Palestinian (47.6%, a difference of 0.010%), Immigrants from Denmark (47.6%, a difference of 0.030%), Puget Sound Salish (47.6%, a difference of 0.030%), and Immigrants from Philippines (47.6%, a difference of 0.030%).
| Demographics | Rating | Rank | Currently Married |
| Immigrants | Italy | 92.9 /100 | #107 | Exceptional 47.7% |
| Tsimshian | 92.4 /100 | #108 | Exceptional 47.7% |
| Immigrants | Egypt | 92.3 /100 | #109 | Exceptional 47.7% |
| Immigrants | Russia | 92.0 /100 | #110 | Exceptional 47.7% |
| Immigrants | Hungary | 91.2 /100 | #111 | Exceptional 47.6% |
| Immigrants | Western Europe | 91.1 /100 | #112 | Exceptional 47.6% |
| Immigrants | Denmark | 90.9 /100 | #113 | Exceptional 47.6% |
| South Africans | 90.5 /100 | #114 | Exceptional 47.6% |
| Immigrants | Indonesia | 90.5 /100 | #115 | Exceptional 47.6% |
| Palestinians | 90.4 /100 | #116 | Exceptional 47.6% |
| Puget Sound Salish | 90.3 /100 | #117 | Exceptional 47.6% |
| Immigrants | Philippines | 90.2 /100 | #118 | Exceptional 47.6% |
| Australians | 90.2 /100 | #119 | Exceptional 47.6% |
| Syrians | 88.9 /100 | #120 | Excellent 47.5% |
| Immigrants | Croatia | 88.6 /100 | #121 | Excellent 47.5% |
Demographics Similar to Ugandans by Currently Married
In terms of currently married, the demographic groups most similar to Ugandans are Nicaraguan (44.2%, a difference of 0.090%), Immigrants from Cameroon (44.2%, a difference of 0.10%), Immigrants from Eastern Africa (44.2%, a difference of 0.12%), Immigrants from Burma/Myanmar (44.3%, a difference of 0.13%), and Blackfeet (44.2%, a difference of 0.19%).
| Demographics | Rating | Rank | Currently Married |
| Mexican American Indians | 0.7 /100 | #240 | Tragic 44.5% |
| Ethiopians | 0.7 /100 | #241 | Tragic 44.5% |
| Immigrants | Cambodia | 0.7 /100 | #242 | Tragic 44.5% |
| Immigrants | Ethiopia | 0.7 /100 | #243 | Tragic 44.5% |
| Japanese | 0.6 /100 | #244 | Tragic 44.5% |
| Immigrants | Armenia | 0.4 /100 | #245 | Tragic 44.3% |
| Immigrants | Burma/Myanmar | 0.4 /100 | #246 | Tragic 44.3% |
| Ugandans | 0.4 /100 | #247 | Tragic 44.2% |
| Nicaraguans | 0.3 /100 | #248 | Tragic 44.2% |
| Immigrants | Cameroon | 0.3 /100 | #249 | Tragic 44.2% |
| Immigrants | Eastern Africa | 0.3 /100 | #250 | Tragic 44.2% |
| Blackfeet | 0.3 /100 | #251 | Tragic 44.2% |
| Hispanics or Latinos | 0.3 /100 | #252 | Tragic 44.1% |
| Immigrants | Central America | 0.3 /100 | #253 | Tragic 44.1% |
| Vietnamese | 0.2 /100 | #254 | Tragic 44.0% |