Lumbee vs Ugandan Currently Married
COMPARE
Lumbee
Ugandan
Currently Married
Currently Married Comparison
Lumbee
Ugandans
39.8%
CURRENTLY MARRIED
0.0/ 100
METRIC RATING
335th/ 347
METRIC RANK
44.2%
CURRENTLY MARRIED
0.4/ 100
METRIC RATING
247th/ 347
METRIC RANK
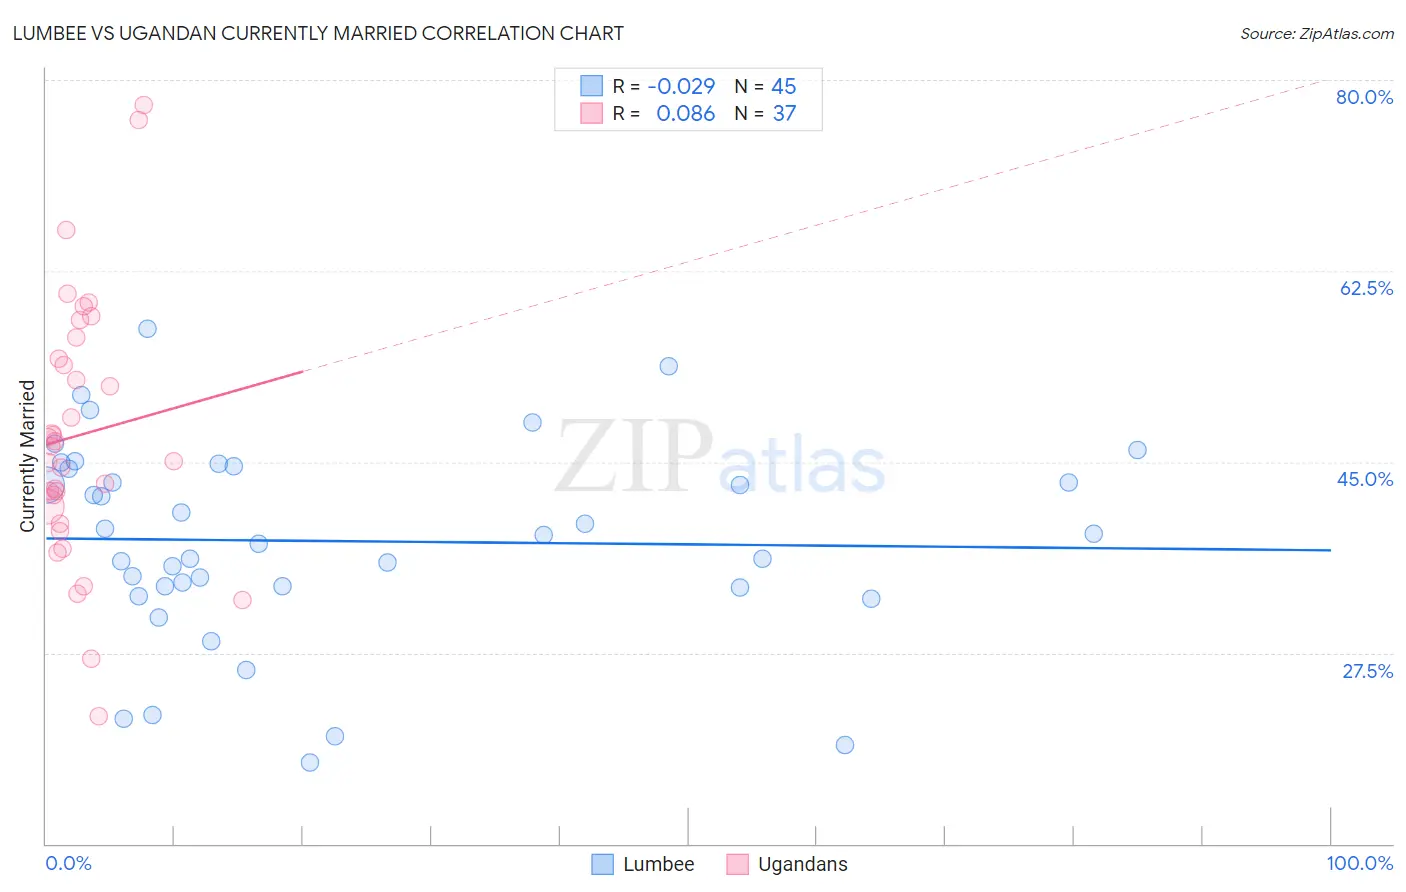
Lumbee vs Ugandan Currently Married Correlation Chart
The statistical analysis conducted on geographies consisting of 92,298,299 people shows no correlation between the proportion of Lumbee and percentage of population currently married in the United States with a correlation coefficient (R) of -0.029 and weighted average of 39.8%. Similarly, the statistical analysis conducted on geographies consisting of 94,016,399 people shows a slight positive correlation between the proportion of Ugandans and percentage of population currently married in the United States with a correlation coefficient (R) of 0.086 and weighted average of 44.2%, a difference of 11.1%.
Currently Married Correlation Summary
| Measurement | Lumbee | Ugandan |
| Minimum | 17.4% | 21.7% |
| Maximum | 57.2% | 77.7% |
| Range | 39.8% | 56.0% |
| Mean | 37.7% | 47.5% |
| Median | 38.3% | 46.4% |
| Interquartile 25% (IQ1) | 33.5% | 40.1% |
| Interquartile 75% (IQ3) | 44.5% | 55.4% |
| Interquartile Range (IQR) | 10.9% | 15.3% |
| Standard Deviation (Sample) | 9.1% | 12.1% |
| Standard Deviation (Population) | 9.0% | 11.9% |
Similar Demographics by Currently Married
Demographics Similar to Lumbee by Currently Married
In terms of currently married, the demographic groups most similar to Lumbee are Puerto Rican (39.9%, a difference of 0.16%), Yup'ik (39.9%, a difference of 0.18%), British West Indian (39.8%, a difference of 0.18%), Black/African American (39.6%, a difference of 0.56%), and Immigrants from St. Vincent and the Grenadines (40.1%, a difference of 0.57%).
| Demographics | Rating | Rank | Currently Married |
| Arapaho | 0.0 /100 | #328 | Tragic 40.5% |
| Crow | 0.0 /100 | #329 | Tragic 40.4% |
| Immigrants | Dominica | 0.0 /100 | #330 | Tragic 40.3% |
| Immigrants | Barbados | 0.0 /100 | #331 | Tragic 40.3% |
| Immigrants | St. Vincent and the Grenadines | 0.0 /100 | #332 | Tragic 40.1% |
| Yup'ik | 0.0 /100 | #333 | Tragic 39.9% |
| Puerto Ricans | 0.0 /100 | #334 | Tragic 39.9% |
| Lumbee | 0.0 /100 | #335 | Tragic 39.8% |
| British West Indians | 0.0 /100 | #336 | Tragic 39.8% |
| Blacks/African Americans | 0.0 /100 | #337 | Tragic 39.6% |
| Cape Verdeans | 0.0 /100 | #338 | Tragic 39.6% |
| Dominicans | 0.0 /100 | #339 | Tragic 39.5% |
| Immigrants | Grenada | 0.0 /100 | #340 | Tragic 39.1% |
| Navajo | 0.0 /100 | #341 | Tragic 39.0% |
| Immigrants | Dominican Republic | 0.0 /100 | #342 | Tragic 38.9% |
Demographics Similar to Ugandans by Currently Married
In terms of currently married, the demographic groups most similar to Ugandans are Nicaraguan (44.2%, a difference of 0.090%), Immigrants from Cameroon (44.2%, a difference of 0.10%), Immigrants from Eastern Africa (44.2%, a difference of 0.12%), Immigrants from Burma/Myanmar (44.3%, a difference of 0.13%), and Blackfeet (44.2%, a difference of 0.19%).
| Demographics | Rating | Rank | Currently Married |
| Mexican American Indians | 0.7 /100 | #240 | Tragic 44.5% |
| Ethiopians | 0.7 /100 | #241 | Tragic 44.5% |
| Immigrants | Cambodia | 0.7 /100 | #242 | Tragic 44.5% |
| Immigrants | Ethiopia | 0.7 /100 | #243 | Tragic 44.5% |
| Japanese | 0.6 /100 | #244 | Tragic 44.5% |
| Immigrants | Armenia | 0.4 /100 | #245 | Tragic 44.3% |
| Immigrants | Burma/Myanmar | 0.4 /100 | #246 | Tragic 44.3% |
| Ugandans | 0.4 /100 | #247 | Tragic 44.2% |
| Nicaraguans | 0.3 /100 | #248 | Tragic 44.2% |
| Immigrants | Cameroon | 0.3 /100 | #249 | Tragic 44.2% |
| Immigrants | Eastern Africa | 0.3 /100 | #250 | Tragic 44.2% |
| Blackfeet | 0.3 /100 | #251 | Tragic 44.2% |
| Hispanics or Latinos | 0.3 /100 | #252 | Tragic 44.1% |
| Immigrants | Central America | 0.3 /100 | #253 | Tragic 44.1% |
| Vietnamese | 0.2 /100 | #254 | Tragic 44.0% |