Somali vs Ottawa Births to Unmarried Women
COMPARE
Somali
Ottawa
Births to Unmarried Women
Births to Unmarried Women Comparison
Somalis
Ottawa
30.7%
BIRTHS TO UNMARRIED WOMEN
77.8/ 100
METRIC RATING
150th/ 347
METRIC RANK
36.5%
BIRTHS TO UNMARRIED WOMEN
0.2/ 100
METRIC RATING
260th/ 347
METRIC RANK
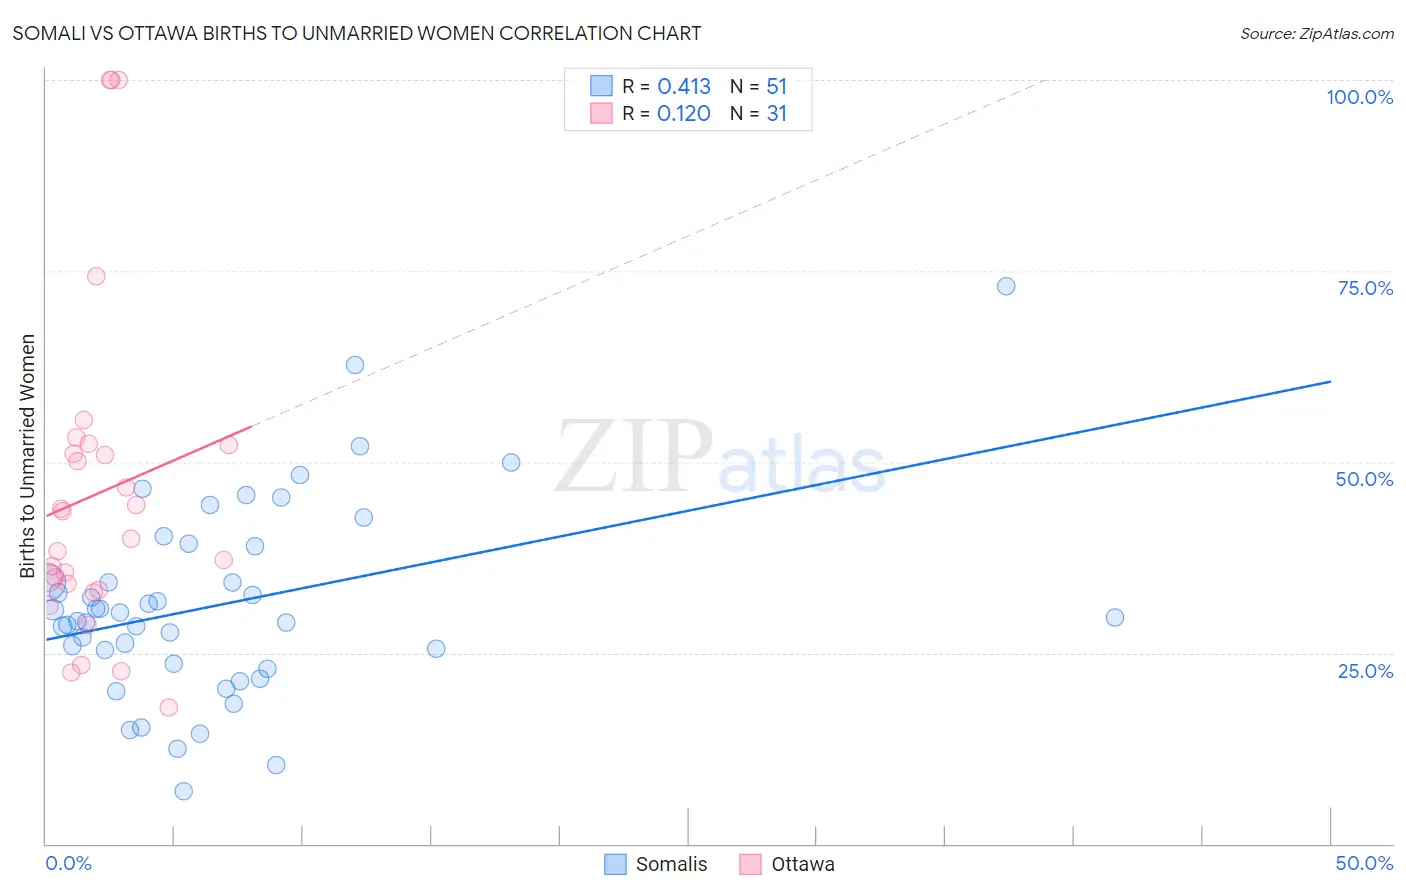
Somali vs Ottawa Births to Unmarried Women Correlation Chart
The statistical analysis conducted on geographies consisting of 97,449,396 people shows a moderate positive correlation between the proportion of Somalis and percentage of births to unmarried women in the United States with a correlation coefficient (R) of 0.413 and weighted average of 30.7%. Similarly, the statistical analysis conducted on geographies consisting of 48,969,239 people shows a poor positive correlation between the proportion of Ottawa and percentage of births to unmarried women in the United States with a correlation coefficient (R) of 0.120 and weighted average of 36.5%, a difference of 18.6%.
Births to Unmarried Women Correlation Summary
| Measurement | Somali | Ottawa |
| Minimum | 6.8% | 17.9% |
| Maximum | 73.0% | 100.0% |
| Range | 66.2% | 82.1% |
| Mean | 31.3% | 45.9% |
| Median | 29.7% | 40.0% |
| Interquartile 25% (IQ1) | 23.6% | 33.3% |
| Interquartile 75% (IQ3) | 39.0% | 52.2% |
| Interquartile Range (IQR) | 15.4% | 18.9% |
| Standard Deviation (Sample) | 12.7% | 21.5% |
| Standard Deviation (Population) | 12.6% | 21.2% |
Similar Demographics by Births to Unmarried Women
Demographics Similar to Somalis by Births to Unmarried Women
In terms of births to unmarried women, the demographic groups most similar to Somalis are Italian (30.8%, a difference of 0.11%), Serbian (30.7%, a difference of 0.14%), Chilean (30.7%, a difference of 0.19%), Polish (30.8%, a difference of 0.22%), and British (30.8%, a difference of 0.24%).
| Demographics | Rating | Rank | Births to Unmarried Women |
| Immigrants | Uganda | 82.6 /100 | #143 | Excellent 30.5% |
| Czechs | 82.1 /100 | #144 | Excellent 30.5% |
| Immigrants | North America | 81.5 /100 | #145 | Excellent 30.6% |
| Northern Europeans | 81.4 /100 | #146 | Excellent 30.6% |
| Immigrants | Oceania | 81.2 /100 | #147 | Excellent 30.6% |
| Chileans | 79.1 /100 | #148 | Good 30.7% |
| Serbians | 78.8 /100 | #149 | Good 30.7% |
| Somalis | 77.8 /100 | #150 | Good 30.7% |
| Italians | 77.0 /100 | #151 | Good 30.8% |
| Poles | 76.2 /100 | #152 | Good 30.8% |
| British | 76.0 /100 | #153 | Good 30.8% |
| Yugoslavians | 75.1 /100 | #154 | Good 30.8% |
| Immigrants | Bangladesh | 73.9 /100 | #155 | Good 30.9% |
| Carpatho Rusyns | 73.5 /100 | #156 | Good 30.9% |
| Immigrants | Eastern Africa | 72.1 /100 | #157 | Good 31.0% |
Demographics Similar to Ottawa by Births to Unmarried Women
In terms of births to unmarried women, the demographic groups most similar to Ottawa are Trinidadian and Tobagonian (36.5%, a difference of 0.0%), Immigrants from El Salvador (36.4%, a difference of 0.12%), American (36.4%, a difference of 0.16%), French American Indian (36.6%, a difference of 0.37%), and Nicaraguan (36.6%, a difference of 0.39%).
| Demographics | Rating | Rank | Births to Unmarried Women |
| Immigrants | Portugal | 0.2 /100 | #253 | Tragic 36.2% |
| Potawatomi | 0.2 /100 | #254 | Tragic 36.2% |
| Chickasaw | 0.2 /100 | #255 | Tragic 36.3% |
| Immigrants | Trinidad and Tobago | 0.2 /100 | #256 | Tragic 36.3% |
| Immigrants | Grenada | 0.2 /100 | #257 | Tragic 36.3% |
| Americans | 0.2 /100 | #258 | Tragic 36.4% |
| Immigrants | El Salvador | 0.2 /100 | #259 | Tragic 36.4% |
| Ottawa | 0.2 /100 | #260 | Tragic 36.5% |
| Trinidadians and Tobagonians | 0.2 /100 | #261 | Tragic 36.5% |
| French American Indians | 0.1 /100 | #262 | Tragic 36.6% |
| Nicaraguans | 0.1 /100 | #263 | Tragic 36.6% |
| Sub-Saharan Africans | 0.1 /100 | #264 | Tragic 36.7% |
| Cherokee | 0.1 /100 | #265 | Tragic 36.7% |
| Immigrants | Senegal | 0.1 /100 | #266 | Tragic 36.7% |
| Central Americans | 0.1 /100 | #267 | Tragic 36.7% |