Slovene vs Native Hawaiian Family Households
COMPARE
Slovene
Native Hawaiian
Family Households
Family Households Comparison
Slovenes
Native Hawaiians
62.4%
FAMILY HOUSEHOLDS
0.0/ 100
METRIC RATING
296th/ 347
METRIC RANK
68.4%
FAMILY HOUSEHOLDS
100.0/ 100
METRIC RATING
9th/ 347
METRIC RANK
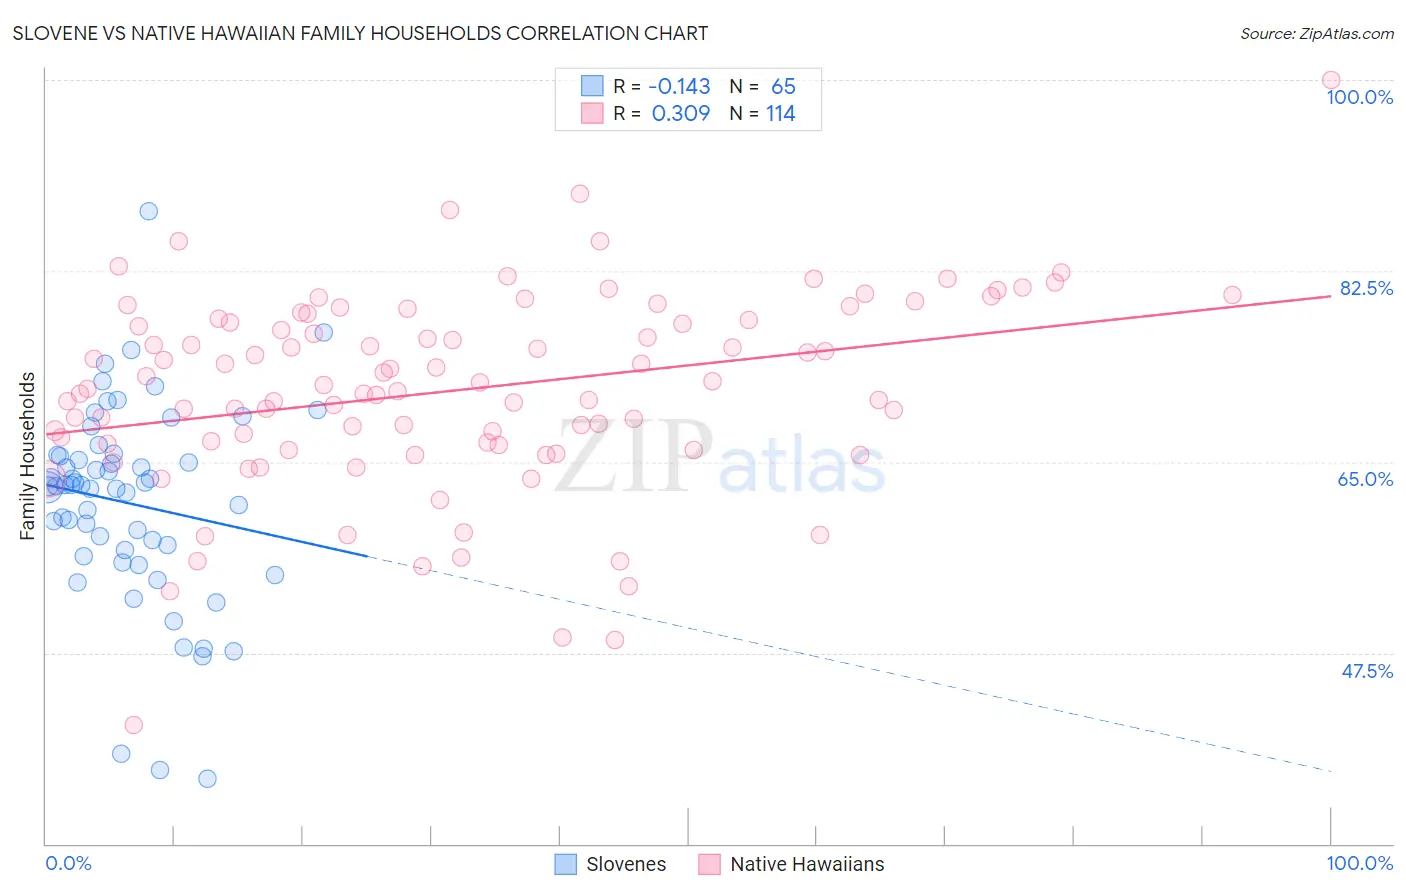
Slovene vs Native Hawaiian Family Households Correlation Chart
The statistical analysis conducted on geographies consisting of 261,256,985 people shows a poor negative correlation between the proportion of Slovenes and percentage of family households in the United States with a correlation coefficient (R) of -0.143 and weighted average of 62.4%. Similarly, the statistical analysis conducted on geographies consisting of 331,876,640 people shows a mild positive correlation between the proportion of Native Hawaiians and percentage of family households in the United States with a correlation coefficient (R) of 0.309 and weighted average of 68.4%, a difference of 9.5%.
Family Households Correlation Summary
| Measurement | Slovene | Native Hawaiian |
| Minimum | 35.9% | 40.9% |
| Maximum | 88.0% | 100.0% |
| Range | 52.0% | 59.1% |
| Mean | 61.2% | 71.6% |
| Median | 62.8% | 71.9% |
| Interquartile 25% (IQ1) | 56.6% | 66.7% |
| Interquartile 75% (IQ3) | 65.5% | 78.0% |
| Interquartile Range (IQR) | 9.0% | 11.3% |
| Standard Deviation (Sample) | 9.1% | 9.1% |
| Standard Deviation (Population) | 9.1% | 9.0% |
Similar Demographics by Family Households
Demographics Similar to Slovenes by Family Households
In terms of family households, the demographic groups most similar to Slovenes are Okinawan (62.5%, a difference of 0.010%), French American Indian (62.4%, a difference of 0.010%), Barbadian (62.5%, a difference of 0.020%), Immigrants from Spain (62.4%, a difference of 0.040%), and Immigrants from Sweden (62.5%, a difference of 0.090%).
| Demographics | Rating | Rank | Family Households |
| Immigrants | Nepal | 0.1 /100 | #289 | Tragic 62.7% |
| Immigrants | Grenada | 0.0 /100 | #290 | Tragic 62.6% |
| U.S. Virgin Islanders | 0.0 /100 | #291 | Tragic 62.6% |
| Immigrants | Burma/Myanmar | 0.0 /100 | #292 | Tragic 62.6% |
| Immigrants | Sweden | 0.0 /100 | #293 | Tragic 62.5% |
| Barbadians | 0.0 /100 | #294 | Tragic 62.5% |
| Okinawans | 0.0 /100 | #295 | Tragic 62.5% |
| Slovenes | 0.0 /100 | #296 | Tragic 62.4% |
| French American Indians | 0.0 /100 | #297 | Tragic 62.4% |
| Immigrants | Spain | 0.0 /100 | #298 | Tragic 62.4% |
| Immigrants | Kuwait | 0.0 /100 | #299 | Tragic 62.4% |
| Immigrants | Africa | 0.0 /100 | #300 | Tragic 62.4% |
| Immigrants | Albania | 0.0 /100 | #301 | Tragic 62.4% |
| Immigrants | Kenya | 0.0 /100 | #302 | Tragic 62.3% |
| Cree | 0.0 /100 | #303 | Tragic 62.3% |
Demographics Similar to Native Hawaiians by Family Households
In terms of family households, the demographic groups most similar to Native Hawaiians are Immigrants from Philippines (68.3%, a difference of 0.070%), Immigrants from Central America (68.3%, a difference of 0.14%), Korean (68.3%, a difference of 0.17%), Pueblo (68.2%, a difference of 0.25%), and Immigrants from Cuba (68.2%, a difference of 0.26%).
| Demographics | Rating | Rank | Family Households |
| Spanish American Indians | 100.0 /100 | #2 | Exceptional 71.2% |
| Tongans | 100.0 /100 | #3 | Exceptional 69.6% |
| Yakama | 100.0 /100 | #4 | Exceptional 69.3% |
| Yuman | 100.0 /100 | #5 | Exceptional 69.3% |
| Immigrants | Mexico | 100.0 /100 | #6 | Exceptional 69.1% |
| Mexicans | 100.0 /100 | #7 | Exceptional 69.0% |
| Immigrants | Fiji | 100.0 /100 | #8 | Exceptional 68.8% |
| Native Hawaiians | 100.0 /100 | #9 | Exceptional 68.4% |
| Immigrants | Philippines | 100.0 /100 | #10 | Exceptional 68.3% |
| Immigrants | Central America | 100.0 /100 | #11 | Exceptional 68.3% |
| Koreans | 100.0 /100 | #12 | Exceptional 68.3% |
| Pueblo | 100.0 /100 | #13 | Exceptional 68.2% |
| Immigrants | Cuba | 100.0 /100 | #14 | Exceptional 68.2% |
| Assyrians/Chaldeans/Syriacs | 100.0 /100 | #15 | Exceptional 68.2% |
| Immigrants | Vietnam | 100.0 /100 | #16 | Exceptional 68.2% |