Slovene vs Alaska Native Family Households
COMPARE
Slovene
Alaska Native
Family Households
Family Households Comparison
Slovenes
Alaska Natives
62.4%
FAMILY HOUSEHOLDS
0.0/ 100
METRIC RATING
296th/ 347
METRIC RANK
65.1%
FAMILY HOUSEHOLDS
97.3/ 100
METRIC RATING
107th/ 347
METRIC RANK
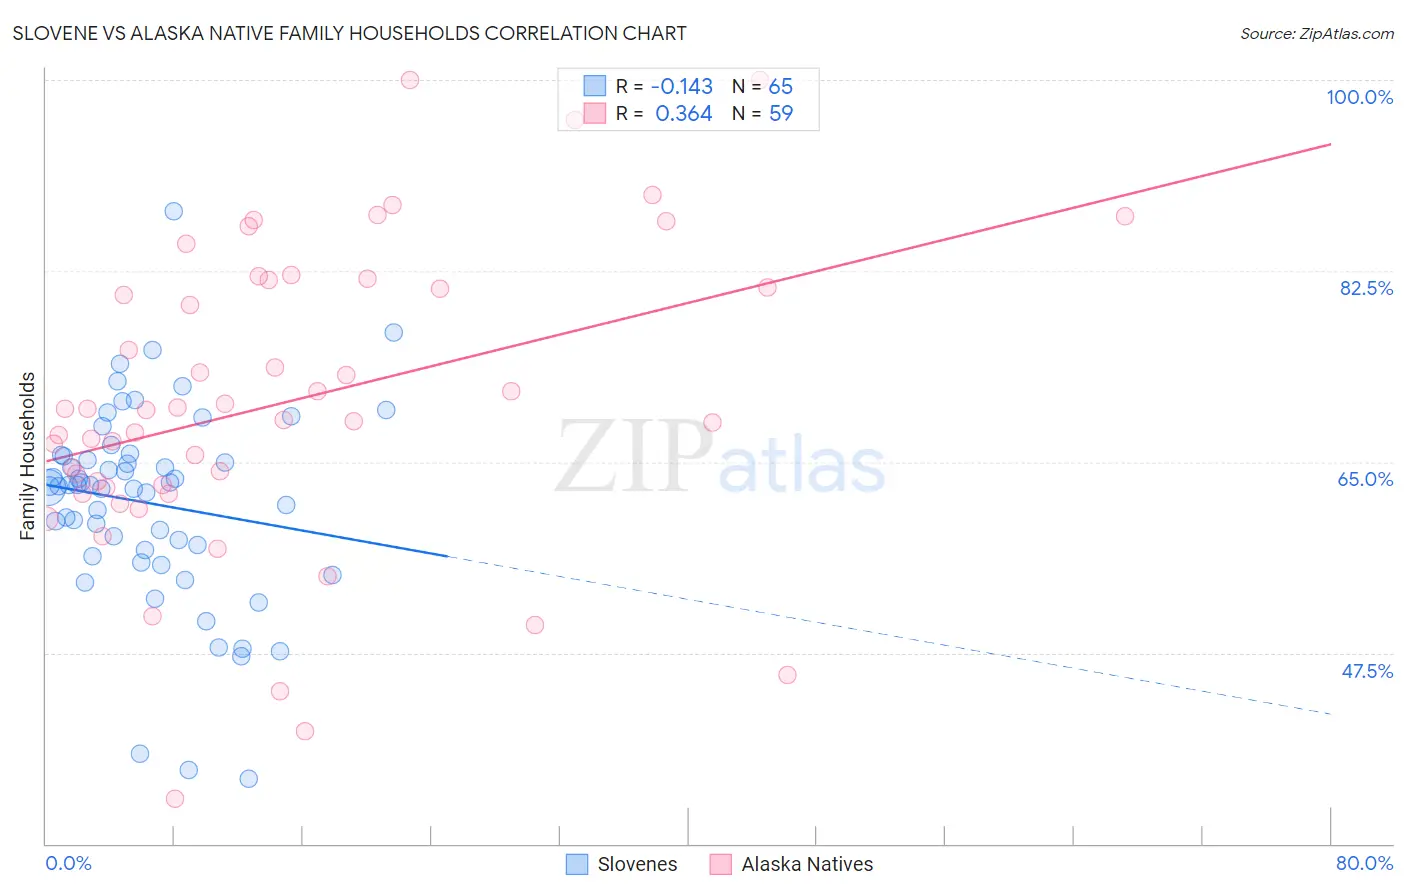
Slovene vs Alaska Native Family Households Correlation Chart
The statistical analysis conducted on geographies consisting of 261,256,985 people shows a poor negative correlation between the proportion of Slovenes and percentage of family households in the United States with a correlation coefficient (R) of -0.143 and weighted average of 62.4%. Similarly, the statistical analysis conducted on geographies consisting of 76,756,415 people shows a mild positive correlation between the proportion of Alaska Natives and percentage of family households in the United States with a correlation coefficient (R) of 0.364 and weighted average of 65.1%, a difference of 4.2%.
Family Households Correlation Summary
| Measurement | Slovene | Alaska Native |
| Minimum | 35.9% | 34.1% |
| Maximum | 88.0% | 100.0% |
| Range | 52.0% | 65.9% |
| Mean | 61.2% | 70.5% |
| Median | 62.8% | 69.7% |
| Interquartile 25% (IQ1) | 56.6% | 62.6% |
| Interquartile 75% (IQ3) | 65.5% | 81.7% |
| Interquartile Range (IQR) | 9.0% | 19.1% |
| Standard Deviation (Sample) | 9.1% | 14.0% |
| Standard Deviation (Population) | 9.1% | 13.9% |
Similar Demographics by Family Households
Demographics Similar to Slovenes by Family Households
In terms of family households, the demographic groups most similar to Slovenes are Okinawan (62.5%, a difference of 0.010%), French American Indian (62.4%, a difference of 0.010%), Barbadian (62.5%, a difference of 0.020%), Immigrants from Spain (62.4%, a difference of 0.040%), and Immigrants from Sweden (62.5%, a difference of 0.090%).
| Demographics | Rating | Rank | Family Households |
| Immigrants | Nepal | 0.1 /100 | #289 | Tragic 62.7% |
| Immigrants | Grenada | 0.0 /100 | #290 | Tragic 62.6% |
| U.S. Virgin Islanders | 0.0 /100 | #291 | Tragic 62.6% |
| Immigrants | Burma/Myanmar | 0.0 /100 | #292 | Tragic 62.6% |
| Immigrants | Sweden | 0.0 /100 | #293 | Tragic 62.5% |
| Barbadians | 0.0 /100 | #294 | Tragic 62.5% |
| Okinawans | 0.0 /100 | #295 | Tragic 62.5% |
| Slovenes | 0.0 /100 | #296 | Tragic 62.4% |
| French American Indians | 0.0 /100 | #297 | Tragic 62.4% |
| Immigrants | Spain | 0.0 /100 | #298 | Tragic 62.4% |
| Immigrants | Kuwait | 0.0 /100 | #299 | Tragic 62.4% |
| Immigrants | Africa | 0.0 /100 | #300 | Tragic 62.4% |
| Immigrants | Albania | 0.0 /100 | #301 | Tragic 62.4% |
| Immigrants | Kenya | 0.0 /100 | #302 | Tragic 62.3% |
| Cree | 0.0 /100 | #303 | Tragic 62.3% |
Demographics Similar to Alaska Natives by Family Households
In terms of family households, the demographic groups most similar to Alaska Natives are White/Caucasian (65.1%, a difference of 0.0%), English (65.1%, a difference of 0.010%), Palestinian (65.1%, a difference of 0.010%), Immigrants from Guatemala (65.0%, a difference of 0.050%), and Scandinavian (65.0%, a difference of 0.060%).
| Demographics | Rating | Rank | Family Households |
| Haitians | 98.1 /100 | #100 | Exceptional 65.2% |
| Chileans | 98.1 /100 | #101 | Exceptional 65.2% |
| Immigrants | Sri Lanka | 98.0 /100 | #102 | Exceptional 65.1% |
| Indians (Asian) | 97.9 /100 | #103 | Exceptional 65.1% |
| Spaniards | 97.8 /100 | #104 | Exceptional 65.1% |
| English | 97.4 /100 | #105 | Exceptional 65.1% |
| Whites/Caucasians | 97.3 /100 | #106 | Exceptional 65.1% |
| Alaska Natives | 97.3 /100 | #107 | Exceptional 65.1% |
| Palestinians | 97.2 /100 | #108 | Exceptional 65.1% |
| Immigrants | Guatemala | 96.9 /100 | #109 | Exceptional 65.0% |
| Scandinavians | 96.8 /100 | #110 | Exceptional 65.0% |
| Europeans | 96.8 /100 | #111 | Exceptional 65.0% |
| Immigrants | Jordan | 96.5 /100 | #112 | Exceptional 65.0% |
| Spanish | 96.2 /100 | #113 | Exceptional 65.0% |
| Argentineans | 95.7 /100 | #114 | Exceptional 65.0% |