Slavic vs Immigrants from St. Vincent and the Grenadines Average Family Size
COMPARE
Slavic
Immigrants from St. Vincent and the Grenadines
Average Family Size
Average Family Size Comparison
Slavs
Immigrants from St. Vincent and the Grenadines
3.13
AVERAGE FAMILY SIZE
0.1/ 100
METRIC RATING
308th/ 347
METRIC RANK
3.34
AVERAGE FAMILY SIZE
99.9/ 100
METRIC RATING
66th/ 347
METRIC RANK
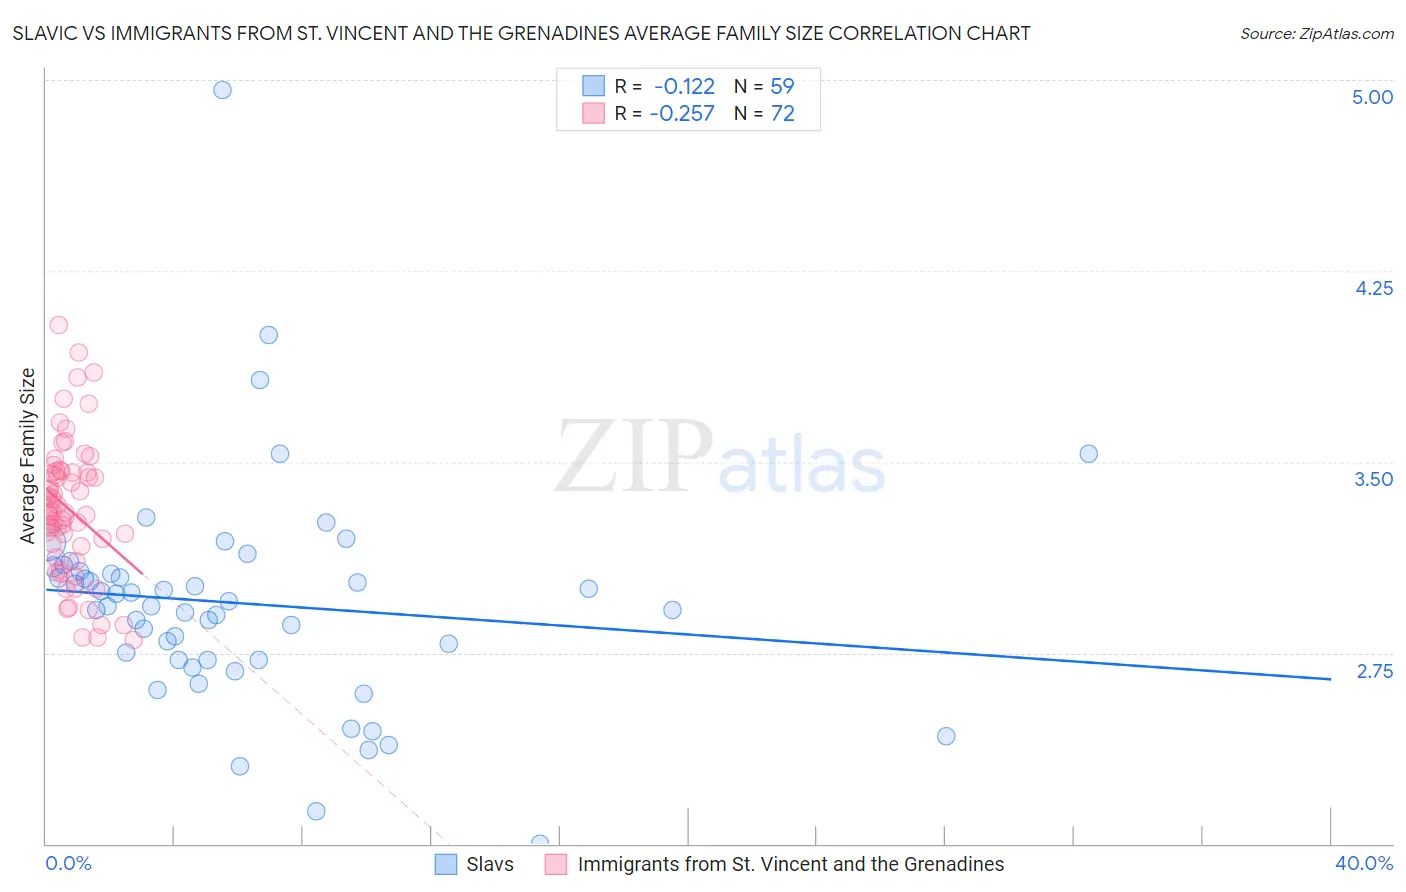
Slavic vs Immigrants from St. Vincent and the Grenadines Average Family Size Correlation Chart
The statistical analysis conducted on geographies consisting of 270,815,552 people shows a poor negative correlation between the proportion of Slavs and average family size in the United States with a correlation coefficient (R) of -0.122 and weighted average of 3.13. Similarly, the statistical analysis conducted on geographies consisting of 56,188,242 people shows a weak negative correlation between the proportion of Immigrants from St. Vincent and the Grenadines and average family size in the United States with a correlation coefficient (R) of -0.257 and weighted average of 3.34, a difference of 6.6%.
Average Family Size Correlation Summary
| Measurement | Slavic | Immigrants from St. Vincent and the Grenadines |
| Minimum | 2.00 | 2.80 |
| Maximum | 4.96 | 4.04 |
| Range | 2.96 | 1.24 |
| Mean | 2.94 | 3.31 |
| Median | 2.93 | 3.30 |
| Interquartile 25% (IQ1) | 2.72 | 3.18 |
| Interquartile 75% (IQ3) | 3.07 | 3.46 |
| Interquartile Range (IQR) | 0.35 | 0.28 |
| Standard Deviation (Sample) | 0.44 | 0.26 |
| Standard Deviation (Population) | 0.44 | 0.26 |
Similar Demographics by Average Family Size
Demographics Similar to Slavs by Average Family Size
In terms of average family size, the demographic groups most similar to Slavs are Northern European (3.13, a difference of 0.010%), Czechoslovakian (3.13, a difference of 0.030%), Immigrants from Serbia (3.13, a difference of 0.050%), Immigrants from Ireland (3.13, a difference of 0.060%), and Immigrants from Northern Europe (3.13, a difference of 0.070%).
| Demographics | Rating | Rank | Average Family Size |
| Macedonians | 0.2 /100 | #301 | Tragic 3.13 |
| Immigrants | Latvia | 0.2 /100 | #302 | Tragic 3.13 |
| British | 0.2 /100 | #303 | Tragic 3.13 |
| Immigrants | Switzerland | 0.2 /100 | #304 | Tragic 3.13 |
| Australians | 0.1 /100 | #305 | Tragic 3.13 |
| Immigrants | Ireland | 0.1 /100 | #306 | Tragic 3.13 |
| Immigrants | Serbia | 0.1 /100 | #307 | Tragic 3.13 |
| Slavs | 0.1 /100 | #308 | Tragic 3.13 |
| Northern Europeans | 0.1 /100 | #309 | Tragic 3.13 |
| Czechoslovakians | 0.1 /100 | #310 | Tragic 3.13 |
| Immigrants | Northern Europe | 0.1 /100 | #311 | Tragic 3.13 |
| Immigrants | Australia | 0.1 /100 | #312 | Tragic 3.13 |
| Bulgarians | 0.1 /100 | #313 | Tragic 3.13 |
| Russians | 0.1 /100 | #314 | Tragic 3.12 |
| Immigrants | Scotland | 0.1 /100 | #315 | Tragic 3.12 |
Demographics Similar to Immigrants from St. Vincent and the Grenadines by Average Family Size
In terms of average family size, the demographic groups most similar to Immigrants from St. Vincent and the Grenadines are Immigrants from Jamaica (3.33, a difference of 0.040%), Immigrants from Laos (3.34, a difference of 0.060%), Dominican (3.34, a difference of 0.080%), Immigrants from Cambodia (3.33, a difference of 0.12%), and Chinese (3.34, a difference of 0.15%).
| Demographics | Rating | Rank | Average Family Size |
| Japanese | 100.0 /100 | #59 | Exceptional 3.35 |
| Immigrants | Armenia | 100.0 /100 | #60 | Exceptional 3.35 |
| Central American Indians | 100.0 /100 | #61 | Exceptional 3.35 |
| Immigrants | Grenada | 100.0 /100 | #62 | Exceptional 3.34 |
| Chinese | 100.0 /100 | #63 | Exceptional 3.34 |
| Dominicans | 99.9 /100 | #64 | Exceptional 3.34 |
| Immigrants | Laos | 99.9 /100 | #65 | Exceptional 3.34 |
| Immigrants | St. Vincent and the Grenadines | 99.9 /100 | #66 | Exceptional 3.34 |
| Immigrants | Jamaica | 99.9 /100 | #67 | Exceptional 3.33 |
| Immigrants | Cambodia | 99.9 /100 | #68 | Exceptional 3.33 |
| Immigrants | Immigrants | 99.9 /100 | #69 | Exceptional 3.33 |
| Immigrants | Trinidad and Tobago | 99.9 /100 | #70 | Exceptional 3.33 |
| Immigrants | West Indies | 99.9 /100 | #71 | Exceptional 3.33 |
| Immigrants | Caribbean | 99.9 /100 | #72 | Exceptional 3.33 |
| Yaqui | 99.9 /100 | #73 | Exceptional 3.32 |