Dominican vs Immigrants from St. Vincent and the Grenadines Average Family Size
COMPARE
Dominican
Immigrants from St. Vincent and the Grenadines
Average Family Size
Average Family Size Comparison
Dominicans
Immigrants from St. Vincent and the Grenadines
3.34
AVERAGE FAMILY SIZE
99.9/ 100
METRIC RATING
64th/ 347
METRIC RANK
3.34
AVERAGE FAMILY SIZE
99.9/ 100
METRIC RATING
66th/ 347
METRIC RANK
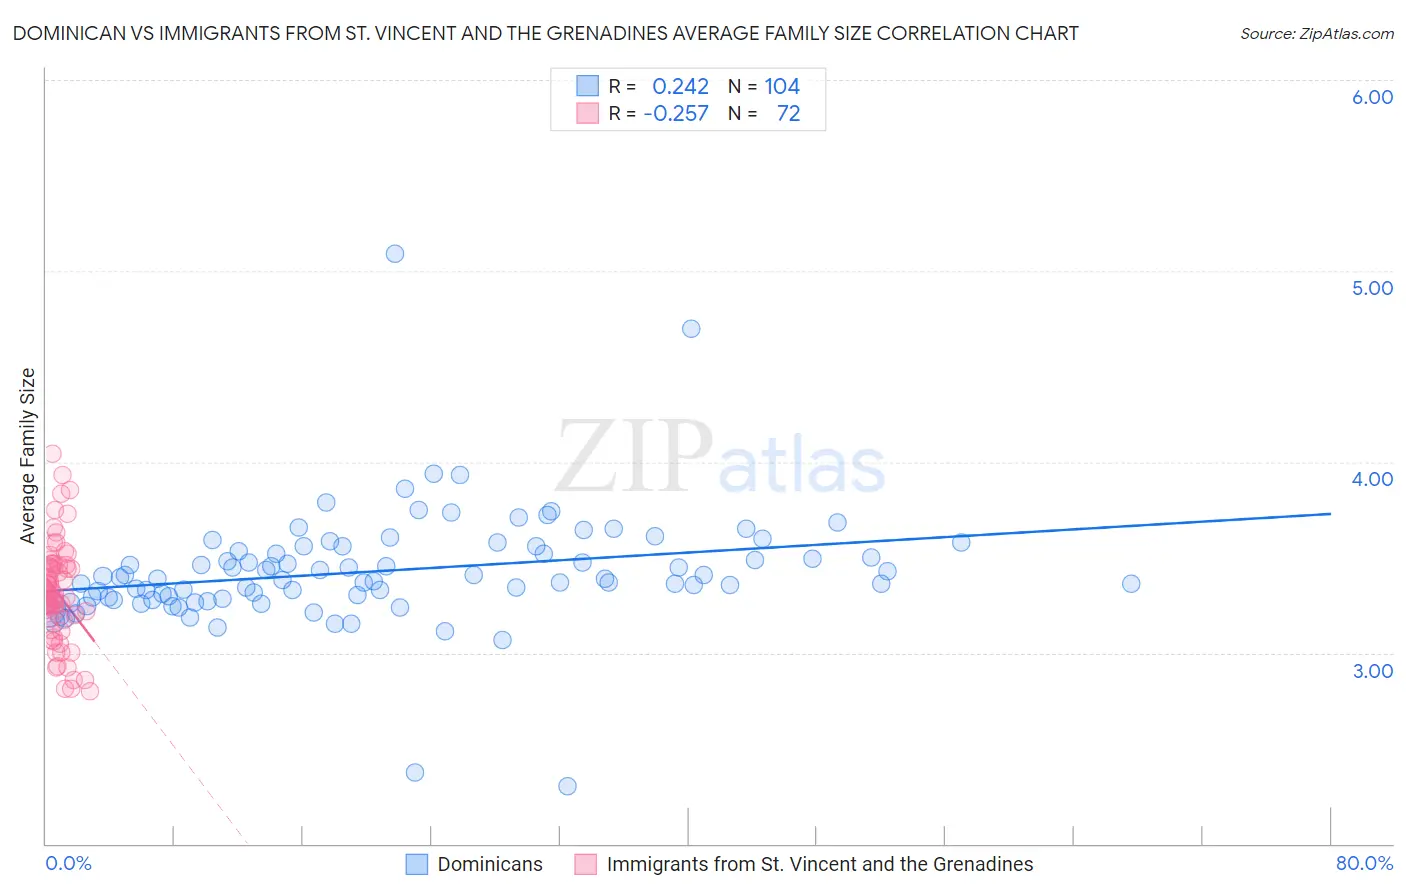
Dominican vs Immigrants from St. Vincent and the Grenadines Average Family Size Correlation Chart
The statistical analysis conducted on geographies consisting of 354,765,302 people shows a weak positive correlation between the proportion of Dominicans and average family size in the United States with a correlation coefficient (R) of 0.242 and weighted average of 3.34. Similarly, the statistical analysis conducted on geographies consisting of 56,188,242 people shows a weak negative correlation between the proportion of Immigrants from St. Vincent and the Grenadines and average family size in the United States with a correlation coefficient (R) of -0.257 and weighted average of 3.34, a difference of 0.080%.
Average Family Size Correlation Summary
| Measurement | Dominican | Immigrants from St. Vincent and the Grenadines |
| Minimum | 2.30 | 2.80 |
| Maximum | 5.09 | 4.04 |
| Range | 2.79 | 1.24 |
| Mean | 3.43 | 3.31 |
| Median | 3.39 | 3.30 |
| Interquartile 25% (IQ1) | 3.29 | 3.18 |
| Interquartile 75% (IQ3) | 3.54 | 3.46 |
| Interquartile Range (IQR) | 0.26 | 0.28 |
| Standard Deviation (Sample) | 0.31 | 0.26 |
| Standard Deviation (Population) | 0.31 | 0.26 |
Demographics Similar to Dominicans and Immigrants from St. Vincent and the Grenadines by Average Family Size
In terms of average family size, the demographic groups most similar to Dominicans are Immigrants from Laos (3.34, a difference of 0.020%), Chinese (3.34, a difference of 0.070%), Immigrants from Grenada (3.34, a difference of 0.090%), Immigrants from Jamaica (3.33, a difference of 0.12%), and Immigrants from Cambodia (3.33, a difference of 0.21%). Similarly, the demographic groups most similar to Immigrants from St. Vincent and the Grenadines are Immigrants from Jamaica (3.33, a difference of 0.040%), Immigrants from Laos (3.34, a difference of 0.060%), Immigrants from Cambodia (3.33, a difference of 0.12%), Chinese (3.34, a difference of 0.15%), and Immigrants (3.33, a difference of 0.16%).
| Demographics | Rating | Rank | Average Family Size |
| Immigrants | Honduras | 100.0 /100 | #55 | Exceptional 3.36 |
| Immigrants | Dominican Republic | 100.0 /100 | #56 | Exceptional 3.35 |
| Sri Lankans | 100.0 /100 | #57 | Exceptional 3.35 |
| Hondurans | 100.0 /100 | #58 | Exceptional 3.35 |
| Japanese | 100.0 /100 | #59 | Exceptional 3.35 |
| Immigrants | Armenia | 100.0 /100 | #60 | Exceptional 3.35 |
| Central American Indians | 100.0 /100 | #61 | Exceptional 3.35 |
| Immigrants | Grenada | 100.0 /100 | #62 | Exceptional 3.34 |
| Chinese | 100.0 /100 | #63 | Exceptional 3.34 |
| Dominicans | 99.9 /100 | #64 | Exceptional 3.34 |
| Immigrants | Laos | 99.9 /100 | #65 | Exceptional 3.34 |
| Immigrants | St. Vincent and the Grenadines | 99.9 /100 | #66 | Exceptional 3.34 |
| Immigrants | Jamaica | 99.9 /100 | #67 | Exceptional 3.33 |
| Immigrants | Cambodia | 99.9 /100 | #68 | Exceptional 3.33 |
| Immigrants | Immigrants | 99.9 /100 | #69 | Exceptional 3.33 |
| Immigrants | Trinidad and Tobago | 99.9 /100 | #70 | Exceptional 3.33 |
| Immigrants | West Indies | 99.9 /100 | #71 | Exceptional 3.33 |
| Immigrants | Caribbean | 99.9 /100 | #72 | Exceptional 3.33 |
| Yaqui | 99.9 /100 | #73 | Exceptional 3.32 |
| Immigrants | Sierra Leone | 99.9 /100 | #74 | Exceptional 3.32 |
| Immigrants | Barbados | 99.8 /100 | #75 | Exceptional 3.32 |