Sioux vs Immigrants from Denmark Family Households
COMPARE
Sioux
Immigrants from Denmark
Family Households
Family Households Comparison
Sioux
Immigrants from Denmark
64.6%
FAMILY HOUSEHOLDS
76.3/ 100
METRIC RATING
149th/ 347
METRIC RANK
62.9%
FAMILY HOUSEHOLDS
0.1/ 100
METRIC RATING
283rd/ 347
METRIC RANK
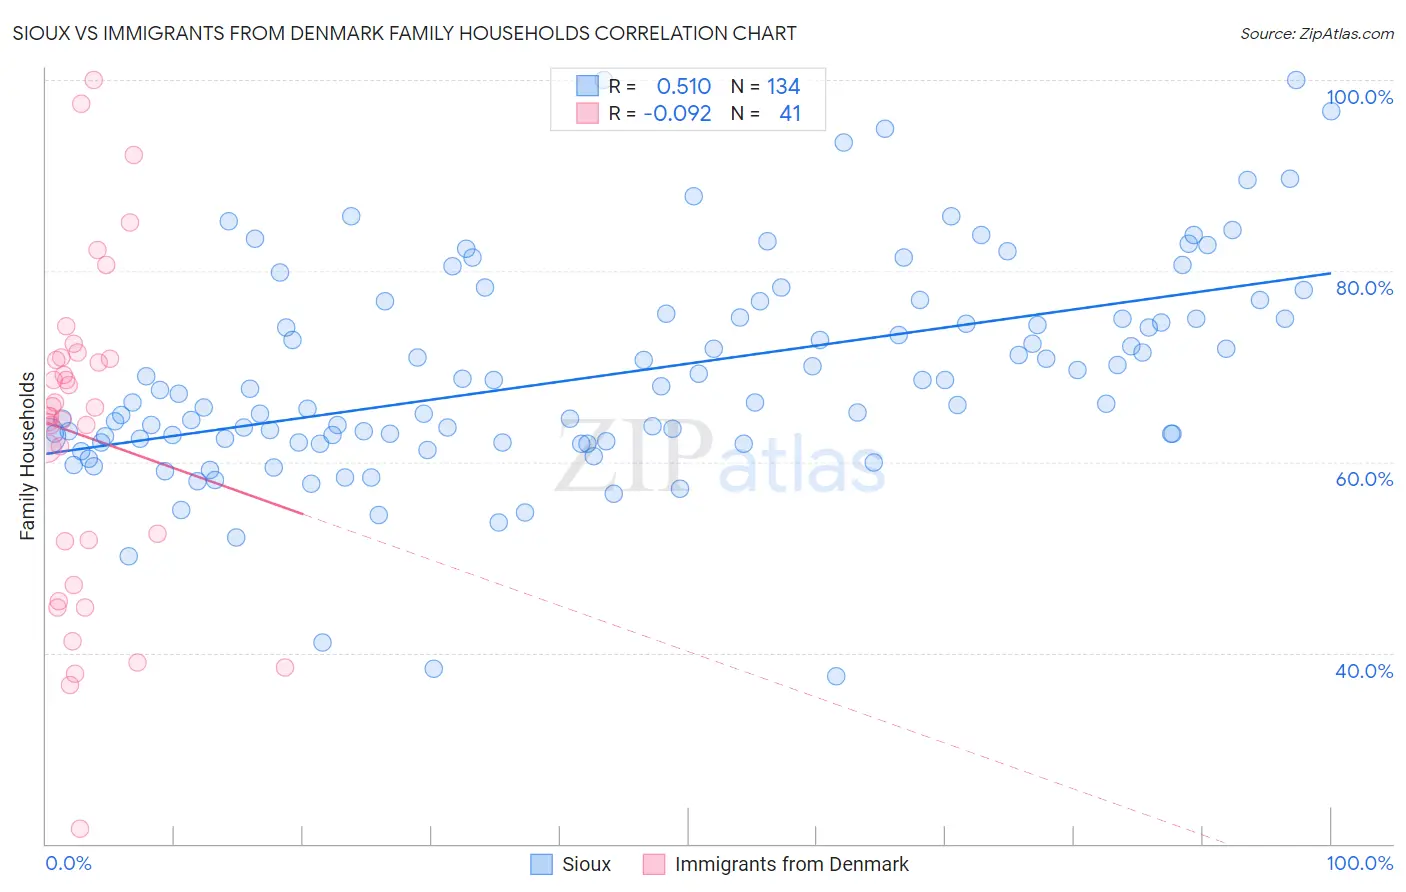
Sioux vs Immigrants from Denmark Family Households Correlation Chart
The statistical analysis conducted on geographies consisting of 234,114,463 people shows a substantial positive correlation between the proportion of Sioux and percentage of family households in the United States with a correlation coefficient (R) of 0.510 and weighted average of 64.6%. Similarly, the statistical analysis conducted on geographies consisting of 136,405,039 people shows a slight negative correlation between the proportion of Immigrants from Denmark and percentage of family households in the United States with a correlation coefficient (R) of -0.092 and weighted average of 62.9%, a difference of 2.7%.
Family Households Correlation Summary
| Measurement | Sioux | Immigrants from Denmark |
| Minimum | 37.6% | 21.6% |
| Maximum | 100.0% | 100.0% |
| Range | 62.4% | 78.4% |
| Mean | 69.1% | 62.7% |
| Median | 66.7% | 64.8% |
| Interquartile 25% (IQ1) | 62.2% | 49.4% |
| Interquartile 75% (IQ3) | 75.2% | 70.9% |
| Interquartile Range (IQR) | 13.0% | 21.5% |
| Standard Deviation (Sample) | 11.2% | 17.0% |
| Standard Deviation (Population) | 11.1% | 16.8% |
Similar Demographics by Family Households
Demographics Similar to Sioux by Family Households
In terms of family households, the demographic groups most similar to Sioux are Immigrants from Chile (64.6%, a difference of 0.0%), Delaware (64.6%, a difference of 0.0%), Immigrants from Romania (64.6%, a difference of 0.010%), Romanian (64.5%, a difference of 0.020%), and Syrian (64.5%, a difference of 0.020%).
| Demographics | Rating | Rank | Family Households |
| Pakistanis | 84.0 /100 | #142 | Excellent 64.7% |
| Czechoslovakians | 82.1 /100 | #143 | Excellent 64.6% |
| South American Indians | 81.9 /100 | #144 | Excellent 64.6% |
| Welsh | 80.1 /100 | #145 | Excellent 64.6% |
| Immigrants | Romania | 77.0 /100 | #146 | Good 64.6% |
| Immigrants | Chile | 76.5 /100 | #147 | Good 64.6% |
| Delaware | 76.3 /100 | #148 | Good 64.6% |
| Sioux | 76.3 /100 | #149 | Good 64.6% |
| Romanians | 75.3 /100 | #150 | Good 64.5% |
| Syrians | 75.2 /100 | #151 | Good 64.5% |
| Scottish | 70.9 /100 | #152 | Good 64.5% |
| Swedes | 69.8 /100 | #153 | Good 64.5% |
| Austrians | 68.5 /100 | #154 | Good 64.5% |
| Uruguayans | 67.7 /100 | #155 | Good 64.5% |
| Czechs | 67.0 /100 | #156 | Good 64.5% |
Demographics Similar to Immigrants from Denmark by Family Households
In terms of family households, the demographic groups most similar to Immigrants from Denmark are New Zealander (62.9%, a difference of 0.010%), Estonian (62.9%, a difference of 0.040%), Australian (62.8%, a difference of 0.040%), Immigrants from Bulgaria (63.0%, a difference of 0.13%), and Immigrants from Yemen (63.0%, a difference of 0.15%).
| Demographics | Rating | Rank | Family Households |
| Serbians | 0.3 /100 | #276 | Tragic 63.0% |
| Ottawa | 0.3 /100 | #277 | Tragic 63.0% |
| Immigrants | Belgium | 0.2 /100 | #278 | Tragic 63.0% |
| Immigrants | Yemen | 0.2 /100 | #279 | Tragic 63.0% |
| Immigrants | Bulgaria | 0.2 /100 | #280 | Tragic 63.0% |
| Estonians | 0.2 /100 | #281 | Tragic 62.9% |
| New Zealanders | 0.1 /100 | #282 | Tragic 62.9% |
| Immigrants | Denmark | 0.1 /100 | #283 | Tragic 62.9% |
| Australians | 0.1 /100 | #284 | Tragic 62.8% |
| Mongolians | 0.1 /100 | #285 | Tragic 62.8% |
| British West Indians | 0.1 /100 | #286 | Tragic 62.8% |
| Latvians | 0.1 /100 | #287 | Tragic 62.8% |
| Immigrants | Uganda | 0.1 /100 | #288 | Tragic 62.7% |
| Immigrants | Nepal | 0.1 /100 | #289 | Tragic 62.7% |
| Immigrants | Grenada | 0.0 /100 | #290 | Tragic 62.6% |