Sierra Leonean vs Immigrants from Jordan Family Households

COMPARE

Sierra Leonean
Race
Ancestry
AfghanAfricanAlaska NativeAlaskan AthabascanAlbanianAleutAlsatianAmericanApacheArabArapahoArgentineanArmenianAssyrian/Chaldean/SyriacAustralianAustrianBahamianBangladeshiBarbadianBasqueBelgianBelizeanBermudanBhutaneseBlackfeetBolivianBrazilianBritishBritish West IndianBulgarianBurmeseCajunCambodianCanadianCape VerdeanCarpatho RusynCelticCentral AmericanCentral American IndianCherokeeCheyenneChickasawChileanChineseChippewaChoctawColombianColvilleComancheCosta RicanCreeCreekCroatianCrowCubanCypriotCzechCzechoslovakianDanishDelawareDominicanDutchDutch West IndianEastern EuropeanEcuadorianEgyptianEnglishEstonianEthiopianEuropeanFijianFilipinoFinnishFrenchFrench American IndianFrench CanadianGermanGerman RussianGhanaianGreekGuamanian/ChamorroGuatemalanGuyaneseHaitianHmongHonduranHopiHoumaHungarianIcelanderIndian (Asian)IndonesianInupiatIranianIraqiIrishIroquoisIsraeliItalianJamaicanJapaneseJordanianKenyanKiowaKoreanLaotianLatvianLebaneseLiberianLithuanianLumbeeLuxembourgerMacedonianMalaysianMalteseMarshalleseMenomineeMexicanMexican American IndianMongolianMoroccanNative HawaiianNavajoNepaleseNew ZealanderNicaraguanNigerianNorthern EuropeanNorwegianOkinawanOsageOttawaPaiutePakistaniPalestinianPanamanianParaguayanPennsylvania GermanPeruvianPimaPolishPortuguesePotawatomiPuebloPuerto RicanPuget Sound SalishRomanianRussianSalvadoranSamoanScandinavianScotch-IrishScottishSeminoleSenegaleseSerbianShoshoneSierra LeoneanSiouxSlavicSlovakSloveneSomaliSouth AfricanSouth AmericanSouth American IndianSoviet UnionSpaniardSpanishSpanish AmericanSpanish American IndianSri LankanSubsaharan AfricanSudaneseSwedishSwissSyrianTaiwaneseThaiTlingit-HaidaTohono O'OdhamTonganTrinidadian and TobagonianTsimshianTurkishU.S. Virgin IslanderUgandanUkrainianUruguayanUteVenezuelanVietnameseWelshWest IndianYakamaYaquiYugoslavianYumanYup'ikZimbabwean
Immigration
NonimmigrantsImmigrantsAfghanistanAfricaAlbaniaArgentinaArmeniaAsiaAustraliaAustriaBahamasBangladeshBarbadosBelarusBelgiumBelizeBoliviaBosnia and HerzegovinaBrazilBulgariaBurma/MyanmarCabo VerdeCambodiaCameroonCanadaCaribbeanCentral AmericaChileChinaColombiaCongoCosta RicaCroatiaCubaCzechoslovakiaDenmarkDominicaDominican RepublicEastern AfricaEastern AsiaEastern EuropeEcuadorEgyptEl SalvadorEnglandEritreaEthiopiaEuropeFijiFranceGermanyGhanaGreeceGrenadaGuatemalaGuyanaHaitiHondurasHong KongHungaryIndiaIndonesiaIranIraqIrelandIsraelItalyJamaicaJapanKazakhstanKenyaKoreaKuwaitLaosLatin AmericaLatviaLebanonLiberiaLithuaniaMalaysiaMexicoMicronesiaMiddle AfricaMoldovaMoroccoNepalNetherlandsNicaraguaNigeriaNorth AmericaNorth MacedoniaNorthern AfricaNorthern EuropeNorwayOceaniaPakistanPanamaPeruPhilippinesPolandPortugalRomaniaRussiaSaudi ArabiaScotlandSenegalSerbiaSierra LeoneSingaporeSomaliaSouth AfricaSouth AmericaSouth Central AsiaSouth Eastern AsiaSouthern EuropeSpainSri LankaSt. Vincent and the GrenadinesSudanSwedenSwitzerlandSyriaTaiwanThailandTrinidad and TobagoTurkeyUgandaUkraineUruguayUzbekistanVenezuelaVietnamWest IndiesWestern AfricaWestern AsiaWestern EuropeYemenZaireZimbabweAzores
Immigrants from Jordan
Race
Ancestry
AfghanAfricanAlaska NativeAlaskan AthabascanAlbanianAleutAlsatianAmericanApacheArabArapahoArgentineanArmenianAssyrian/Chaldean/SyriacAustralianAustrianBahamianBangladeshiBarbadianBasqueBelgianBelizeanBermudanBhutaneseBlackfeetBolivianBrazilianBritishBritish West IndianBulgarianBurmeseCajunCambodianCanadianCape VerdeanCarpatho RusynCelticCentral AmericanCentral American IndianCherokeeCheyenneChickasawChileanChineseChippewaChoctawColombianColvilleComancheCosta RicanCreeCreekCroatianCrowCubanCypriotCzechCzechoslovakianDanishDelawareDominicanDutchDutch West IndianEastern EuropeanEcuadorianEgyptianEnglishEstonianEthiopianEuropeanFijianFilipinoFinnishFrenchFrench American IndianFrench CanadianGermanGerman RussianGhanaianGreekGuamanian/ChamorroGuatemalanGuyaneseHaitianHmongHonduranHopiHoumaHungarianIcelanderIndian (Asian)IndonesianInupiatIranianIraqiIrishIroquoisIsraeliItalianJamaicanJapaneseJordanianKenyanKiowaKoreanLaotianLatvianLebaneseLiberianLithuanianLumbeeLuxembourgerMacedonianMalaysianMalteseMarshalleseMenomineeMexicanMexican American IndianMongolianMoroccanNative HawaiianNavajoNepaleseNew ZealanderNicaraguanNigerianNorthern EuropeanNorwegianOkinawanOsageOttawaPaiutePakistaniPalestinianPanamanianParaguayanPennsylvania GermanPeruvianPimaPolishPortuguesePotawatomiPuebloPuerto RicanPuget Sound SalishRomanianRussianSalvadoranSamoanScandinavianScotch-IrishScottishSeminoleSenegaleseSerbianShoshoneSiouxSlavicSlovakSloveneSomaliSouth AfricanSouth AmericanSouth American IndianSoviet UnionSpaniardSpanishSpanish AmericanSpanish American IndianSri LankanSubsaharan AfricanSudaneseSwedishSwissSyrianTaiwaneseThaiTlingit-HaidaTohono O'OdhamTonganTrinidadian and TobagonianTsimshianTurkishU.S. Virgin IslanderUgandanUkrainianUruguayanUteVenezuelanVietnameseWelshWest IndianYakamaYaquiYugoslavianYumanYup'ikZimbabwean
Immigration
NonimmigrantsImmigrantsAfghanistanAfricaAlbaniaArgentinaArmeniaAsiaAustraliaAustriaBahamasBangladeshBarbadosBelarusBelgiumBelizeBoliviaBosnia and HerzegovinaBrazilBulgariaBurma/MyanmarCabo VerdeCambodiaCameroonCanadaCaribbeanCentral AmericaChileChinaColombiaCongoCosta RicaCroatiaCubaCzechoslovakiaDenmarkDominicaDominican RepublicEastern AfricaEastern AsiaEastern EuropeEcuadorEgyptEl SalvadorEnglandEritreaEthiopiaEuropeFijiFranceGermanyGhanaGreeceGrenadaGuatemalaGuyanaHaitiHondurasHong KongHungaryIndiaIndonesiaIranIraqIrelandIsraelItalyJamaicaJapanJordanKazakhstanKenyaKoreaKuwaitLaosLatin AmericaLatviaLebanonLiberiaLithuaniaMalaysiaMexicoMicronesiaMiddle AfricaMoldovaMoroccoNepalNetherlandsNicaraguaNigeriaNorth AmericaNorth MacedoniaNorthern AfricaNorthern EuropeNorwayOceaniaPakistanPanamaPeruPhilippinesPolandPortugalRomaniaRussiaSaudi ArabiaScotlandSenegalSerbiaSierra LeoneSingaporeSomaliaSouth AfricaSouth AmericaSouth Central AsiaSouth Eastern AsiaSouthern EuropeSpainSri LankaSt. Vincent and the GrenadinesSudanSwedenSwitzerlandSyriaTaiwanThailandTrinidad and TobagoTurkeyUgandaUkraineUruguayUzbekistanVenezuelaVietnamWest IndiesWestern AfricaWestern AsiaWestern EuropeYemenZaireZimbabweAzores
Family Households
Income
Poverty
Unemployment
Labor Participation
Family Structure
Vehicle Availability
Education Level
Disability

Family Households Comparison

Sierra Leoneans

Immigrants from Jordan

Poor
Exceptional
63.9%
FAMILY HOUSEHOLDS
11.2/ 100
METRIC RATING
209th/ 347
METRIC RANK
65.0%
FAMILY HOUSEHOLDS
96.5/ 100
METRIC RATING
112th/ 347
METRIC RANK

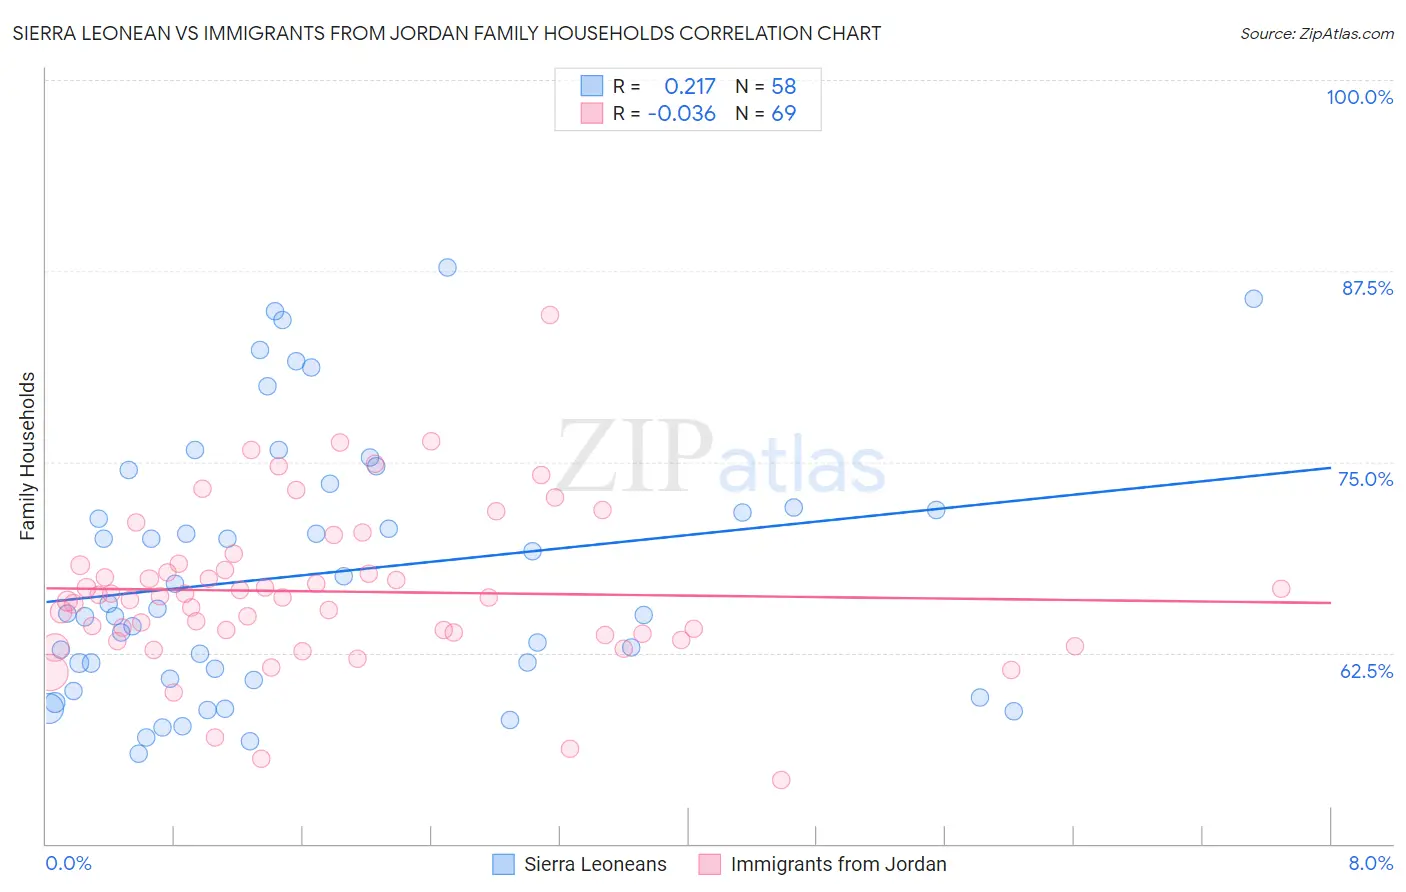
Sierra Leonean vs Immigrants from Jordan Family Households Correlation Chart

The statistical analysis conducted on geographies consisting of 83,352,562 people shows a weak positive correlation between the proportion of Sierra Leoneans and percentage of family households in the United States with a correlation coefficient (R) of 0.217 and weighted average of 63.9%. Similarly, the statistical analysis conducted on geographies consisting of 181,252,628 people shows no correlation between the proportion of Immigrants from Jordan and percentage of family households in the United States with a correlation coefficient (R) of -0.036 and weighted average of 65.0%, a difference of 1.8%.
Sierra Leonean vs Immigrants from Jordan Family Households

Family Households Correlation Summary

MeasurementSierra LeoneanImmigrants from Jordan
Minimum55.9%54.2%
Maximum87.8%84.6%
Range31.8%30.4%
Mean67.7%66.5%
Median65.2%66.1%
Interquartile 25% (IQ1)60.8%63.7%
Interquartile 75% (IQ3)72.0%68.3%
Interquartile Range (IQR)11.2%4.6%
Standard Deviation (Sample)8.4%5.2%
Standard Deviation (Population)8.4%5.1%

Similar Demographics by Family Households

Demographics Similar to Sierra Leoneans by Family Households

In terms of family households, the demographic groups most similar to Sierra Leoneans are Nigerian (63.9%, a difference of 0.010%), Immigrants from Bangladesh (63.9%, a difference of 0.010%), Immigrants from Lithuania (63.9%, a difference of 0.030%), Brazilian (63.9%, a difference of 0.040%), and Immigrants from Uruguay (63.9%, a difference of 0.050%).
DemographicsRating | RankFamily Households
Iranians
13.5
/100
|
#202
Poor
63.9%
Norwegians
13.2
/100
|
#203
Poor
63.9%
Immigrants | Uruguay
12.8
/100
|
#204
Poor
63.9%
Brazilians
12.4
/100
|
#205
Poor
63.9%
Immigrants | Lithuania
12.1
/100
|
#206
Poor
63.9%
Nigerians
11.5
/100
|
#207
Poor
63.9%
Immigrants | Bangladesh
11.4
/100
|
#208
Poor
63.9%
Sierra Leoneans
11.2
/100
|
#209
Poor
63.9%
Immigrants | Thailand
9.6
/100
|
#210
Tragic
63.8%
Shoshone
9.4
/100
|
#211
Tragic
63.8%
Immigrants | Netherlands
9.4
/100
|
#212
Tragic
63.8%
Immigrants | Northern Europe
8.8
/100
|
#213
Tragic
63.8%
Celtics
8.0
/100
|
#214
Tragic
63.8%
Belgians
7.6
/100
|
#215
Tragic
63.8%
Croatians
7.3
/100
|
#216
Tragic
63.8%

Demographics Similar to Immigrants from Jordan by Family Households

In terms of family households, the demographic groups most similar to Immigrants from Jordan are European (65.0%, a difference of 0.030%), Spanish (65.0%, a difference of 0.030%), Scandinavian (65.0%, a difference of 0.040%), Immigrants from Guatemala (65.0%, a difference of 0.050%), and Argentinean (65.0%, a difference of 0.060%).
DemographicsRating | RankFamily Households
English
97.4
/100
|
#105
Exceptional
65.1%
Whites/Caucasians
97.3
/100
|
#106
Exceptional
65.1%
Alaska Natives
97.3
/100
|
#107
Exceptional
65.1%
Palestinians
97.2
/100
|
#108
Exceptional
65.1%
Immigrants | Guatemala
96.9
/100
|
#109
Exceptional
65.0%
Scandinavians
96.8
/100
|
#110
Exceptional
65.0%
Europeans
96.8
/100
|
#111
Exceptional
65.0%
Immigrants | Jordan
96.5
/100
|
#112
Exceptional
65.0%
Spanish
96.2
/100
|
#113
Exceptional
65.0%
Argentineans
95.7
/100
|
#114
Exceptional
65.0%
Ecuadorians
95.4
/100
|
#115
Exceptional
65.0%
Immigrants | Iraq
95.4
/100
|
#116
Exceptional
65.0%
Cherokee
95.3
/100
|
#117
Exceptional
65.0%
Dutch
95.1
/100
|
#118
Exceptional
64.9%
Immigrants | Eastern Asia
94.4
/100
|
#119
Exceptional
64.9%