Kenyan vs Immigrants from Jordan Family Households
COMPARE
Kenyan
Immigrants from Jordan
Family Households
Family Households Comparison
Kenyans
Immigrants from Jordan
63.2%
FAMILY HOUSEHOLDS
0.5/ 100
METRIC RATING
264th/ 347
METRIC RANK
65.0%
FAMILY HOUSEHOLDS
96.5/ 100
METRIC RATING
112th/ 347
METRIC RANK
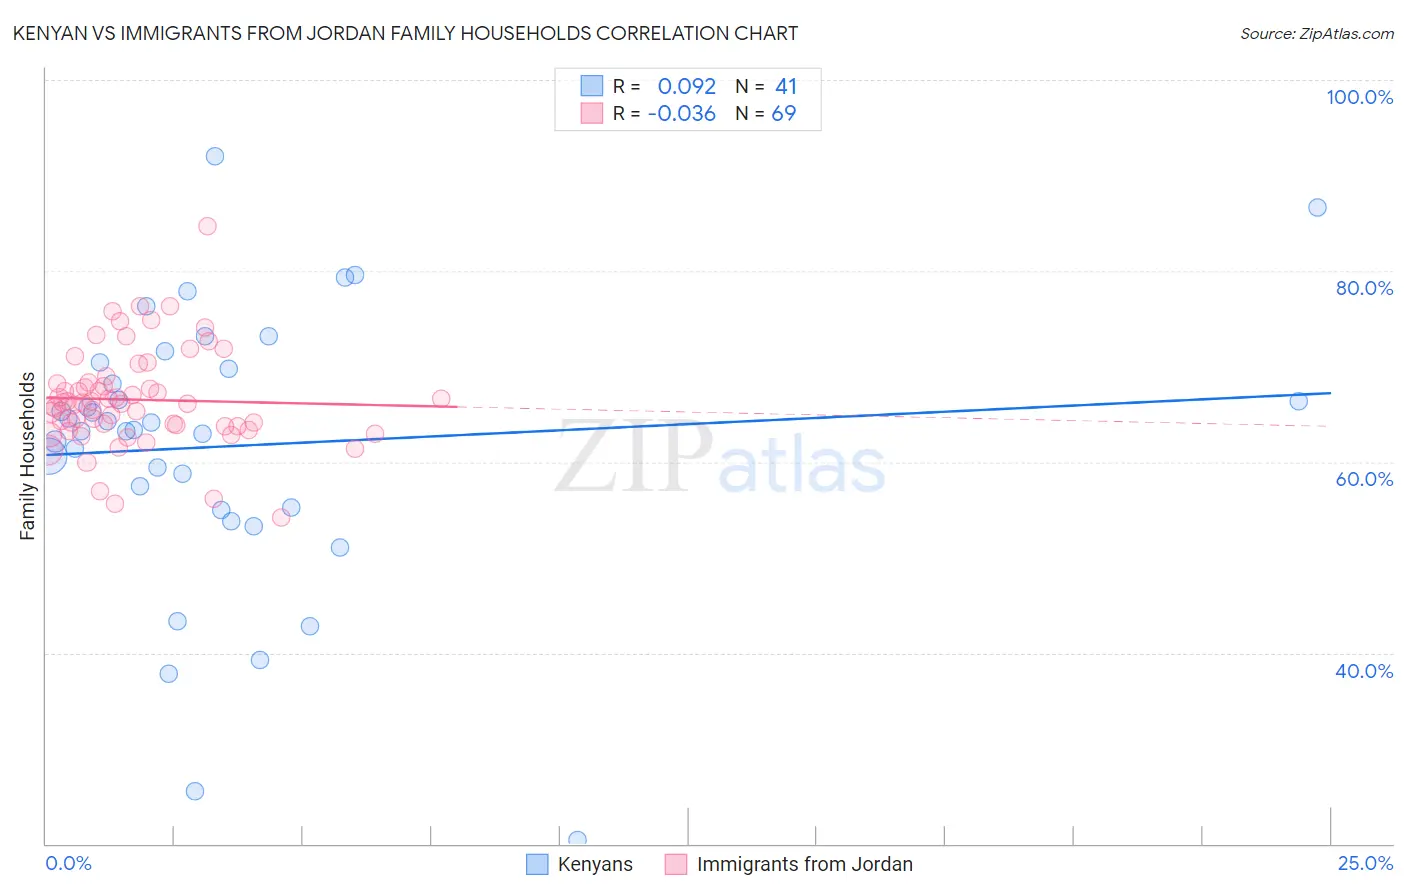
Kenyan vs Immigrants from Jordan Family Households Correlation Chart
The statistical analysis conducted on geographies consisting of 168,172,574 people shows a slight positive correlation between the proportion of Kenyans and percentage of family households in the United States with a correlation coefficient (R) of 0.092 and weighted average of 63.2%. Similarly, the statistical analysis conducted on geographies consisting of 181,252,628 people shows no correlation between the proportion of Immigrants from Jordan and percentage of family households in the United States with a correlation coefficient (R) of -0.036 and weighted average of 65.0%, a difference of 2.9%.
Family Households Correlation Summary
| Measurement | Kenyan | Immigrants from Jordan |
| Minimum | 20.4% | 54.2% |
| Maximum | 92.0% | 84.6% |
| Range | 71.6% | 30.4% |
| Mean | 61.7% | 66.5% |
| Median | 63.4% | 66.1% |
| Interquartile 25% (IQ1) | 55.1% | 63.7% |
| Interquartile 75% (IQ3) | 70.1% | 68.3% |
| Interquartile Range (IQR) | 14.9% | 4.6% |
| Standard Deviation (Sample) | 14.5% | 5.2% |
| Standard Deviation (Population) | 14.4% | 5.1% |
Similar Demographics by Family Households
Demographics Similar to Kenyans by Family Households
In terms of family households, the demographic groups most similar to Kenyans are Cheyenne (63.2%, a difference of 0.010%), Colville (63.2%, a difference of 0.010%), Immigrants from Western Africa (63.1%, a difference of 0.020%), Immigrants from Ireland (63.2%, a difference of 0.030%), and Immigrants from Russia (63.2%, a difference of 0.040%).
| Demographics | Rating | Rank | Family Households |
| Icelanders | 0.8 /100 | #257 | Tragic 63.3% |
| Immigrants | Barbados | 0.7 /100 | #258 | Tragic 63.2% |
| Immigrants | Western Europe | 0.6 /100 | #259 | Tragic 63.2% |
| Cypriots | 0.6 /100 | #260 | Tragic 63.2% |
| Immigrants | Russia | 0.6 /100 | #261 | Tragic 63.2% |
| Immigrants | Ireland | 0.6 /100 | #262 | Tragic 63.2% |
| Cheyenne | 0.5 /100 | #263 | Tragic 63.2% |
| Kenyans | 0.5 /100 | #264 | Tragic 63.2% |
| Colville | 0.5 /100 | #265 | Tragic 63.2% |
| Immigrants | Western Africa | 0.5 /100 | #266 | Tragic 63.1% |
| Israelis | 0.4 /100 | #267 | Tragic 63.1% |
| Immigrants | Singapore | 0.4 /100 | #268 | Tragic 63.1% |
| Yugoslavians | 0.4 /100 | #269 | Tragic 63.1% |
| Immigrants | Austria | 0.3 /100 | #270 | Tragic 63.1% |
| Immigrants | Croatia | 0.3 /100 | #271 | Tragic 63.1% |
Demographics Similar to Immigrants from Jordan by Family Households
In terms of family households, the demographic groups most similar to Immigrants from Jordan are European (65.0%, a difference of 0.030%), Spanish (65.0%, a difference of 0.030%), Scandinavian (65.0%, a difference of 0.040%), Immigrants from Guatemala (65.0%, a difference of 0.050%), and Argentinean (65.0%, a difference of 0.060%).
| Demographics | Rating | Rank | Family Households |
| English | 97.4 /100 | #105 | Exceptional 65.1% |
| Whites/Caucasians | 97.3 /100 | #106 | Exceptional 65.1% |
| Alaska Natives | 97.3 /100 | #107 | Exceptional 65.1% |
| Palestinians | 97.2 /100 | #108 | Exceptional 65.1% |
| Immigrants | Guatemala | 96.9 /100 | #109 | Exceptional 65.0% |
| Scandinavians | 96.8 /100 | #110 | Exceptional 65.0% |
| Europeans | 96.8 /100 | #111 | Exceptional 65.0% |
| Immigrants | Jordan | 96.5 /100 | #112 | Exceptional 65.0% |
| Spanish | 96.2 /100 | #113 | Exceptional 65.0% |
| Argentineans | 95.7 /100 | #114 | Exceptional 65.0% |
| Ecuadorians | 95.4 /100 | #115 | Exceptional 65.0% |
| Immigrants | Iraq | 95.4 /100 | #116 | Exceptional 65.0% |
| Cherokee | 95.3 /100 | #117 | Exceptional 65.0% |
| Dutch | 95.1 /100 | #118 | Exceptional 64.9% |
| Immigrants | Eastern Asia | 94.4 /100 | #119 | Exceptional 64.9% |