Shoshone vs Ghanaian Currently Married
COMPARE
Shoshone
Ghanaian
Currently Married
Currently Married Comparison
Shoshone
Ghanaians
44.0%
CURRENTLY MARRIED
0.2/ 100
METRIC RATING
256th/ 347
METRIC RANK
42.9%
CURRENTLY MARRIED
0.0/ 100
METRIC RATING
286th/ 347
METRIC RANK
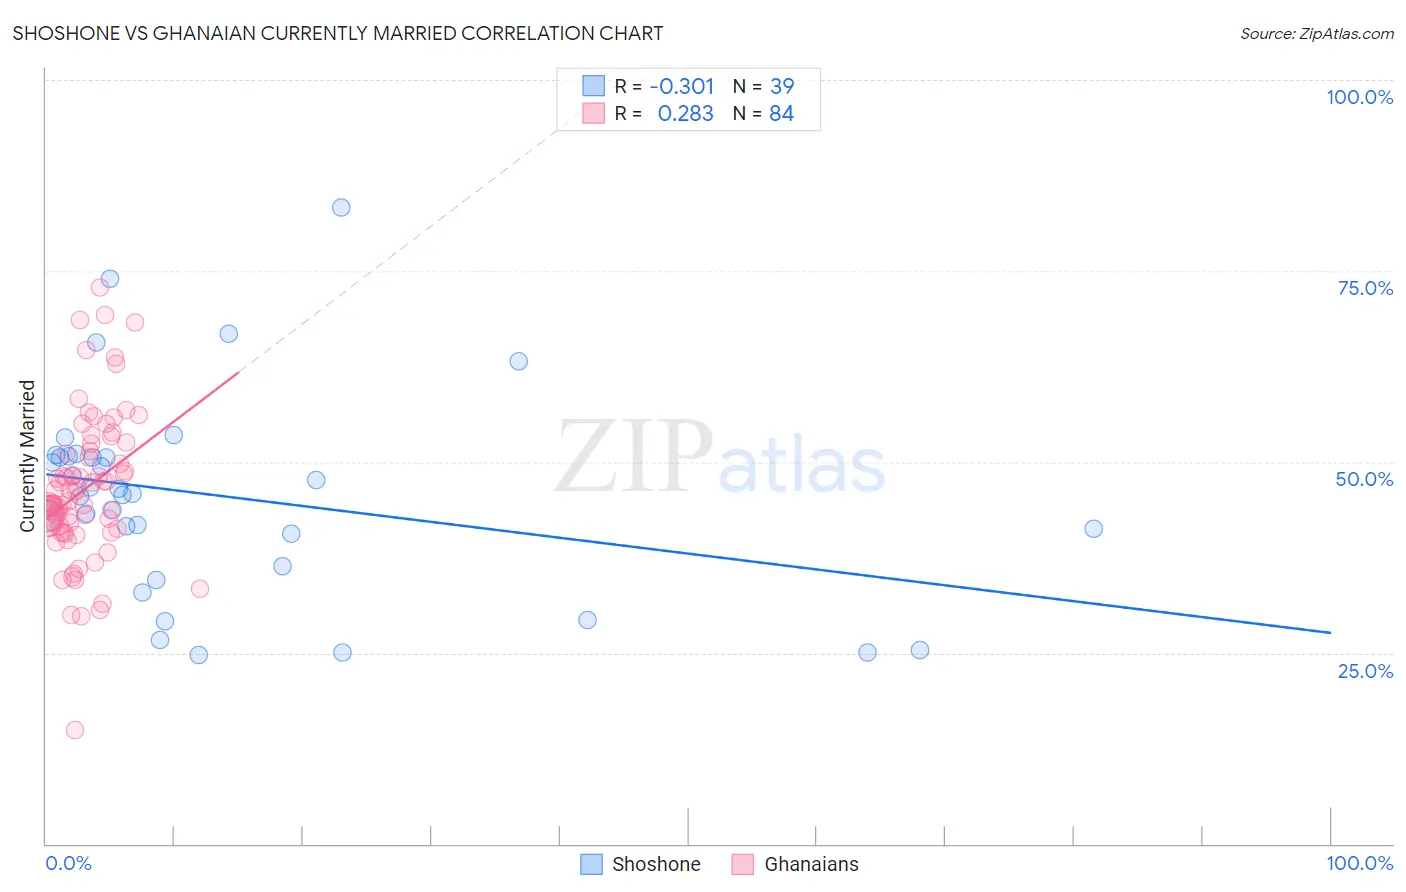
Shoshone vs Ghanaian Currently Married Correlation Chart
The statistical analysis conducted on geographies consisting of 66,627,152 people shows a mild negative correlation between the proportion of Shoshone and percentage of population currently married in the United States with a correlation coefficient (R) of -0.301 and weighted average of 44.0%. Similarly, the statistical analysis conducted on geographies consisting of 190,682,082 people shows a weak positive correlation between the proportion of Ghanaians and percentage of population currently married in the United States with a correlation coefficient (R) of 0.283 and weighted average of 42.9%, a difference of 2.4%.
Currently Married Correlation Summary
| Measurement | Shoshone | Ghanaian |
| Minimum | 24.7% | 14.9% |
| Maximum | 83.3% | 72.9% |
| Range | 58.6% | 58.0% |
| Mean | 45.5% | 46.3% |
| Median | 45.8% | 44.6% |
| Interquartile 25% (IQ1) | 36.3% | 41.5% |
| Interquartile 75% (IQ3) | 50.8% | 51.2% |
| Interquartile Range (IQR) | 14.5% | 9.8% |
| Standard Deviation (Sample) | 13.3% | 9.6% |
| Standard Deviation (Population) | 13.2% | 9.6% |
Similar Demographics by Currently Married
Demographics Similar to Shoshone by Currently Married
In terms of currently married, the demographic groups most similar to Shoshone are Yakama (44.0%, a difference of 0.050%), Vietnamese (44.0%, a difference of 0.12%), Immigrants from Africa (43.9%, a difference of 0.20%), Ute (43.9%, a difference of 0.21%), and Immigrants from Central America (44.1%, a difference of 0.37%).
| Demographics | Rating | Rank | Currently Married |
| Immigrants | Cameroon | 0.3 /100 | #249 | Tragic 44.2% |
| Immigrants | Eastern Africa | 0.3 /100 | #250 | Tragic 44.2% |
| Blackfeet | 0.3 /100 | #251 | Tragic 44.2% |
| Hispanics or Latinos | 0.3 /100 | #252 | Tragic 44.1% |
| Immigrants | Central America | 0.3 /100 | #253 | Tragic 44.1% |
| Vietnamese | 0.2 /100 | #254 | Tragic 44.0% |
| Yakama | 0.2 /100 | #255 | Tragic 44.0% |
| Shoshone | 0.2 /100 | #256 | Tragic 44.0% |
| Immigrants | Africa | 0.2 /100 | #257 | Tragic 43.9% |
| Ute | 0.2 /100 | #258 | Tragic 43.9% |
| Immigrants | Sierra Leone | 0.1 /100 | #259 | Tragic 43.8% |
| Immigrants | Latin America | 0.1 /100 | #260 | Tragic 43.8% |
| Immigrants | Nicaragua | 0.1 /100 | #261 | Tragic 43.7% |
| Bangladeshis | 0.1 /100 | #262 | Tragic 43.7% |
| Immigrants | Cuba | 0.1 /100 | #263 | Tragic 43.7% |
Demographics Similar to Ghanaians by Currently Married
In terms of currently married, the demographic groups most similar to Ghanaians are Guatemalan (42.9%, a difference of 0.020%), Immigrants from Middle Africa (43.0%, a difference of 0.13%), Native/Alaskan (42.8%, a difference of 0.29%), Paiute (42.7%, a difference of 0.52%), and Immigrants from El Salvador (43.1%, a difference of 0.53%).
| Demographics | Rating | Rank | Currently Married |
| Central American Indians | 0.0 /100 | #279 | Tragic 43.3% |
| Apache | 0.0 /100 | #280 | Tragic 43.2% |
| Chippewa | 0.0 /100 | #281 | Tragic 43.2% |
| Immigrants | Ecuador | 0.0 /100 | #282 | Tragic 43.2% |
| Kiowa | 0.0 /100 | #283 | Tragic 43.2% |
| Immigrants | El Salvador | 0.0 /100 | #284 | Tragic 43.1% |
| Immigrants | Middle Africa | 0.0 /100 | #285 | Tragic 43.0% |
| Ghanaians | 0.0 /100 | #286 | Tragic 42.9% |
| Guatemalans | 0.0 /100 | #287 | Tragic 42.9% |
| Natives/Alaskans | 0.0 /100 | #288 | Tragic 42.8% |
| Paiute | 0.0 /100 | #289 | Tragic 42.7% |
| Immigrants | Ghana | 0.0 /100 | #290 | Tragic 42.7% |
| Immigrants | Guatemala | 0.0 /100 | #291 | Tragic 42.6% |
| Sub-Saharan Africans | 0.0 /100 | #292 | Tragic 42.6% |
| Yuman | 0.0 /100 | #293 | Tragic 42.6% |